Tài liệu Changing patterns of cardiovascular diseases and cancer mortality in Portugal, 1980--2010 docx
Bạn đang xem bản rút gọn của tài liệu. Xem và tải ngay bản đầy đủ của tài liệu tại đây (1.41 MB, 15 trang )
This Provisional PDF corresponds to the article as it appeared upon acceptance. Fully formatted
PDF and full text (HTML) versions will be made available soon.
Changing patterns of cardiovascular diseases and cancer mortality in Portugal,
1980 2010
BMC Public Health 2012, 12:1126 doi:10.1186/1471-2458-12-1126
Marta Pereira ()
Bárbara Peleteiro ()
Simon Capewell ()
Kathleen Bennett ()
Ana Azevedo ()
Nuno Lunet ()
ISSN 1471-2458
Article type Research article
Submission date 10 September 2012
Acceptance date 27 December 2012
Publication date 29 December 2012
Article URL />Like all articles in BMC journals, this peer-reviewed article can be downloaded, printed and
distributed freely for any purposes (see copyright notice below).
Articles in BMC journals are listed in PubMed and archived at PubMed Central.
For information about publishing your research in BMC journals or any BioMed Central journal, go to
/>BMC Public Health
© 2012 Pereira et al.
This is an open access article distributed under the terms of the Creative Commons Attribution License ( />which permits unrestricted use, distribution, and reproduction in any medium, provided the original work is properly cited.
Changing patterns of cardiovascular diseases and
cancer mortality in Portugal, 1980–2010
Marta Pereira
1*
*
Corresponding author
Email:
Bárbara Peleteiro
2
Email:
Simon Capewell
3
Email:
Kathleen Bennett
4
Email:
Ana Azevedo
1
Email:
Nuno Lunet
1,2
Email:
1
Department of Clinical Epidemiology, Predictive Medicine and Public Health,
University of Porto Medical School and Institute of Public Health of the
University of Porto (ISPUP), Al. Prof. Hernâni Monteiro, Porto 4200-319,
Portugal
2
Department of Clinical Epidemiology, Predictive Medicine and Public Health,
University of Porto Medical School and Institute of Public Health of the
University of Porto (ISPUP), Porto, Portugal
3
Department of Public Health and Policy, University of Liverpool, Liverpool,
UK
4
Department of Pharmacology and Therapeutics, Trinity Centre for Health
Sciences, St James’s Hospital, Dublin, Ireland
Abstract
Background
Cardiovascular diseases and cancer are jointly responsible for more than half all deaths in
Portugal. They also share some important risk factors and act as mutual competing risks. We
aimed firstly to describe time trends in death rates and years of life lost due to cardiovascular
diseases and cancer in the Portuguese population from 1980 to 2010; and secondly to
quantify the contribution of the variation in population and age structure, and age-
independent “risk” by cardiovascular or oncological causes to the change in the
corresponding number of deaths.
Methods
We estimated the annual percent change in age-standardized mortality rates from
cardiovascular diseases and cancer, in each sex. The specific contribution of demographic
changes (due to changes in population size and in population age structure) and the variation
in the age-independent “risk” of dying from the disease to the observed trends in the number
of deaths was quantified using the tool RiskDiff. Years of life lost were computed using the
Global Burden of Disease method.
Results
Among men, the mortality rate from all cardiovascular diseases was more than two-fold
higher than cancer mortality in 1980. However, three decades later mortality from cancer
surpassed cardiovascular diseases. After 2005, the years of life lost from cancer were also
higher than from cardiovascular diseases. Among women, despite the decrease in death rates,
cardiovascular diseases remained the leading cause of death in 2010 and their absolute
burden was higher than that of cancers across the whole period, mainly due to more events in
older women.
Conclusions
In Portugal, the 20th century witnessed a dramatic decrease in the cardiovascular disease
mortality and YLL, and the transition towards cancer. In more recent years, the highest
burdens of disease came from cancers in men and from cardiovascular diseases in women.
Keywords
Cancer, Cardiovascular diseases, Mortality, Trends, Portugal
Background
In 2004, cardiovascular diseases (CVD) were the leading cause of death in the world,
responsible for approximately 32% of all deaths in women and 27% in men. After infectious
and parasitic diseases, cancer ranked third, causing some 12% of all deaths among women
and 13% among men [1]. Taking the age at death into account, however, CVD were
responsible for only 14% and cancer for 8% of the total years of life lost (YLL) in 2004,
surpassed by infectious and parasitic diseases, perinatal conditions and unintentional injuries.
Age-standardized mortality rates from CVD have been declining for several decades in
Europe [2,3], while the downward trend in mortality from some common cancers is more
recent, and varies with the type of cancer. The overall cancer mortality has been decreasing
less steeply, and in some Eastern European countries is still increasing [4]. While the
proportion of all deaths from CVD was almost three-fold higher than from cancer in Europe,
the YLL were less than two-fold higher for CVD than cancer, in 2004 [1,5].
In Portugal, CVD were the leading cause of death in 2006, followed by cancer, and these two
groups of diseases were responsible for more than half of all deaths [6]. Portugal is
characterized by a very higher contribution of cerebrovascular disease to mortality relative to
coronary heart disease [1] and long-standing higher systolic blood pressure, as compared to
most other European countries [7]. The types of cancers that cause more deaths in Portugal
are lung and stomach among men and breast among women [4]. The relatively early stage of
Portugal in the smoking epidemic results in an expected increase in the smoking-related
burden of disease and deaths, particularly among women [8,9].
We aimed to describe time trends in the absolute number of deaths, death rates and YLL from
CVD and cancer in the Portuguese population, during the period 1980–2010, and to quantify
the contribution of the variation in the population’s size and age structure, and age-
independent “risk” of death by cardiovascular or oncological causes to the change in the
corresponding number of deaths.
Methods
Sources of data
The number of deaths from all CVD [International Classification of Diseases 10th revision
(ICD 10): I00-I99; 9th revision (ICD 9): 390–459] and all malignant neoplasms, hereafter just
referred as cancer (ICD 10: C00-C99; ICD 9: 140–239), as well as the estimates of the
population at risk in each year, were obtained from official statistics [10,11].
All data were obtained from 1980 to 2010 for each sex in age groups (<1, 1–4, 5-year age
groups up to 80–84 and ≥85 years).
Trends in mortality rates and years of life lost
Standardized mortality rates were computed by the direct method using the European
standard population as reference [12]. We performed a joinpoint regression analysis, using
Joinpoint® version 3.4 from the Surveillance Research Program of the US National Cancer
Institute [13], to calculate the annual variation in mortality and to identify points of
significant change in the log-linear slope of the trend (joinpoints) [14]. The analysis starts
with the minimum number of joinpoints (no joinpoints corresponds to a straight line), and
tests whether one or more joinpoints significantly improve model fit. The minimum number
of observations from a joinpoint to the earliest or the latest years and between two joinpoints
was set to 5. We present the results of best fitting models for the trends in men and women.
The estimated annual percent change (APC) in mortality for each period was calculated
assuming a Poisson distribution and taking the calendar year as the independent variable.
The analyses of the trends in the mortality rates and numbers of deaths were performed for all
ages and by age groups (0–14, 15–34, 35–54, 55–74 and ≥75 years).
The YLL due to premature mortality for each cause (CVD and cancer), gender and age group
were computed using the Global Burden of Disease method [15] by multiplying the number
of deaths at each age by the life expectancy at the age at which death occurs. We considered
the recommended standard life expectancy at birth of 80 years for men and 82.5 for women.
The average age at death was set to the mid-point of each five-year age group, apart from the
infant deaths (where it is assumed to be 0.1 years in low mortality countries), the 1–4 year
age group (assumed to be 2.6 years) and the oldest group (assumed to be 87.5 years) [15]. We
applied a 3% time discount rate to assign less weight to the YLL corresponding to the periods
more distant to the moment of death than to those referring to the first years after death, an
age-weighting parameter to weigh YLL in very young and old ages less than other ages
(Global Burden of Disease standard value is 0.04) and an age-weighting correction constant
so that the introduction of age-weights did not alter the total number of YLL (Global Burden
of Disease standard value is 0.1658) [15]. The total YLL for each cause and gender was
obtained by adding the YLL of all age groups.
Contribution of changes in demographics and age-independent “risk
We used the tool RiskDiff, a web-based application from the Catalan Institute of Oncology to
assess the specific contribution of demographic changes (due to changes in population size
and in population age structure) and the variation in the age-independent “risk” of dying from
the disease to the observed trends in the number of deaths [16]. This analysis was performed
for the periods with constant log-linear trend identified in the joinpoint analysis. RiskDiff
outputs the results over an entire time period. To allow comparisons among intervals of
different length, we estimated annual effects assuming geometric change over time [17]
Results
Trends in mortality rates and years of life lost
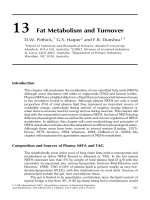
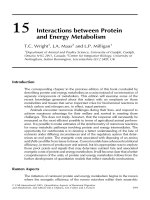
Among men, the age-adjusted mortality from CVD decreased between 1980 and 2010
(Figure 1 and Table 1). The decrease was more pronounced after 1993, with an APC of −4%
per year versus −1.5% per year between 1980 and 1993. The age-adjusted mortality rate from
cancers increased 0.9% per year between 1980 and 1997, then declined slightly, 0.7% per
year, until 2006 and increased 1.5% per year thereafter, in men. Among women, the pattern
of the age-adjusted mortality from CVD was similar to that of men, decreasing between 1980
and 2010, more pronouncedly after 1996, reaching an APC of −4.6% per year. The mortality
rate from cancer increased from 1980 to 1990, then decreased slightly until 2006 (more
steeply between 2002 and 2006, by 2% per year), and then increased 1.3% per year until
2010.
Figure 1 Time trends in cardiovascular diseases and cancer 1980–2010, by sex: numbers
of deaths, age-standardized (European population) mortality rates and years of life lost.
Table 1 Annual change and contribution of demographic changes and age-independent “risk” to cardiovascular diseases and cancer
mortality 1980–2010, by sex
Disease Period * Annual change in
Annual variation in number of deaths due to variation in
Age-standardized
mortality rate %
(95% CI)
Number of
deaths %
Population size
%
Population age
structure %
Age-independent
“risk” %
Men All cardiovascular
diseases
1980-1993 −1.5 (−2.0 to −1.0)
1.00
0.15
2.08
−1.59
1993-2010 −4.3 (−4.7 to −3.9)
−2.20
0.18
1.35
−5.26
All cancers
1980-1997 0.9 (0.7 to 1.1)
2.76
0.28
1.65
1.16
1997-2006 −0.7 (−1.2 to −0.2)
1.18
0.60
1.32
−0.78
2006-2010 1.5 (0.2 to 2.9)
2.85
−0.26
0.66
2.47
Women All cardiovascular
diseases
1980-1996 −2.0 (−2.3 to −1.6)
0.75
0.17
1.98
−1.94
1996-2010 −4.6 (−5.1 to −4.2)
−1.79
0.23
2.00
−5.92
All cancers
1980-1990 0.4 (0.2 to 0.7)
2.09
0.18
1.36
0.65
1990-2002 −0.6 (−0.9 to −0.4)
1.19
0.37
1.32
−0.61
2002-2006 −1.9 (−3.4 to −0.5)
−0.62
0.41
1.26
−2.39
2006-2010 1.3 (0.4 to 2.3)
3.17
−0.10
1.08
2.24
* We considered the periods with constant log-linear trend identified in the joinpoint analysis.
Among men, in 1980 the mortality rate from CVD was more than two-fold higher than that
from cancer, but in 2008 the mortality rate from cancer surpassed the mortality rate from
CVD, due to opposite trends between the two groups of diseases since the mid-2000s (Figure
1 and Table 1); the total number of deaths from CVD was higher than from cancer between
1980 and 2010, but converged to around 15000 deaths each in 2010. Among women, despite
the convergence in the mortality rates from both diseases, CVD remained the leading cause
of death in 2010. Between 1980 and 2010, the burden of CVD was much higher compared to
cancer and, in 2010, CVD were responsible for 10,000 deaths more than cancers.
Among men, the YLL from cancer increased between 1980 and 2010, while the YLL from
CVD decreased, mainly after the mid-1990s (Figure 1); in 2005, the YLL from cancer
surpassed those from CVD and were clearly higher thereafter. Among women, the trends in
YLL from CVD and cancer were very similar to those observed for mortality rates.
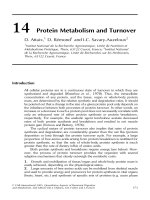
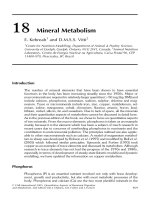
When analyzing trends by age groups, the mortality rate from CVD decreased between 1980
and 2010, for all age groups among men, while a decrease in the mortality rates from cancer
was only observed for the younger age groups (up to 35 years) (Figure 2). Cancer was a cause
of death more frequently than CVD among those under 35 years of age between 1980 and
2010, in the last two decades for those aged 35 to 54 years and in the last decade for those
aged 55 to 74 years. Cardiovascular diseases were the main of these two causes of death from
1980 to 2010 among men aged over 75 years. Among women, the mortality rate from CVD
decreased between 1980 and 2010 in all age groups, while mortality rates decreased in
younger women, with a recent attenuation for ages 35–54 years, and remained approximately
constant in the two older age groups (Figure 2). Cancer was the main cause of death until 55
years between 1980 and 2010 and in the last decade in the age group 55–74 years, while
CVD were always the main cause of death in women over 75 years.
Figure 2 Time trends in cardiovascular diseases and cancer 1980–2010, by sex:
mortality rates and numbers of deaths, by age groups.
Contribution of changes in demographics and age-independent “risk
Between 1980 and 2010, the increase in population size and changes in the age structure
towards a higher proportion of older subjects contributed to an increase in the number of
deaths by CVD (around 0.2% per year and 2% per year, respectively) (Table 1). Similarly,
between 1980 and 2006, the increase of the population size contributed to an increase in the
number of cancer deaths [between 0.2% per year in women (1980–1990) and 0.6% per year
in men (1997–2006)], as did the ageing of the Portuguese population (1.6% per year in men
from 1980 to 1997 and 1.3% per year in men from 1997 to 2006 and in women overall). In
the period 2006–2010, the Portuguese population decreased in number, thereby contributing
to a decrease in number of deaths by cancer (less than 0.3% per year), while the population
ageing contributed to the change in the cancer mortality rates by an annual variation of 0.7%
in men and 1.1% in women (Table 1).
The age-independent “risk” of death from CVD decreased between 1980 and 2010, more
significantly since the mid-1990s, after which point it translated into a decrease in the total
number of deaths of around 2% per year. After declining for several years, the risk of death
from cancers increased by more than 2% per year from 2006 to 2010. Overall, the number of
cancer deaths increased in both sexes between 1980 and 2010, except for a short period
between 2002 and 2006, among women (Table 1).
Discussion
We observed a dramatic decrease in Portuguese CVD mortality rates from 1980 to 2010 in
both sexes. However, this decrease was reflected in a fall in the total number of deaths only
since the mid-1990s, due to the increases and ageing of the population. For cancer, we
observed a much smaller decrease in the mortality rates from the 1990s until 2006 in both
sexes, and an increase thereafter. These trends, together with increased premature mortality
from cancer, meant that in men, YLL from cancer surpassed those from CVD after 2005.
In recent years, cancer has become the leading cause of death among men, in many other
European countries, such as France, Spain, Netherlands and Italy [18,19]. Cardiovascular
diseases and cancer interact as mutually competing risks. The observed decreasing trends in
CVD mortality may have contributed to the recent increase in mortality rates from cancer,
with more individuals surviving at risk of cancer. We also observed a decrease in the number
of deaths caused by gastro-intestinal diseases, injuries and poisoning, and infectious and
parasitic diseases in the last three decades, in Portugal [10]. Since some of these causes of
death are more common in the young and middle-aged population, these trends leave more at
risk for the diseases associated with older age, such as diabetes, CVD or cancer [20].
The mortality trends from CVD in Portugal paralleled steady mortality declines in Western
Europe, North America, Japan and other developed areas of the world [2,3]. This reflects
decreases in both cerebrovascular and ischaemic heart diseases, the two major contributors to
this group and more frequent in the older population [3,21]. In Portugal, cerebrovascular
disease has been the main cause of death during the last decades [6,22]. In developed
countries, the mortality rates from stroke have been decreasing more steeply in countries with
higher departure rates, which is the case of Portugal [23]. This could reflect general
improvements in living conditions, lower salt consumption thanks to improved methods for
food preservation and recently, perhaps, lower case-fatality due to stroke units and better
emergency care [24]. Regarding ischaemic heart disease, modeling studies in many
developed countries consistently suggest that 45% to 75% of the mortality declines can be
attributed to decreases in major risk factors, with the remaining attributable to medical and
surgical treatments [25-28]. In Portugal, we likewise observed notable decreases in the mean
systolic blood pressure and blood cholesterol, smoking consumption among men, and some
dietary modifications, accompanied by the increased use of therapies for acute coronary
syndromes [7,9,29,30]. Deaths from CVD in younger age groups probably reflected
improved diagnostic capacities and successful early surgical interventions for congenital
heart disease, plus better medical care for hypertension, cardiac arrhythmias and endocarditis
[31]. The pattern in the trends of YLL suggests that death by CVD is being increasingly
delayed, clearly affecting mostly the elderly population.
Interpreting trends in cancer mortality rates can be challenging, because they reflect trends in
several common cancers. In Portugal, the specific cancers that could particularly contribute to
the slight decrease in overall cancer mortality rate between the 1990s and 2006 among adults
include stomach cancer (in both sexes), prostate and lung among men and breast and uterus
among women [4]. Despite the trends in mortality rates, the total number of deaths and YLL
have increased steadily. Among the more frequent cancers stomach, lung and breast cancer
are associated with death at relatively younger ages [20], contributing more to the increase in
YLL due to cancer. On the other hand, we expected a lower contribution to YLL from
prostate cancer, since this is a disease mainly of the elderly population [20]. In younger ages,
the decrease in leukaemia may also contribute [4]. The few adult cancers increasing in more
recent years differ between women and men. In women, the very recent increase in breast
cancer mortality plus the long-term increase in the lung cancer mortality could help explain
the turning point observed in the cancer mortality rate and YLL in 2006 [32]. In men,
colorectal cancer is the only common cancer which is increasing [10]. However, further close
analyses during the forthcoming years are clearly necessary to confirm that the trends
observed in the 4 years since 2006 persist longer term. The steady decline in cancer mortality
is likely to reflect improvements in risk factors such as male smoking and diet, compounded
by better access to earlier and specialized diagnosis, staging and treatment [33]. Worryingly,
the mortality for some cancers has increased since 2006, which may reflect an increase
exposure to other risk factors, such as obesity [34]. The transition to a more Westernized diet
has occurred faster in Portugal than in some other Mediterranean countries [35]. The
continued increases in smoking among women across the Eastern, Western and Southern
parts of Europe [36] are very concerning. Unless halted, these will inevitably increase cancer
mortality among women in Portugal. Furthermore, the late implementation and the low
participation rate in organised cancer screening programmes [37] may delay the potential
benefits. In 2008, the breast and cervical cancer screening did not cover the entire country
and the screening program for colorectal cancer was still in its infancy [37]. Apart from the
variation in the population structure, we identify an increase in the risk of dying from cancer
after 2006, which inverts the previous decrease observed in the 1990s.
The interpretation of the reported trends depends on the quality of the source data.
Misattribution or miscoding can occur mainly because of incorrect diagnoses, incorrect or
incomplete death certificates, misinterpretation of ICD rules for coding underlying causes,
and variations in the use of categories for unknown and ill-defined causes [38]. Like most
developed countries Portuguese mortality data have high coverage, but have been considered
to have low quality regarding the high proportion (21%) of deaths coded as ill-defined causes
[38]. Additionally, and more specifically, there is evidence of inaccuracies in attribution of
frequent causes of death. For instance, in a validation study in the mid-2000s, stroke was not
confirmed in a large proportion of death certificates indicating it as the underlying cause of
death, and 5% of patients were identified only after the review of death certificates [39]. The
accuracy in attribution to causes of death varies over time due to quality of diagnoses and
also due to changes in the coding rules. In Portugal, two revisions of the ICD were used in the
calendar period considered in this study, with ICD-10 replacing ICD-9 in 2002. However,
since the ICD-10 is more detailed than ICD-9 and we used two large groups of diseases,
without focusing on very specific codes, errors might have been minimised.
Although we do not have information on CVD incidence and case-fatality in this population,
we predict that death from CVD will be mainly associated with old age in Portugal, as in
highly developed Western European countries. However, the prevalence of CVD is likely to
increase and so is the related demand for healthcare. The observed trends in cancer mortality
highlight the importance of primary and secondary prevention, demanding better planning in
health services, in order to obtain improvements in earlier detection and/or increasing
proportions of patients receiving new or more aggressive treatment.
Conclusions
The 20th century witnessed a dramatic decrease in cardiovascular disease mortality and YLL
in Portugal and a recent transition towards a higher burden of cancer. Furthermore, the
sustainability of gains against CVD is threatened by recent trends in obesity among men and
women and increasing smoking among women. These same risk factors play an important
causal role in several cancers, highlighting the importance of future prevention strategies.
This analysis of the mortality data taking into account demographic effects, produced results
that are easily usable for policy makers. The data on the absolute number of cases and
demographic determinants is potentially highly relevant for planning purposes and also for
predicting future needs.
Abbreviations
YLL, Years of life lost; ICD, International Classification of Diseases; APC, Annual percent
change.
Competing interests
The authors declare that they have no competing interests.
Authors’ contributions
MP, collaborated in the acquisition, analysis and interpretation of the data, and wrote the first
draft of the article. BP, collaborated in the in the acquisition, analysis and interpretation of the
data, and in the revision of the article. SC, collaborated in the interpretation of the data and
reviewed the article critically for important intellectual content. KB, collaborated in the
interpretation of the data and reviewed the article critically for important intellectual content.
AA, designed the study, analysed and interpreted the data, and reviewed the article critically
for important intellectual content. NL, designed the study, analysed and interpreted the data,
and reviewed the article critically for important intellectual content. All authors read and
approved the final manuscript.
Acknowledgements
This study was funded by two grants from Fundação para a Ciência e a Tecnologia
(PIC/IC/83006/2007 and PTDC/SAU-EPI/122460/2010).
References
1. The global burden of disease 2004 update. Geneva: World Health Organization; 2008.
2. Levi F, Lucchini F, Negri E, La Vecchia C: Trends in mortality from cardiovascular
and cerebrovascular diseases in Europe and other areas of the world. Heart 2002,
88(2):119–124.
3. Levi F, Chatenoud L, Bertuccio P, Lucchini F, Negri E, La Vecchia C: Mortality from
cardiovascular and cerebrovascular diseases in Europe and other areas of the world: an
update. Eur J Cardiovasc Prev Rehabil 2009, 16(3):333–350.
4. La Vecchia C, Bosetti C, Lucchini F, Bertuccio P, Negri E, Boyle P, Levi F: Cancer
mortality in Europe, 2000–2004, and an overview of trends since 1975. Ann Oncol 2010,
21(6):1323–1360.
5. YLL by cause, in WHO Regions, estimates. 2004.
6. Risco de Morrer em Portugal 2006. Lisboa: Direcção-Geral da Saúde; 2009.
7. Pereira M, Carreira H, Vales C, Rocha V, Azevedo A, Lunet N: Trends in hypertension
prevalence (1990–2005) and mean blood pressure (1975–2005) in Portugal: a systematic
review. Blood Press 2012, 27(4):220–226.
8. Alves L, Bastos J, Lunet N: Trends in lung cancer mortality in Portugal (1955–2005).
Rev Port Pneumol 2009, 15(4):575–587.
9. Carreira H, Pereira M, Azevedo A, Lunet N: Trends in the prevalence of smoking in
Portugal: a systematic review. BMC Public Health 2012, 12(1):958 [Epub ahead of print].
10. Óbitos (N.º) por Sexo e Causa de morte; Anual.
11. Estimativas Anuais da População Residente.
12. Waterhouse JAH, Muir CS, Correa P, Powell J: Cancer incidence in five continents.
Lyon: IARC; 1976.
13. Software: Jointpoint regression program. Version 3.4.
14. Kim H-J, Fay MP, Feuer EJ, Midthune DN: Permutation tests for joinpoint regression
with applications to cancer rates. Stat Med 2000, 19(3):335–351.
15. Mathers C, Vos T, Lopez A, Salomon J, Ezzati M: National Burden of Disease Studies:
A Practical Guide. In Global Program on Evidence for Health Policy. 20 Eth edition.
Geneva: World Health Organization; 2001.
16. RiskDiff: web-based application.
17. Forthofer R, Lee E, Hernandez M: Biostatistics: a guide to design, analysis, and
discovery. Oxford: Elsevier; 2007.
18. Allender S, Scarborough P, Peto V, Rayner M, Leal J, Luengo-Fernandez R, Gray A:
European Cardiovascular Disease Statistics, 2008 edition. University of Oxford: Department
of Public Health; 2008.
19. Giovannetti L, Gorini G, Martini A, Chellini E, Fornai MG, Sorso B, Seniori-Costantini
A: Is cancer overtaking cardiovascular diseases as the killer number one in men in
Tuscany? Tumori 2011, 97:14–18.
20. Machado V, Lima G, Teixeira C, Felício M, Northern Region Health Administration
Public Institute: Global Burden of Disease in the Northern Region of Portugal. 2011.
21. Ribeiro AI, Lopes C, Barros H, de Pina MF: After a quarter of century, reduction in
Coronary Heart Disease Mortality bypassed young adult males in Portugal. Int J Cardiol
2011, 152(2):279–281.
22. Risco de Morrer em Portugal 1990. Lisboa: Direcção-Geral dos Cuidados de Saúde
Primários; 1992.
23. Sarti C, Rastenyte D, Cepaitis Z, Tuomilehto J: International trends in mortality from
stroke, 1968 to 1994. Stroke 2000, 31(7):1588–1601.
24. Fonseca T, Clara JG: Stroke units. The first-year results of Pulido Valente Hospital
Stroke Unit. Rev Port Cardiol 2004, 23(10):1227–1241.
25. Palmieri L, Bennett K, Giampaoli S, Capewell S: Explaining the decrease in coronary
heart disease mortality in Italy between 1980 and 2000. Am J Public Health 2010,
100(4):684–692.
26. Ford ES, Ajani UA, Croft JB, Critchley JA, Labarthe DR, Kottke TE, Giles WH,
Capewell S: Explaining the decrease in U.S. deaths from coronary disease, 1980–2000. N
Engl J Med 2007, 356(23):2388–2398.
27. Unal B, Critchley JA, Capewell S: Explaining the decline in coronary heart disease
mortality in England and Wales between 1981 and 2000. Circulation 2004, 109(9):1101–
1107.
28. Laatikainen T, Critchley J, Vartiainen E, Salomaa V, Ketonen M, Capewell S:
Explaining the decline in coronary heart disease mortality in Finland between 1982 and
1997. Am J Epidemiol 2005, 162(8):764–773.
29. Carreira H, Pereira M, Alves L, Lunet N, Azevedo A: Dyslipidaemia, and mean blood
cholesterol and triglycerides levels in the Portuguese population: a systematic review.
Arq Med 2012, 26(3):112–123.
30. Santos JF, Aguiar C, Gavina C, Azevedo P, Morais J: Portuguese Registry of Acute
Coronary Syndromes: seven years of activity. Rev Port Cardiol 2009, 28(12):1465–1500.
31. Gilboa SM, Salemi JL, Nembhard WN, Fixler DE, Correa A: Mortality resulting from
congenital heart disease among children and adults in the United States, 1999 to 2006.
Circulation 2010, 122(22):2254–2263.
32. Bosetti C, Malvezzi M, Rosso T, Bertuccio P, Gallus S, Chatenoud L, Levi F, Negri E, La
Vecchia C: Lung cancer mortality in European women: Trends and predictions. Lung
Cancer 2012, 78(3):171–178.
33. Karim-Kos HE, de Vries E, Soerjomataram I, Lemmens V, Siesling S, Coebergh JW:
Recent trends of cancer in Europe: a combined approach of incidence, survival and
mortality for 17 cancer sites since the 1990s. Eur J Cancer 2008, 44(10):1345–1389.
34. Finucane MM, Stevens GA, Cowan MJ, Danaei G, Lin JK, Paciorek CJ, Singh GM,
Gutierrez HR, Lu Y, Bahalim AN, et al: National, regional, and global trends in body-
mass index since 1980: systematic analysis of health examination surveys and
epidemiological studies with 960 country-years and 9.1 million participants. Lancet
2011, 377(9765):557–567.
35. Chen Q, Marques-Vidal P: Trends in food availability in Portugal in 1966–2003:
comparison with other Mediterranean countries. Eur J Nutr 2007, 46(7):418–427.
36. Strong K, Guthold R, Yang J, Lee D, Petit P, Fitzpatrick C: Tobacco use in the
European region. Eur J Cancer Prev 2008, 17(2):162–168.
37. Bastos J, Peleteiro B, Gouveia J, Coleman MP, Lunet N: The state of the art of cancer
control in 30 European countries in 2008. Int J Cancer 2010, 126(11):2700–2715.
38. Mathers CD, Fat DM, Inoue M, Rao C, Lopez AD: Counting the dead and what they
died from: an assessment of the global status of cause of death data. Bull World Health
Organ 2005, 83(3):171–177.
39. Correia M, Silva MR, Matos I, Magalhaes R, Lopes JC, Ferro JM, Silva MC: Prospective
community-based study of stroke in Northern Portugal: incidence and case fatality in
rural and urban populations. Stroke 2004, 35(9):2048–2053.
Figure 1
Figure 2