Tài liệu Quantitative aspects of ruminant digestion and metabolism - Phần 9 pptx
Bạn đang xem bản rút gọn của tài liệu. Xem và tải ngay bản đầy đủ của tài liệu tại đây (370.36 KB, 54 trang )
11
Glucose and Short-chain
Fatty Acid Metabolism
R.P. Brockman
St. Peter’s College, Muenster, Saskatchewan, Canada
Introduction
The characteristic feature of ruminants is the fermentative nature of their
digestion. This feature of their digestive system allows them to survive on
high-fibre diets (Leng, 1970). The principal products of fermentation of dietary
fibre are short-chain fatty acids, the most important of which are acetate,
propionate and butyrate (Kristensen et al., 1998; Majdoub et al., 2003).
They account for more than 70% of the animals’ caloric intake (Bergman,
1990). Since the dietary carbohydrate is fermented, ruminant animals normally
absorb little or no dietary carbohydrate as hexose sugar (see Chapter 10), and
their glucose needs must be met by gluconeogenesis even in the fed state
(Bergman et al., 1970; Lomax and Baird, 1983). In animals consuming high
concentrate diets not all of the carbohydrate may be fermented, but even then
the absorption of hexose sugar from the gut accounts for less than one-third of
the whole-body glucose turnover (van der Walt et al., 1983). Unlike in simple-
stomached animals, in ruminants the liver is incapable of having a net uptake of
glucose (Brockman, 1983).
Metabolism of Glucose
Methodology
Any discussion of the quantitative aspects of metabolism requires a discussion
of the techniques used to obtain the information. Estimates of the rates of
production and utilization of metabolites in vivo have been made principally
using two techniques: isotope dilution and arteriovenous catheterization. Sev-
eral isotopes may be used simultaneously. In addition, isotope dilution has been
combined with the arteriovenous difference technique.
ß CAB International 2005. Quantitative Aspects of Ruminant Digestion
and Metabolism, 2nd edition (eds J. Dijkstra, J.M. Forbes and J. France)
291
The use of isotope dilution techniques allows the measurement of the rate
of turnover or irreversible loss of metabolites with minimal invasion of the body
(Leng, 1970). The least invasive approach is to place indwelling catheters into
the jugular veins. The labelled metabolite may be administered as a single
injection or continuous infusion. Blood samples are taken and the amount of
isotope is determined for the selected metabolites in the blood or plasma pool.
This gives estimates of the exit/entry of the metabolites into blood or plasma.
The simplest approach is to make the determinations when the system is in
steady-state, but the measurements can also be made under non-steady-state
conditions (Brockman and Laarveld, 1986). Under steady-state conditions,
when the pool for a certain metabolite does not vary substantially over a
given period of time, the rate of entry of the metabolite into the pool equals
the rate of exit and represents its rate of turnover. The turnover rate may also
be determined by measuring the rate of exit of the isotope from the blood or
plasma pool after a single injection from the rate of decrease of the label in
blood or plasma. With the continuous infusion of label the ratio of the infusion
rate to the specific radioactivity of the metabolite gives the turnover rate
(turnover rate ¼ infusion rate/specific radioactivity).
The label also influences the estimates obtained. For example, glucose
turnover may be estimated using (U-
14
C)glucose or tritiated or deuterated
glucose (Bergman et al., 1974). The carbon label may go from glucose to
pyruvate or lactate and back to glucose. When this occurs, the exit and re-entry
of the label from and to the glucose pool is not detected. This recycling error
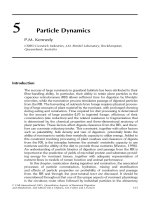
can be avoided by using other labels, such as tritium, or deuterium. However,
the label in the 2-position is lost in the hexose phosphate isomerase reaction,
whereas it is lost from the 6-position during the metabolism of pyruvate (see
Fig. 11.2). When glucose goes to fructose-6-phosphate and back to glucose,
the 2-label will show a loss of glucose, but the 6-label will not. Thus, the
14
C-
labelled isotope gives the lowest estimates of turnover rates and because of
recycling of the label underestimates the true rate of glucose production.
Glucose labelled in the 6-position with tritium gives estimates about 10% higher
and in 2 or 3 position about 15% higher than
14
C-labelled glucose (Bergman
et al., 1974). Because of the loss of label in the hexose phosphate isomerase
reaction, the latter probably overestimates the rate of turnover of glucose. The
best estimate is probably obtained with tritium label on the 6-carbon.
Double isotope techniques are useful to measure glucose turnover, sub-
strate turnover and incorporation of substrate into glucose simultaneously
(Brockman and Laarveld, 1986). Tritiated glucose may be used to measure
glucose turnover while the carbon label may be used to monitor the glucose
precursor. This approach eliminates the need to conduct separate experiments
to obtain data for two metabolites, thereby reducing inter-experimental error.
Measuring the appearance of the carbon label into glucose may assess the
fate of the metabolite. The specific radioactivities of the precursor and product
(glucose) are determined and the fraction of product produced is the ratio of
the specific radioactivities of product:precursor. A limitation of this method
is that the estimate of glucogenic potential is underestimated because the
calculation is based on blood or plasma specific radioactivity of the precursor.
292 R.P. Brockman
The intracellular activity and intracellular dilution of the isotope are ignored. For
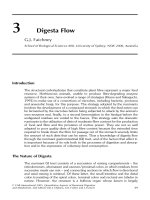
example, crossing-over of isotopic carbons between metabolic pathways with
common intermediates, as between respiratory and gluconeogenic pathways
both of which involve oxaloacetate (see Fig. 11.1) may occur. This reduces
intracellular specific radioactivity (the exchange of oxaloacetate between the
two oxaloacetate pools will reduce the labelled oxaloacetate in the gluconeo-
genic pool). Thus, the use of the specific radioactivity of the precursor in the
blood or plasma, which is greater than the specific radioactivity of the precursor
at the site of metabolic use, causes an underestimation of the rate of conversion
of precursor to product. Consequently, estimates of the rate of conversion of
precursor to product obtained by isotopic dilution are minimal estimates.
The arteriovenous catheterization approach allows the isolation of individ-
ual organs in vivo (Bergman et al., 1970; Kaufman and Bergman, 1974). The
blood supplying and draining the organ is sampled, which, with measurement
Pyruvate
Respiration
CO
2
CO
2
Pyruvate
Acetyl-CoA
Glucose
Gluconeogenesis
Oxaloacetate
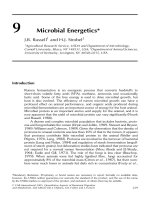
Fig. 11.1. Schematic
representation of respiration and
gluconeogenesis showing how
crossing-over may occur when
two pathways have a common
intermediate, in this case
oxaloacetate. Exchange between
the two pathways intracellularly
would reduce the specific
radioactivity of the oxaloacetate
in the gluconeogenic pool when
a glucose precursor is the source
of the label.
HO
C
COH
OH
OH
OH
OH
H
H
D
D
DC
C
C
C
D
HO
C
COH
OH
OH
OH
OPO
3
H
H
D
D
DC
C
C
C
D
H
C
CO
OH
HO
OH
OH
OPO
3
H
H
D
DC
C
C
C
D
H
(2,3,6,6D
4
)-Glucose (2,3,6,6D
4
)-Glucose-6-P (3,6,6D
3
)-Fructose-6-P
Fig. 11.2. A schematic representation of the loss of label from the 2-position, but not the 3 and
6 positions, of glucose during the isomerase reaction. In this reaction glucose-6-phosphate is
converted to fructose-6-phosphate.
Glucose and Short-chain Fatty Acid Metabolism 293
of the rate of blood flow, gives estimates of the net organ uptake or output.
While the error of individual determinations in the blood samples may be low,
the error of the net metabolism may be high, particularly when the concentra-
tion differences across the organ are low compared to the concentration of the
respective metabolite in the vessels. This is the case for glucose across the
portal-drained viscera and liver where the arteriovenous differences are less
than 5% of the concentration in each vessel (Bergman et al., 1970). The
analytical error for the arteriovenous differences may be more than 20 times
greater than the error in determining the concentrations in each vessel.
This technique cannot distinguish between different uses within the organ.
Thus, it represents a maximum estimate of utilization for a specific purpose and
overestimates the rate of utilization. For example, the net hepatic uptake of
lactate may be three times the incorporation of lactate into glucose (Brockman
and Laarveld, 1986). In those organs that are net producers of a metabolite,
this approach does not show what has been produced and used intracellularly
and underestimates the rate of production by the organ. Thus, the true rates of
production and utilization lie somewhere between the values obtained by
isotopic and arteriovenous difference techniques.
When the two techniques are combined, utilization and production within
specific organs can be determined simultaneously. In addition to giving better
estimates of organ production the dual approach allows the determination of
metabolic interconversions within individual organs (van der Walt et al., 1983).
Glucose-producing organs and glucose production
Many studies have estimated the rates of glucose production by ruminants
under varying dietary and physiological conditions. An adult sheep (50–
55 kg) on a maintenance diet produces approximately 25 mmol/h of glucose
(Bergman et al., 1974). Pregnant animals with the same food intake produce
more glucose, with the amount increasing up to 50% during late pregnancy
(Steel and Leng, 1973a; Wilson et al., 1983). This indicates that endogenous
sources of glucose precursors are used to a greater extent during pregnancy. As
feed intake increases so does the rate of glucose production. Animals on an ad
libitum diet produce about 50% more glucose than animals on a maintenance
diet (Steel and Leng, 1973a; Wilson et al., 1983). The highest rates of glucose
production occur in lactating animals, where the production rates correlate
with the increased food intake (Wilson et al., 1983). For example, lactating
ewes which received twice as much food (2500 vs. 1200 g/day of dried grass)
produced proportionately more glucose (46–52 mmol/h) than non-pregnant,
non-lactating animals (22 mmol/h).
The most important substrate for glucose synthesis in fed animals is pro-
pionate (Table 11.1). Ruminal propionate may account for more than half of
the substrate used in glucose synthesis in fed animals (Leng et al., 1967;
Judson and Leng 1973b; Amaral et al., 1990). Isotopic studies have shown
that in sheep, propionate in the blood accounts for only about one-third of the
glucose synthesis (Bergman et al., 1966). This implies that not all of the
294 R.P. Brockman
propionate produced in the rumen is absorbed as propionate (see below).
Lactate/pyruvate accounts for 15% of the glucose, with amino acids and
other precursors making up the difference. The percentage of glucose derived
from lactate/pyruvate appears to be relatively constant over a variety of
physiological conditions. It appears that in cattle propionate may account for
50–60% of the glucose and 11–35% of the lactate (Danfaer et al., 1995;
Lozano et al., 2000). Amino acids, based on net hepatic uptake, may contrib-
ute 30% or more to glucose production.
In fasted animals obviously less propionate is available. Then the glucose-
producing organs must look to endogenous sources of substrate for gluconeo-
genesis, and glycerol from lipolysis becomes a more important glucose precur-
sor; its contribution may reach 40% during fasting (Bergman et al., 1968).
While many studies have shown that amino acids are glucogenic, the best
estimates of glucogenic potential are the differences after everything else is
accounted for. Not surprisingly, the rate of glucose production is linearly related
to the availability of its precursors in plasma (cf. Lindsay, 1978). That does not
mean that glucose synthesis is not subject to hormonal regulation. The output
of glucose by the sheep liver and uptake of some glucose precursors have been
shown to increase markedly during exercise (Brockman, 1987) and glucagon
administration (Brockman, 1985; Brockman et al., 1975) and decrease during
insulin administration (Brockman and Laarveld, 1986).
The organs that may release glucose into the blood are liver, gut and
kidney. The liver is the most important glucose-producing organ in the rumin-
ant. It accounts for 85–90% of whole-body glucose turnover in animals on a
roughage diet (Bergman et al., 1970). Since the rate of absorption of hexose
sugar from the gut is low, the ruminant animal has little need to remove glucose
from the portal blood. Not surprisingly, the ruminant liver has little or no
glucokinase and little hexokinase (Ballard et al., 1969). Experimentally, hyper-
glycaemia with high plasma insulin concentrations did not induce a net uptake
of glucose by the liver (Brockman, 1983). This indicates that physiologically the
Table 11.1. Summary of the fraction of glucose derived from various substrates in sheep
(data from Bergman et al., 1966, 1968; Lindsay, 1978).
% of Glucose turnover % of Hepatic extraction
Metabolite Fed Fasted Pregnant Fed Fasted Pregnant
Propionate
a
Blood 27–40 ÀÀ 85–90 85–90 À
Rumen 40–50 À 34–43 n.a. n.a. n.a.
Lactate/pyruvate 15–20 13 10–15 8–15 20–30 29
Glycerol 5 15–30 18–40
b
40–50 60–70 À
Alanine 5–6 5–7 À 7–11 15 24
a
Values were calculated from infusion of labelled propionate intraruminally and intravenously. The contri-
bution of propionate depends on the duration of fasting.
b
Values were taken from ketotic sheep.
Glucose and Short-chain Fatty Acid Metabolism 295
ruminant liver always has a net output of glucose (Bergman et al., 1970;
Brockman, 1983), even in the fed state and in animals on high concentrate
diets (van der Walt et al., 1983).
As discussed above, the absorption of glucose from the gut of ruminants on
a roughage diet is minimal (Bergman et al., 1970; Baird et al., 1980; Lomax
and Baird, 1983). Normally the portal-drained viscera is a net user of glucose,
whose use amounts to 5–15% (about 2 mmol/h) of hepatic glucose production
(Bergman et al., 1970). However, when the ruminant animal eats a concen-
trate diet, glucose absorption from the gut may account for up to 30% of the
whole-body glucose turnover (van der Walt et al., 1983). This is obviously a
function of the extent of fermentation in the rumen.
The role of the kidney in producing glucose is similarly small. Net renal
production of glucose accounts for about 10% of whole-body glucose turnover,
or about 2 mmol/h (Bergman et al., 1974; Kaufman and Bergman, 1974).
Isotopic studies suggest that the kidney may produce as much as 15% of the
glucose (van der Walt et al., 1983), assuming that the kidney is the only organ
other than the liver and gut capable of glucose production.
The renal uptake of lactate, pyruvate, glycerol and alanine accounts for
nearly 90% of its glucose output by the kidney (Table 11.2), with lactate
providing for half of this. In vivo studies have shown that propionate may be
used by the kidney for glucose synthesis as effectively as lactate or glycerol
(Krebs and Yoshida, 1963; Faulkner, 1980). However, the amount of propi-
onate reaching the kidney is small compared to that reaching the liver (Berg-
man and Wolff, 1971). The concentration of propionate in arterial plasma is
12–30 mM (Bergman and Wolff, 1971; Baird et al., 1980). If the kidney
extracts propionate as efficiently as the liver, the arteriovenous difference
across the kidney would be 10–25 mM, which is 20–55% of the arteriovenous
difference for glucose (Table 11.2). Thus, propionate could account for 10–
25% of net renal glucose production. That is equivalent to the glucogenic
potential of pyruvate, glycerol or alanine (Table 11.2). It seems that as a
fraction of organ production it may be equal to the contribution of propionate
to glucose synthesis in the liver (see above).
Table 11.2. Arterial concentrations, arteriovenous concentration differences (A–V) and net
renal uptake (negative values are production) of glucose, lactate, glycerol and alanine in sheep
(data from Kaufman and Bergman, 1974; Heitmann and Bergman, 1980).
Artery (mM) A–V (mM) Uptake (mmol/h)
Metabolite Fed Fasted Pregnant Fed Fasted Pregnant Fed Fasted Pregnant
Glucose 2700 2600 2900 À45 À55 À53 À2.5 À3.0 À4.3
Lactate 761 892 848 52 54 56 2.9 2.8 4.6
Pyruvate 53 76 56 7 13 3 0.4 0.7 0.3
Glycerol 67 149 41 11 13 14 0.5 0.8 1.0
Alanine 87 96 À 13 10 À 0.5 0.4 À
296 R.P. Brockman
Glucose Utilization
Not all organs and tissues use glucose at the same rate (Table 11.3). The
muscle, as reflected by the hind limb, extracts 3% of the glucose, which passes
through in blood. However, because of the muscle mass, muscle utilization may
account for 20–40% of the glucose turnover (Oddy et al., 1985). Moreover,
glucose uptake by muscle is subject to hormonal regulation (Jarrett et al.,
1976). Insulin appears to be able to increase the uptake as much as fivefold
at high concentrations (Table 11.3; Jarrett et al., 1974; Hay et al., 1984;
Prior et al., 1984). As would be expected the fractional extraction of glucose by
the hind limb in diabetic sheep is lower than in normal sheep (Jarrett et al.,
1974). Fat, as shown by tail fat pad studies (Khachadurian et al., 1966),
extracts about 10% of the glucose presented to it, suggesting that fat may be
more efficient at removing glucose than muscle. However, the differences may
be a reflection of differences in blood flow through the tissues, that is, a lower
blood flow through fat may allow a higher extraction ratio. Glucose extraction
by the fat pad was also increased by insulin (Khachadurian et al., 1966). In both
fat and muscle tissue insulin, concentrations of which are high in blood during
feasting and low during fasting, appears to play a role in the regulation of
glucose uptake by altering the efficiency of extraction.
The portal-drained viscera accounts for 20–30% of the whole-body glucose
turnover (5–7 mmol/h). Estimates of utilization by the liver range from 0% to
15% (0–3 mmol/h) (Bergman et al., 1970). The fractional extraction by the
brain is about 18% and this does not change with fasting (Pell and Bergman,
1983). The brain accounts for over 10% of the whole-body glucose utilization
(2.4 + 0.2 mmol/h), which is used for 97% of oxygen uptake by the brain
(Oyler et al., 1970; Pell and Bergman, 1983). The estimates of fractional
extraction of glucose by the uterus range from 8% to 30% (Morriss et al.,
1980; Hay et al., 1984) and by the mammary gland 25–50% (Bickerstaffe et al.,
1974; Laarveld et al., 1981), depending on the stage of pregnancy or milk
Table 11.3. Arterial concentrations, arteriovenous concentration differences (AÀV) and
fractional extraction of glucose by various organs during periods of high and low plasma insulin
concentrations in sheep (data from Khachadurian et al., 1966; Hay et al., 1984; Oddy et al.,
1985).
Artery (mM) AÀV (mM) Extraction (ratio)
Insulin status Low High Low High Low High
Organ/tissue
Hind limb 3.3 3.3 0.08 0.72 0.02 0.15
Tail fat pad 9.5
a
6.6 1.60 2.28 0.25 0.35
Tail fat pad 3.7
b
2.2 0.39 0.83 0.11 0.38
Uterus 3.3 3.3 1.15 1.19 0.35 0.36
Mammary gland 3.1 3.3 0.72 0.70 0.23 0.22
a
These values are from the perfused fat pad.
b
These values are from the intact animal.
Glucose and Short-chain Fatty Acid Metabolism 297
yield, in other words according to the organs’ needs. Studies in sheep, which
were about 20 weeks pregnant, showed a strong correlation between blood
glucose concentration and uterine uptake of glucose (Leury et al., 1990). As
the blood glucose concentrations decreased during underfeeding (from
2.65 + 0.10 to 1.42 + 0.12 mM), uterine uptake of glucose went from
15.0 + 1.6 to 7.8 + 0.6 mmol/h.
The sheep fetus relies on placental transport to meet about half of its glucose
needs (Hodgson et al., 1981). The glucose uptake by the pregnant uterus is
greater than the glucose utilization by the fetus. The glucose used by the fetus
accounts for 28% of the glucose taken up by the uterus (Meschia et al., 1980).
Another 20% of glucose removed by the uterus is taken up by the fetus as lactate.
Thus, the fetus uses about half the glucose, which is removed by the uterus from
the blood. This is discussed in greater detail in Chapter 20.
The major use of glucose in the mammary gland is for the production of
lactose. This accounts for 50–60% of the glucose uptake by the bovine mam-
mary gland (Bickerstaffe et al., 1974; Baird et al., 1983). In sheep, glucose
uptake by the mammary gland is equivalent to 70% of lactose in the milk (Oddy
et al., 1985). The fractional extraction of glucose by the mammary gland
(Laarveld et al., 1981) and uterus (Morriss et al., 1980; Hay et al., 1984)
does not change during starvation or insulin administration (Table 11.3). These
organs appear to use glucose in direct proportion to the amount presented to
them at all times. The hormonal regulation of glucose utilization seems to be
directed at those organs which may store glucose, specifically muscle and fat, or
which do not have constant needs for glucose. Regulation of glucose uptake by
essential organs, i.e. the brain, mammary gland and uterus, appears to be
based on availability, not by changing the extraction percentage or efficiency.
Glucose–Lactate Interrelations
Lactate is a major precursor of glucose. It is second only to propionate in its
glucogenic potential in fed ruminants (see Table 11.1 above). Lactate is a
product of digestion and is produced endogenously in nearly every organ.
Lactate turnover in fasted non-pregnant, non-lactating sheep is about
20–30 mmol/h (Annison et al., 1963a; Reilly and Chandrasena, 1978; Brock-
man and Laarveld, 1986) of which 20% is produced by the portal-drained
viscera and 6% by the liver. In fed sheep lactate turnover is about 40% higher
than in fasted sheep, or 30–50 mmol/h (Annison et al., 1963a), reflecting a
greater dietary contribution. Net production by the portal-drained viscera is
8–10 mmol/h in fed sheep and production by these tissues may account for
up to 60% of the whole-body turnover (van der Walt et al., 1983; Brockman,
1987). Endogenous lactate is produced by muscle, which always has a net output
of lactate, except perhaps during exercise (Jarrett et al., 1976), and adipose
tissue, which also has a net production of lactate. In the latter, lactate production
is equal to about half its glucose uptake (Khachadurian et al., 1966).
The brain also produces lactate. Fasted sheep have a net output of lactate,
but in fed sheep the brain has a net output of pyruvate, which equals the
298 R.P. Brockman
lactate uptake. Lactate output by the brain is only a small fraction (6–15%) of
glucose uptake (Pell and Bergman, 1983).
The ratios of organ production and utilization of lactate change during
pregnancy and lactation. The uteroplacental unit is a net producer of lactate,
whereas the mammary gland is a net user of lactate. In pregnant sheep
extrahepatic production of lactate may be 75% of the whole-body turnover
compared to about 55% of production by the portal-drained viscera in non-
pregnant animals (van der Walt et al., 1983). Lactate released into the maternal
blood may account for 15–20% of the glucose utilization by the uteroplacental
unit (Meschia et al., 1980); an equivalent amount of lactate goes to the fetus.
Thus, lactate production may account for one-third of the glucose taken up by
the uterus, another third is taken up by the fetus as glucose.
The net uptake of lactate by the mammary gland of lactating animals is
equal to about 20% of its glucose uptake on a molar basis (Oddy et al., 1985).
The liver uses more of the lactate, and is normally a net user of lactate (Table
11.4). About one-third of the lactate is removed by the liver and appears as
glucose in fasted sheep (Brockman and Laarveld, 1986). The extraction of
lactate by the liver varies with the dietary intake or physiological status (Brock-
man and Laarveld, 1986; Brockman, 1987) and is subject to hormonal regu-
lation, the most important of which is insulin. While in the pregnant animal
75% of the lactate is used by the liver, presumably for gluconeogenesis, in the
lactating animal about 40% of lactate turnover is used by the liver. The effects
observed by changes in dietary status may also be influenced by metabolites.
Propionate, for example, appears to reduce the hepatic removal of lactate
independent of any effect of hormones (Baird et al., 1980). It seems that
when propionate is available, which means during feasting, the liver uses
propionate preferentially as a substrate for glucose production, thereby sparing
lactate and other glucose precursors for other uses.
Table 11.4. Insulin concentrations, lactate extraction by the liver and net hepatic uptake
(NHU) and turnover rate (TR) of lactate in sheep under various physiological states and during
glucagon and insulin infusion (data from van der Walt et al., 1983; Brockman and Laarveld,
1986; R.P. Brockman, unpublished results).
Status
Insulin
(mU/ml)
Hepatic
extraction (%)
NHU
(mmol/h)
Lactate TR
(mmol/h)
Fed ad lib 60 + 8 7.6 + 1.9 À 17 + 1
Maintenance
Control 22 + 3 9.0 + 1.7 11 + 2 À
Glucagon 52 + 813+ 318+ 5 À
Pregnant À 29 + 331+ 440+ 5
Lactating À 14 + 218+ 251+1
36-h fast 6 + 129+ 318+ 321+ 2
Insulin infusion 47 + 718+ 710+ 221+ 3
Insulin infusion 95 + 9 9.2 + 2.5 7.2 + 226+ 2
Glucose and Short-chain Fatty Acid Metabolism 299
In fasted, pregnant and lactating sheep about 26%, 30% and 16%, re-
spectively, of the lactate turnover is used for gluconeogenesis (Table 11.5). The
lower value in lactating sheep reflects lactate used by the mammary gland. The
fraction of lactate used in glucose synthesis is probably lower in the fed animals
compared to the fasted animals. In sheep that had feed withheld for 12–16 h
(partially fasted), 18% of the lactate was used for gluconeogenesis whereas in
sheep that were fasted for longer periods, it was 26% (Reilly and Chandrasena,
1978). Obviously this is related to the decreased availability of propionate
during starvation.
Lactate, however, accounts for less than 20% of the substrate for glucose.
The fraction of glucose that is derived from lactate seems relatively constant
(10–20%) (Tables 11.1 and 11.5), except during lactation when substantial
amounts of lactate are used by the mammary gland (Oddy et al., 1985) and
lactate accounts for only about 6% of glucose synthesis.
Metabolism of Short-chain Fatty Acids
Propionate
A sheep on a maintenance diet of 800 g of lucerne pellets per day produces
30–45 mmol propionate per hour in its rumen (Judson and Leng, 1973a;
Steel and Leng, 1973b). Of this, 18–24 mmol/h is absorbed (Bergman et al.,
1966; Bergman and Wolff, 1971; Noziere et al., 2000). Since absorption
accounts for only 40–60% of ruminal production, a substantial amount of
ruminal propionate is metabolized or converted to other metabolites before
and/or during absorption. In studies with washed reticulorumens almost all the
propionate, which was infused into the rumen, was recovered in the portal
blood (Kristensen et al., 2000; Kristensen and Harmon, 2004), indicating
that propionate is not metabolized to a significant degree by the ruminal
epithelium during absorption. This is consistent with the results of earlier
studies in cattle that indicated that little propionate is metabolized during
absorption (Weigland et al., 1972). Thus, half of the ruminal propionate is
metabolized within the gut.
Table 11.5. Summary of the interconversions of lactate and glucose in sheep (data from
Reilly and Chandrasena, 1978; van der Walt et al., 1983; Brockman and Laarveld, 1986).
% Glucose
from lactate
% Lactate
to glucose
% Lactate
from glucose
% Glucose
to lactate
Recycling
(%)
Fed (n¼4) 16 + 1
Fasted
16 h (n¼7) 15 + 317+ 231+ 524+ 3 4.7
36 h (n¼5) 13 + 126+ 469+ 533+ 3 9.0
Pregnant 12 30 79 31 9.4
Lactating 6 16 57 19 3.4
300 R.P. Brockman
Half (Judson and Leng, 1973b; Steel and Leng, 1973b; Amaral et al.,
1990) or more (Bergman et al., 1966; Bergman and Wolff, 1971) of the
propionate that is absorbed is used to synthesize glucose. Perhaps as much as
80% of the absorbed propionate may be converted to glucose, accounting for
27–30% of glucose production (Bergman et al., 1966; Brockman, 1990). It
may be slightly higher in pregnant animals (Judson and Leng, 1973b). Data
from the study of Brockman (1990), in which propionate was infused intrapor-
tally in fasted sheep at rates equivalent to normal absorption rates, indicated
that the liver of fasted sheep may be even more efficient in using propionate for
glucose synthesis. About 90% of the propionate, which was removed by the
liver, was converted to glucose. The liver is very efficient at removing propion-
ate from the blood. It extracts about 90% of the propionate reaching it and
propionate uptake by the liver accounts for more than 90% of the portal
production in both cattle (Baird et al., 1980; Lozano et al., 2000) and sheep
(Bergman and Wolff, 1971).
The rate of utilization of propionate for glucose synthesis appears to be
determined by availability. This conclusion is supported by many observations.
First, propionate utilization is linearly related to its concentrations in plasma
(Bergman et al., 1966; Judson and Leng, 1973a). Secondly, infusion of
exogenous propionate into the rumen increases the absolute amount of pro-
pionate incorporated into glucose, but it does not change the fraction of
propionate used for glucose synthesis (Judson and Leng, 1973b; Amaral
et al., 1990). Similarly the intravenous infusion of propionate increases glu-
cose production and the proportion of glucose derived from propionate with-
out changing the proportion of propionate appearing in glucose (Bergman
et al., 1966). In studies in cows the intravenous infusion of propionate at rates
which doubled the entry rate of propionate only marginally reduced the hepatic
extraction of propionate, from 80–85% to 70–75%, while the hepatic uptake
of propionate doubled (Baird et al., 1980). Similar results were obtained in
sheep during intraruminal infusion of propionate at 58 mmol/h (Berthelot
et al., 2002). Thirdly, the hepatic extraction efficiency and incorporation of
propionate into glucose do not appear to be influenced by glucoregulatory
hormones, e.g. insulin (Baird et al., 1980; Brockman, 1990). Finally, glucose
infusion sufficient to cause hyperglycaemia and hyperinsulinaemia in cows did
not appear to affect the net hepatic uptake of propionate while the hepatic
output of glucose decreased (Baird et al., 1980). Another study showed that
this occurred without a change in the amount of propionate converted to
glucose (Amaral et al., 1990).
Propionate may influence the utilization of other substrates for glucose
synthesis. First, propionate is a known substrate for lactate production (Leng
and Annison, 1963), with perhaps half of the blood lactate being derived from
ruminal propionate (Leng et al., 1967). Secondly, the infusion of exogenous
propionate in cows was associated with a decrease in the hepatic extraction of
lactate in the absence of changes in plasma insulin concentrations (Baird et al.,
1980). In studies where propionate was infused at 40 mmol/h into a mesen-
teric vein in fasted sheep, whole-body lactate production went from 16 + 1to
29 + 3 mmol/h while hepatic production of lactate increased less than
Glucose and Short-chain Fatty Acid Metabolism 301
5 mmol/h (1.3 + 0.7 vs. 5.9 + 1.6 mmol/h) (R.P. Brockman, unpublished
data). Thus, the change in hepatic production accounted for less than half of
the increase in whole-body production of lactate during propionate infusion.
The relationship between lactate and propionate and the differential hor-
monal response between lactate/pyruvate and propionate in the liver, are
undoubtedly related to the differences in their entry into the glucogenic path-
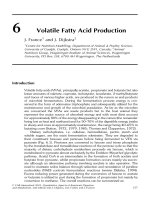
way. The conversion of lactate/pyruvate to triose phosphate involves both the
pyruvate carboxylase (PC) and the phosphoenolpyruvate carboxykinase
(PEPCK) catalysed reactions (the first reaction is the conversion to oxaloace-
tate, the second oxaloacetate to triose phosphate), whereas the conversion of
propionate to triose phosphate does not involve PC (propionate is converted to
oxaloacetate by another process, see Fig. 11.3). The activity of PC, but not
PEPCK, is responsive to changes in physiological status and hormones (Ballard
et al., 1969; Filsell et al., 1969; Brockman and Manns, 1974) and it follows
that changes in PC activity can alter the rate of conversion of lactate/pyruvate,
but not propionate, to triose phosphate. An increase in the availability of
propionate, it seems, would increase the intracellular concentration of oxalo-
acetate, thereby reducing the proportion of oxaloacetate derived from lactate/
pyruvate that is used to form triose phosphate if there is no change in the
PEPCK reaction rate. This may explain how propionate decreases the net
hepatic uptake of lactate and pyruvate (Baird et al., 1980).
Some extrahepatic organs can metabolize propionate. The hind limb has
been shown to remove about 40% of the propionate reaching it in a single
pass (Prior et al., 1984) and the brain about 25% (Oyler et al., 1970). Since
85–90% of the absorbed propionate is removed in a single pass through the
liver (Bergman and Wolff, 1971), only small amounts of propionate reach
other organs. Quantitatively, extrahepatic metabolism of propionate is min-
imal. For comparison, the arteriovenous difference of propionate across the
brain is only 3–4% of that of glucose (Oyler et al., 1970).
CH
3
CO
2
CO
2
CO
2
CH
3
CH
2
C
O
O
PC
O
−
O
O
−
C
C
Pyruvate
Oxaloacetate
Propionate
PEP Glucose
PEPCK
Fig. 11.3. A summary of the entry of propionate and pyruvate to the pyruvate carboxylase (PC)
and phosphoenolpyruvate carboxykinase (PEPCK) reactions in gluconeogenesis.
302 R.P. Brockman
Acetate
Production
Quantitatively, acetate is the most important short-chain fatty acid in the
ruminant. About 70% of the intraruminal turnover or production of acetate
can be accounted for by portal absorption of acetate (Bergman and Wolff,
1971; Kristensen, 2001). In sheep on a maintenance diet this would be about
100 mmol/h. Net portal production of acetate in 340 kg steers fed ad libitum
was about 550 mmol/h (Lozano et al., 2000). Since virtually all the acetate
that was infused into washed reticulorumen preparations was recovered in the
portal blood in both sheep (Kristensen et al., 2000) and cattle (Kristensen and
Harmon, 2004), it appears that intraruminal use, not rumen epithelial metab-
olism, accounts for the 30% of ruminal acetate that does not appear in the
portal blood. Studies in cattle indicate that less than 10% of ruminal acetate
passes into the lower gut and about 20% is absorbed as non-acetate volatile
fatty acids (Kristensen, 2001).
The whole-body production of acetate in sheep on a maintenance diet
is 120–150 mmol/h (Annison et al., 1967; Bergman and Wolff, 1971).
Arteriovenous difference studies have shown that the portal-drained
viscera, presumably representing absorption, produce about three-quarters of
this. About 20% of endogenous acetate production comes from the liver,
but the liver utilizes about the same amount and its net production of acetate
is less than 5% of the whole-body turnover (Bergman and Wolff, 1971; Lozano
et al., 2000). During fasting the endogenous production of acetate is about
the same as during feasting (Bergman and Wolff, 1971; Pethick et al.,
1981), but since absorption from the gut is low during fasting, liver
production may account for 25% of acetate turnover, with the muscle produ-
cing the rest.
The situation changes during lactation. In lactating ewes (Costa et al.,
1976) the net hepatic production of acetate accounts for about 40% of its
whole-body turnover. In lactating dairy cows its net hepatic production is about
one-third of that of the gut (Lomax and Baird, 1983). The increased acetate
production by the liver is probably due to increased uptake of free fatty acids by
the liver (Costa et al., 1976). While the lactating mammary gland is a net user
of acetate, it produces a small amount of acetate (about 4% of whole-body
production) (King et al., 1985). This amounts to about one-quarter of its
utilization rate by the organ.
Utilization
Acetate is metabolized rapidly by the body. Estimates of acetate’s half-life range
from 3 to 4 min (Annison and Lindsay, 1961) to 13 min (Jarrett et al., 1974).
Acetate extraction by the hind limb is 50–60%, where the net uptake accounts
for 20% of the oxygen uptake (Jarrett et al., 1976). Acetate extraction is lower
during fasting and exercise when ketone bodies and long-chain free fatty acids
make up the major energy sources (Jarrett et al., 1976). At these times acetate
extraction efficiency may be as low as 15%.
Glucose and Short-chain Fatty Acid Metabolism 303
The brain also removes acetate from the blood. The net uptake may
account for about 3% of acetate turnover, about 3 mmol/h (Pell and Bergman,
1983). On a molar basis this is equivalent to about 10% of the glucose uptake
by the brain, so that the brain is not a major user of acetate. In lactating animals
up to 20% of the acetate turnover is accounted for by mammary gland utiliza-
tion (Pethick and Lindsay, 1982; King et al., 1985). It removes about half the
acetate presented to it (Bickerstaffe et al., 1974; Laarveld et al., 1985), and
17–29% of the organ’s fatty acid synthesis is attributable to acetate (King et al.,
1985). Obviously, the absolute amount removed is a function of milk yield.
Acetate turnover is reduced during insulin deficiency (Jarrett et al., 1974)
and the uptake by the hind limb is increased by insulin (Table 11.6). In
untreated diabetic sheep the extraction of acetate by the hind limb may be as
low as 5% (Knowles et al., 1974), compared to 50–60% when insulin is
available as in normal animals and treated diabetics (Knowles et al., 1974;
Pethick et al., 1981). In contrast, the uptake of acetate by the mammary gland
is not influenced by insulin (Laarveld et al., 1985). Typically insulin concentra-
tions are lower in lactating animals than in non-lactating animals and the
difference in the responses to insulin allows the body to direct acetate to the
mammary gland by reducing uptake by insulin-responsive organs.
Acetate is a major source of energy for the ruminant. About 25% of
respiratory carbon dioxide is derived from acetate (Pethick et al., 1981). If all
the acetate was oxidized it would account for about 40% of the respiratory
carbon dioxide (see also Majdoub et al., 2003, in which the net uptake of
acetate by the hind limb in sheep could account for about one-third of the
oxygen uptake). About two-thirds of all acetate is oxidized, leaving one-third for
other uses, such as lipogenesis (Ballard et al., 1969).
Butyrate
Butyrate is the third most important product of carbohydrate fermentation
in the rumen. Butyrate metabolism has been studied less than acetate and
Table 11.6. Arterial concentrations [Art], arteriovenous concentration differences [A–V],
extraction of acetate by the hind limb (Extr.) and arterial insulin concentrations [Insulin] in sheep
under various conditions (adapted from Knowles et al., 1974).
[Art] (mM) [A–V] (mM) Extr. (%) [Insulin] (mU/ml)
Fed 630 + 8 321 + 60 51 55 + 9
Fasted
48 h 101 + 22 35 + 835 8+ 1
120 h 90 + 11 25 + 928 4+ 1
Refed 352 + 78 148 + 48 42 40 + 8
Diabetic 2471 +151 123 + 94 5 1 + 1
ITA
a
470 + 81 310 + 57 66 25 + 6
a
Insulin-treated alloxan diabetic animals.
304 R.P. Brockman
propionate. The amount of butyrate which is absorbed is low in relation to the
amount produced in the rumen. A sheep on a maintenance diet absorbs about
2 mmol/h as butyrate (Bergman and Wolff, 1971), compared with a ruminal
production between 20 and 40 mmol/h (Annison et al., 1967). About 20% of
butyrate is converted to acetate in the rumen. Much of the butyrate is metab-
olized in the ruminal epithelium during absorption (Kristensen et al., 2000;
Kristensen and Harmon, 2004). Only about one quarter of the butyrate which
was infused into a washed reticulorumen preparation was recovered in the
portal blood (Kristensen et al., 2000).
During absorption butyrate is largely converted to ketone bodies in the
ruminal epithelium (Emmanuel, 1980). In sheep on a maintenance diet the net
production of ketone bodies by the portal-drained viscera has been reported to
be 15–20 mmol/h (Katz and Bergman, 1969), although estimates of net portal
production of ketone bodies as low as 3 mmol/h have been reported (Noziere
et al., 2000; Majdoub et al., 2003). Studies with cattle suggest that the net
production of ketone bodies by the portal-drained viscera may be two to three
times more than the net portal production of butyrate (Lomax and Baird,
1983; Lozano et al., 2000). Kristensen et al. (2000) cited unpublished studies
in which 40% of the intraruminally infused butyrate was accounted for by the
release of 3-hydroxybutyrate into the portal-drained viscera. Ketone body
production by the portal-drained viscera decreases during fasting, when butyr-
ate production is decreased (Noziere et al., 2000).
Studies in sheep indicate that more than 80% of the butyrate that is
absorbed from the gut is removed in a single pass through the liver (Bergman
and Wolff, 1971). It may be lower in cattle where hepatic extraction of butyrate
was about two-thirds (Lozano et al., 2000). Only 20–33% is used by the
peripheral tissues. Thus, while the sheep hind limb appears to be able to remove
about one-third of the butyrate presented to it (Majdoub et al., 2003), quanti-
tatively utilization by muscle is small. In contrast, the liver is a net producer of
ketone bodies (Katz and Bergman, 1969; Majdoub et al., 2003) and appears to
be able to use butyrate as a substrate (Annison et al., 1963b). It appears that at
least in cattle the production of ketone bodies by the liver may exceed hepatic
uptake of butyrate in fed animals (Lozano et al., 2000). Ketone body produc-
tion by the liver is greatest when free fatty acids rather than butyrate are
available as substrates (Katz and Bergman, 1969). Hepatic ketone body pro-
duction is reduced by insulin (Brockman and Laarveld, 1985). Normally when
dietary butyrate is readily available, insulin concentrations are high. Thus, the
conversion of butyrate to ketone bodies by the ruminal epithelium during
absorption allows hepatic ketogenesis to occur at a low rate without impairing
the conversion of butyrate to ketone bodies.
Since both the liver and portal-drained viscera are net producers of ketone
bodies they must be used by the peripheral tissues. The hind limb appears to
extract less than one-fifth of ketone bodies presented to it in the blood (Majdoub
et al., 2003).
The most important function of butyrate is as a substrate for ketone body
production. Since butyrate infusions appear to cause hyperglycaemia, there is
some suggestion that butyrate may be glucogenic. However, butyrate has no
Glucose and Short-chain Fatty Acid Metabolism 305
glucogenic capacity (Annison et al., 1963b). The distribution of radioactivity in
glucose indicates that any label from butyrate that appears in glucose is incorp-
orated through the entry of acetyl-CoA into the tricarboxylic acid cycle (Anni-
son et al., 1963b; Leng and Annison, 1963). Thus, there is no net synthesis of
glucose from the incorporation of butyrate carbon into glucose.
Isobutyrate is also produced in the rumen, but in smaller quantities than
butyrate. In underfed (about one-half maintenance diet) sheep the net portal
production of isobutyrate was 0.39 mmol/h compared to 0.58 mmol/h for
butyrate (Noziere et al., 2000). Comparable values were reported for steers
(Lozano et al., 2000). In studies with the washed reticulorumen all of the
isobutyrate which was infused into the washed reticulorumen was accounted
for in portal absorption (Kristensen et al., 2000), indicating that it is not
metabolized during absorption.
Valerate and isovalerate are other minor short-chain fatty acids that are
produced by ruminal fermentation. The net portal production (absorption) of
valerate was about 0.08 mmol/h in sheep fed a diet that met 53% of their
energy needs (Noziere et al., 2000). Net portal production of isovalerate was
about 0.25 mmol/h in the same animals. Studies with the washed reticuloru-
men preparation indicated that net portal production may account for about
one-third of the ruminal production of valerate and half that of isovalerate
(Kristensen et al., 2000; Kristensen and Harmon, 2004), which suggests that
there is substantial metabolism of these metabolites during absorption. All of
the valerate and about 85% of the isovalerate that is absorbed into the portal
blood is removed by the liver so that essentially little or no valerate and
isovalerate pass through the liver into the general circulation (Kristensen and
Harmon, 2004).
Conclusions
Due to the fermentative nature of their digestion, ruminant animals normally
absorb little dietary carbohydrate as hexose sugar, and short-chain fatty acids
account for up to 70% of their energy needs. Acetate is the major substrate for
lipogenesis and oxidation. Propionate is a major substrate for gluconeogenesis.
The fed animal appears to use propionate as the major glucose precursor,
thereby sparing other glucose precursors, such as amino acids, for synthetic
functions in other parts of the body. When propionate is less abundant, lactate,
glycerol from fat and amino acids from extrahepatic tissues are used to a
greater extent to produce glucose. Similarly, during fasting fatty acids from
lipolysis may replace butyrate and acetate as energy sources.
References
Amaral, D.M., Veenhuizen, J.J., Drackley, J.K., Cooley, M.H., McGilliard, A.D. and
Young, J.W. (1990) Metabolism of propionate, glucose, and carbon dioxide as
affected by exogenous glucose in dairy cows at energy equilibrium. Journal of
Dairy Science 73, 1244–1254.
306 R.P. Brockman
Annison, E.F. and Lindsay, D.B. (1961) Acetate utilization in sheep. Biochemical
Journal 78, 777–785.
Annison, E.F., Lindsay, D.B. and White, R.R. (1963a) Metabolic interactions of glucose
and lactate in sheep. Biochemical Journal 88, 243–248.
Annison, E.F., Leng, R.A., Lindsay, D.B. and White, R.R. (1963b) The metabolism of
acetic acid, propionic acid and butyric acid in sheep. Biochemical Journal 88,
248–252.
Annison, E.F., Brown, R.E., Leng, R.A., Lindsay, D.B. and West, C.F. (1967) Rates of
entry and oxidation of acetate, glucose, D(-)ß-hydroxybutyrate, palmitate, oleate
and stearate and rates of production and oxidation of propionate and butyrate in
fed and starved sheep. Biochemical Journal 104, 135–147.
Baird, G.D., Lomax, M.A., Symonds, H.W. and Shaw, S.R. (1980) Net hepatic and
splanchnic metabolism of lactate, pyruvate and propionate in dairy cows in vivo in
relation to lactation and nutrient supply. Biochemical Journal 86, 47–57.
Baird, G.D., van der Walt, R.G. and Bergman, E.N. (1986) Whole body metabolism of
glucose and lactate in productive sheep and cows. British Journal of Nutrition 50,
249–265.
Ballard, F.J., Hanson, R.W. and Kronfeld, D.S. (1969) Gluconeogenesis and lipogen-
esis in tissue from ruminant and nonruminant animals. Federation Proceedings
28, 218–231.
Bergman, E.N. (1990) Energy contributions of volatile fatty acids from the gastrointest-
inal tract in various species. Physiological Reviews 70, 567–590.
Bergman, E.N. and Wolff, J.E. (1971) Metabolism of volatile fatty acids by liver
and portal-drained viscera in sheep. American Journal of Physiology 221,
586–592.
Bergman, E.N., Roe, W.E. and Kon, K. (1966) Quantitative aspects of propionate
metabolism and gluconeogenesis in sheep. American Journal of Physiology
211, 793–799.
Bergman, E.N., Starr, D.J. and Ruelein, S.S. (1968) Glycerol metabolism and gluco-
neogenesis in normal and hypoglycemic sheep. American Journal of Physiology
215, 874–880.
Bergman, E.N., Katz, M.L. and Kaufman, C.F. (1970) Quantitative aspects of hepatic
and portal glucose metabolism and turnover in sheep. American Journal of
Physiology 219, 785–793.
Bergman, E.N., Brockman, R.P. and Kaufman, C.F. (1974) Glucose metabolism:
comparison of whole-body turnover with production by gut, liver and kidneys.
Federation Proceedings 33, 1849–1854.
Berthelot, V., Pierzynowski, S.G., Sauvant, D. and Kristensen, N.B. (2002) Hepatic
metabolism of propionate and methylmalonate in growing lambs. Livestock Pro-
duction Science 74, 33–43.
Bickerstaffe, R., Annison, E.F. and Linzell, J.L. (1974) The metabolism of glucose,
acetate, lipids and amino acids in lactating dairy cows. Journal of Agricultural
Science, Cambridge 83, 71–85.
Brockman, R.P. (1983) Effects of insulin and glucose on the production and utilisation
of glucose in sheep (Ovis aries). Comparative Biochemistry and Physiology 74A,
681–685.
Brockman, R.P. (1985) Role of insulin in regulating hepatic gluconeogenesis in sheep.
Canadian Journal of Physiology and Pharmacology 63, 1460–1464.
Brockman, R.P. (1987) Effect of exercise on net hepatic uptake of lactate, pyruvate,
alanine and glycerol in sheep. Canadian Journal of Physiology and Pharmacol-
ogy 65, 2065–2070.
Glucose and Short-chain Fatty Acid Metabolism 307
Brockman, R.P. (1990) Effect of insulin on the utilisation of propionate in sheep.
British Journal of Nutrition 64, 95–101.
Brockman, R.P. and Laarveld, B. (1985) Effects of insulin on the net hepatic metabol-
ism of acetate ß-hydoxybutyrate in sheep (Ovis aries). Comparative Biochemistry
and Physiology 81A, 255–257.
Brockman, R.P. and Laarveld, B. (1986) Effect of insulin on gluconeogenesis and the
metabolism of lactate in sheep. Canadian Journal of Physiology and Pharmacol-
ogy 66, 1055–1059.
Brockman, R.P. and Manns, J.G. (1974) Effects of glucagon on activities of hepatic
enzymes in sheep. Cornell Veterinarian 64, 217–224.
Brockman, R.P., Bergman, E.N., Joo, P.K. and Manns, J.G. (1974) Effects of glucagon
and insulin on net hepatic metabolism of glucose precursors in sheep. American
Journal of Physiology 229, 1344–1350.
Costa, N.D., McIntosh, G.H. and Snoswell, A.M. (1976) Production of endogenous
acetate by the liver in lactating ewes. Australian Journal of Biological Sciences
29, 33–42.
Danfaer, A., Tetens, U. and Agergaard, N. (1995) Review and an experimental study on
the physiological and quantitative aspects of gluconeogenesis in lactating rumin-
ants. Comparative Biochemistry and Physiology IIIB, 201–210.
Emmanuel, B. (1980) Oxidation of butyrate to ketone bodies and CO
2
in the rumen
epithelium, liver, kidney, heart and lung of camel (Camelius dromedarius), sheep
(Ovis aries) and goat (Capra hircus). Comparative Biochemistry and Physiology
65B, 699–704.
Faulkner, A. (1980) Renal gluconeogenesis in pregnant and nonpregnant sheep. Inter-
national Journal of Biochemistry 11, 191–293.
Filsell, O.H., Jarrett, I.G., Taylor, P.H. and Keech, D.B. (1969) Effects of fasting,
diabetes and glucocorticoids on gluconeogenic enzymes in sheep. Biochimica et
Biophysica Acta 184, 54–63.
Hay, W.W., Sparks, J.W., Gilbert, M., Battaglia, F.C. and Meschia, G. (1984) Effect of
insulin on glucose uptake by the maternal hindlimb and uterus, and by the foetus in
conscious pregnant sheep. Journal of Endocrinology 100, 119–124.
Heitmann, R.N. and Bergman, E.N. (1980) Integration of amino acid metabolism in
sheep: effects of fasting and acidosis. American Journal of Physiology 239,
E248–E254.
Hodgson, J.C., Mellor, D.J. and Field, A.C. (1981) Foetal and maternal rates of glucose
production in chronically catheterized dicotous ewes. Biochemical Journal 196,
179–186.
Jarrett, I.G., Filsell, O.H. and Ballard, F.J. (1974) Metabolic and endocrine interrela-
tionships in normal and diabetic sheep. Hormone and Metabolic Research 4
(Suppl.), 111–116.
Jarrett, I.G., Filsell, O.H. and Ballard, F.J. (1976) Utilisation of oxidizable substrates by
the sheep hind limb: effects of starvation and exercise. Metabolism Clinical and
Experimental 5, 523–531.
Judson, J.G. and Leng, R.A. (1973a) Studies on the control of gluconeogenesis
in sheep: effect of glucose infusions. British Journal of Nutrition 29, 159–174.
Judson, J.G. and Leng, R.A. (1973b) Studies on the control of gluconeogenesis in
sheep: effect of propionate, casein and butyrate infusions. British Journal of
Nutrition 29, 175–195.
Katz, M.L. and Bergman, E.N. (1969) Hepatic and portal metabolism of glucose, free
fatty acids and ketone bodies in sheep. American Journal of Physiology 216,
953–960.
308 R.P. Brockman
Kaufman, C.F. and Bergman, E.N. (1974) Renal ketone body metabolism and gluco-
neogenesis in normal and hypoglycemic sheep. American Journal of Physiology
221, 967–972.
Khachadurian, A.K., Adrouni, B. and Yacoubian, H. (1966) Metabolism of adipose
tissue in the tail fat of the sheep in vivo. Journal of Lipid Research 7, 427–436.
King, K.R., Gooden, J.M. and Annison, E.F. (1985) Acetate metabolism in the mam-
mary gland of the lactating ewe. Australian Journal of Biological Sciences 38,
23–31.
Knowles, S.E., Jarrett, I.G., Filsell, O.H. and Ballard, F.J. (1974) Production and
utilisation of acetate in mammals. Biochemical Journal 142, 401–411.
Krebs, H.A. and Yoshida, Y. (1963) Renal gluconeogenesis. 2. The gluconeogenic
capacity of the kidney cortex of various animals. Biochemical Journal 89,
398–400.
Kristensen, N.B. (2001) Rumen microbial sequestration of [2-
13
C]acetate in cattle.
Journal of Animal Science 79, 2491–2498.
Kristensen, N.B. and Harmon, D.L. (2004) Splanchnic metabolism of volatile fatty
acids absorbed from the washed reticulorumen. Journal of Animal Science 82,
2033–2042.
Kristensen, N.B., Danfaer, A. and Agergaard, N. (1998) Absorption and metabolism
of short-chain fatty acids in ruminants. Archives of Animal Nutrition 51,
165–175.
Kristensen, N.B., Gabel, G., Pierzynowski, S.G. and Danfaer, A. (2000) Portal recovery
of short-chain fatty acids infused into the temporarily-isolated and washed reticulo-
rumen of sheep. British Journal of Nutrition 84, 477–482.
Laarveld, B., Christensen, D.A. and Brockman, R.P. (1981) The effect of insulin on net
metabolism of glucose and amino acids in the bovine mammary gland. Endocrin-
ology 108, 2217–2221.
Laarveld, B., Chaplin, R.K. and Brockman, R.P. (1985) Effects of insulin on the
metabolism of acetate, ß-hydroxybutyrate and triglyceride by the bovine mammary
gland. Comparative Biochemistry and Physiology 83B, 265–267.
Leng, R.A. (1970) Glucose synthesis in ruminants. Advances in Veterinary Sciences
14, 209–260.
Leng, R.A. and Annison, E.F. (1963) Metabolism of acetate, propionate and butyrate by
sheep-liver slices. Biochemical Journal 86, 319–327.
Leng, R.A., Steel, J.W. and Luick, J.R. (1967) Contribution of propionate to glucose
synthesis in sheep. Biochemical Journal 103, 785–790.
Leury, B.J., Bird, A.R., Chandler, E.D. and Bell, A.W. (1990) Glucose partitioning in the
pregnant ewe: effects of undernutrition and exercise. British Journal of Nutrition
64, 449–462.
Lindsay, D.B. (1978) Gluconeogenesis in ruminants. Biochemical Society Transac-
tions 6, 1152–1156.
Lomax, M.A. and Baird, G.D. (1983) Blood flow and nutrient exchange across the liver
and gut of the dairy cow. British Journal of Nutrition 49, 481–496.
Lozano, O., Theurer, C.B., Alio, A., Huber, J.T., Delgado-Elorduy, A., Cuneo, P.,
DeYoung, D., Sadik, M. and Swingle, R.S. (2000) Net absorption and hepatic
metabolism of glucose,
L
-lactate, and volatile fatty acids by steers fed diets contain-
ing sorgum grain processed as dry-rolled or steam-flaked at different densities.
Journal of Animal Science 78, 1364–1371.
Majdoub, L., Vermorel, M. and Ortigues-Marty, I. (2003) Intraruminal propionate
supplementation modifies hindlimb energy metabolism without changing the
Glucose and Short-chain Fatty Acid Metabolism 309
splanchnic release of glucose in growing lambs. British Journal of Nutrition 89,
39–50.
Meschia, G., Battaglia, F.C., Hay, W.W. and Sparks, J.W. (1980) Utilisation of sub-
strate by the ovine placenta in vivo. Federation Proceedings 39, 481–496.
Morriss, F.H., Rosenfeld, C.R., Crandell, S.S. and Adcock, E.W. III (1980) Effects of
fasting on uterine blood flow and substrate uptake in sheep. Journal of Nutrition
110, 2433–2443.
Noziere, P., Martin, C., Remond, D., Kristensen., N.B., Bernard, R. and Doreau, M.
(2000) Effect of composition of ruminally infused short-chain fatty acids on net
fluxes of nutrients across portal-drained viscera in underfed ewes. British Journal
of Nutrition 83, 521–531.
Oddy, V.H., Gooden, J.M., Hough, G.M., Leleni, E. and Annison, E.F. (1985) Partition
of nutrients in merino sheep. II. Glucose utilisation by skeletal muscle, the pregnant
uterus and mammary gland in relation to whole body glucose utilisation. Australian
Journal of Biological Sciences 38, 95–108.
Oyler, J.M., Jones, K.L. and Goetsch, D.D. (1970) Utilisation of glucose and volatile
fatty acids by canine and caprine brain. American Journal of Veterinary Research
31, 1801–1805.
Pell, J.M. and Bergman, E.N. (1983) Cerebral metabolism of amino acids and glucose in
fed and fasted sheep. American Journal of Physiology 244, E282–E289.
Pethick, D.W. and Lindsay, D.B. (1982) Acetate metabolism in lactating sheep. British
Journal of Nutrition 48, 319–328.
Pethick, D.W., Lindsay, D.B., Barker, P.J. and Northop, A.J. (1981) Acetate supply
and utilisation by the tissues of sheep in vivo. British Journal of Nutrition 46,
97–110.
Prior, R.L., Huntingdon, G.R. and Reynolds, P.J. (1984) Role of insulin and glucose on
metabolite uptake by the hind limbs of beef steers. Journal of Animal Science 58,
1146–1453.
Reilly, P.E.B. and Chandrasena, L.G. (1978) Glucose–lactate interrelations in sheep.
American Journal of Physiology 235, E487–E492.
Steel, J.W. and Leng, R.A. (1973a) Effects of plane of nutrition and pregnancy on
gluconeogenesis in sheep. 1. The kinetics of glucose metabolism. British Journal
of Nutrition 30, 475–489.
Steel, J.W. and Leng, R.A. (1973b) Effects of plane of nutrition and pregnancy on
gluconeogenesis in sheep. 2. Synthesis of glucose from ruminal propionate. British
Journal of Nutrition 30, 475–489.
van der Walt, J.G., Baird, D.G. and Bergman, E.N. (1983) Tissue glucose and lactate
metabolism and interconversions in pregnant and lactating sheep. British Journal
of Nutrition 50, 267–280.
Weigland, E., Young, J.W. and McGilliard, D. (1972) Extent of propionate metabolism
during absorption from the bovine rumenoreticulum. Biochemical Journal 126,
201–209.
Wilson, S., MacRae, J.C. and Buttery, P.J. (1983) Glucose production and utilization in
non-pregnant, pregnant and lactating ewes. British Journal of Nutrition 50, 303–
316.
310 R.P. Brockman
12
Metabolism of the Portal-drained
Viscera and Liver
D.B. Lindsay
1
and C.K. Reynolds
2
1
Division of Nutritional Sciences, School of Biosciences, University of
Nottingham, Sutton Bonington Campus, Loughborough, Leicestershire LE12
5RD, UK;
2
Department of Animal Sciences, The Ohio State University,
OARDC, 1680 Madison Avenue, Wooster, OH 44691-4096, USA
Introduction
Viscera whose blood supply drains into the portal vein include most of the
alimentary tract, the spleen and the pancreas. In addition, mesenteric and
omental fat depots, which can be substantial, contribute portal venous blood.
Since it is the large expansion of the stomach that characterizes ruminants, it is
understandable that special attention is devoted to metabolism in this region.
Many metabolic peculiarities of ruminants stem from this. Most blood flowing
into the liver is portal and since the metabolism of the liver is linked with that of
the gastrointestinal (GI) tract, some features of its metabolism are also included.
This chapter emphasizes the quantification of nutrient and hormonal flows
in the splanchnic region. Several techniques have been used to study ruminant
metabolism. Among the most recent techniques available for use in intact
animals is that of nuclear magnetic resonance (NMR), e.g. glycogen metabolism
in human liver (Morris et al., 1994). However, the high cost of equipment for
this has rendered it unavailable for large animals such as sheep, goats and
cattle. Thus only the arteriovenous (A–V) difference technique is considered
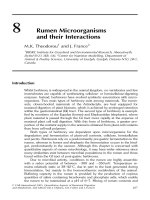
here. This involves implantation (under general anaesthesia) of plastic catheters
in an artery and in the mesenteric, portal and hepatic veins (see Fig. 12.1). Any
artery may be used since the concentration of metabolites is virtually the same
in all arteries. After adequate recovery from the operation, sampling of blood
through these catheters together with some means of estimating blood flow is
used to estimate net inflow/outflow (typically referred to as ‘net flux’) of
metabolites across the whole of the portal-drained viscera (PDV) and liver. It
has also proved possible to estimate the net movement of metabolites across
sections of the PDV, such as the mesenteric-drained viscera (MDV) or the
rumen. Moreover, the combination of A–V differences, blood flow and other
measurements, such as nutrient disappearance from the lumen of the gut, or
isotopic extraction and interconversion provides invaluable insight into the
ß CAB International 2005. Quantitative Aspects of Ruminant Digestion
and Metabolism, 2nd edition (eds J. Dijkstra, J.M. Forbes and J. France)
311
quantitative metabolism of absorbed nutrients by the splanchnic tissues. The
rates of protein synthesis by splanchnic tissues are not dealt with in this
chapter, since these rates are described in Chapter 14.
Methods of Calculating Metabolism
The general principles have been well described by Bergman (1975), van der
Walt et al. (1983), Pethick et al. (1981) and Pell et al. (1986).
Portal-drained viscera
Net exchange (flux)
Net flux of compound
x
m
¼ (P
m
À A
m
) PBF (12:1)
where PBF represents the portal blood flow; P
m
and A
m
are the portal
and arterial blood concentrations of metabolite m.IfP
m
> A
m
net flux of
m is positive (there is net release or absorption into venous blood). If
P
m
< A
m
net flux of m is negative (there is net uptake or removal from arterial
blood).
RUMEN
Small
intestine
Large
intestine
and caecum
Mesenteric
c
Gastro-
splenic
c
Gastro
duodenal
v
Splenic
v
Hepatic
c
Vena
Portal c
R and L
ruminal
v
cava
Fig. 12.1. The siting of catheters (c) in splanchnic studies. c indicates catheter, v indicates vein.
More detailed descriptions of the vascular anatomy of the bovine intestines (Habel, 1992) and
liver (Seal and Reynolds, 1993) are provided in other texts.
312 D.B. Lindsay and C.K. Reynolds
True (gross) release and removal
By infusing isotopically labelled m one may distinguish release and utilization
when both occur simultaneously. Since the earlier edition of this book, most
isotopic studies have been made with stable (non-radioactive) isotopes. En-
riched m is infused at a constant rate into any peripheral vessel, which is usually
the jugular vein. After some time a steady state may be assumed (enrichments
do not change with time). The period of infusion used may also be based on
reaching a plateau enrichment of a metabolite of m, such as CO
2
.
The isotopic input of m ¼ A
m
E
am
PBF (12:2)
The uptake of isotopic m ¼ PBF(P
m
E
pm
À A
m
E
am
) (12:3)
Fractional uptake of isotopic m ¼ Eq:(12:2)=Eq:(12:3)
¼ [(P
m
E
pm
)=(A
m
E
am
)] À 1 (12:4)
where E
pm
¼ enrichment (APE ¼ atom per cent excess) of m in portal vein;
and E
am
¼ enrichment of m in artery.
The true (gross) uptake ¼ input of m
:
Eq: (12:4)
¼ PBFA
m
[(P
m
E
pm
=A
m
E
am
) À 1]
(12:5)
This assumes that over a short period no labelled m is released to the circulation
by the tissue examined. This may not be true for all metabolites, resulting in
underestimation of unidirectional uptake. Thus the following should be
regarded as best estimates.
True (gross) release is the sum of the true uptake plus the net flux, thus:
True release ¼ PBF{P
m
À A
m
þ A
m
[(P
m
E
pm
)=(A
m
E
am
)] À 1}
¼ PBF[P
m
À A
m
(P
m
E
pm
)=(A
m
E
am
)]
(12:6)
Oxidation
Measurement of oxidation of m by measuring production of
3
Hor
2
H across
the GI tract is impracticable because of the large flux of water across it. If
13
C-m
is used, letting P
CO
2
and E
P
CO
2
be the concentration and enrichment of CO
2
in portal and A
CO
2
, E
A
CO
2
the values in arterial blood, then:
Net CO
2
release ¼ (P
CO
2
À A
CO
2
)PBF (12:7)
13
CO
2
derived from m ¼ (P
CO
2
E
P
CO
2
À A
CO
2
E
A
CO
2
)PBF (12:8)
To express the fraction of CO
2
derived from m this is divided by the enrichment
of precursor m. This requires an assumption as to the enrichment of m in the
tissues being studied. It is usually taken as the venous-specific activity although
the value is perhaps more likely to lie between arterial and venous. For further
discussion of this point, see also France et al. (1999).
Metabolism of the Portal-drained Viscera and Liver 313
Fraction of CO
2
derived from
m ¼ [(P
CO
2
E
P
CO
2
À A
CO
2
E
A
CO
2
)PBF]=E
pm
(12:9)
The fraction of m uptake oxidized by the site studied is given as Eq. (12.8)/
Eq. (12.5).
One concern with the use of
13
C to determine oxidation of m is the amount
of labelled m required to measurably enrich CO
2
. For many metabolites with
low rates of oxidation, the infusion rate of
13
C-m required for measurable
enrichment of CO
2
may be such a large proportion of daily m turnover that
metabolic responses to the
13
C-m occur, and thus the principles of tracer
methodology are violated.
Interconversion of metabolites
To determine the interconversion of glucose and lactate (or leucine/ketoleu-
cine; 3-hydroxybutyrate/acetoacetate) compartmental analysis is required.
Estimates of rates will then depend on the model assumed. Figure 12.2a
shows a model in which glucose and lactate represent homogeneous compart-
ments each communicating with a ‘sink’ (this is conceptual – it may represent
part of the cell, such as glycogen; or it could be the gut lumen). There are
ten rate constants, of which R
01
, R
02
, R
10
and R
20
can be determined experi-
mentally from glucose and lactate concentrations and enrichments and
3
Glucose
sink
R
31
R
13
R
12
R
21
R
24
R
02
R
42
1
Glucose
2
Lactate
4
Lactate
sink
(a) (b)
R
01
R
20
R
10
R
31
R
13
R
12
R
02
Glucose
Lactate
R
01
R
20
R
10
Fig. 12.2. Compartmental models for analysis of glucose/lactate interconversions. (a) Full
solution requires infusions of both labelled glucose and lactate. (b) Simplified model (see text)
requiring infusion only of labelled glucose.
314 D.B. Lindsay and C.K. Reynolds
blood flow. This leaves six unknown. Equations for carbon balance for the
glucose and the lactate pools supply two equations (e.g. for the glucose pool
R
01
þ R
21
þ R
31
¼ R
10
þ R
12
þ R
13
) and with
13
C-glucose infused, isotope
balance for the glucose and lactate pools supplies a further two equations.
Thus where A and V represent the arterial and venous input (and assuming
the latter reflects the tissue pools) we have:
AE
gluc
R
01
þ VE
lact
R
21
¼ (R
13
þ R
12
þ R
10
)VE
gluc
(12:10)
AE
lact
R
02
þ VE
gluc
R
12
¼ (R
21
þ R
24
þ R
20
)VE
lact
(12:11)
In the same way, results following infusion of labelled lactate yield two further
equations for isotope balance for the glucose and lactate pools. Then six simul-
taneous equations will lead to a unique solution for the six unknown rates.
It may be reasonable to take a simpler model (shown in Fig. 12.2b). Here it
is assumed that lactate metabolism occurs only through glucose (this is bio-
chemically improbable, since it is likely that lactate carbon would be metabol-
ized to compounds such as glucogenic amino acids without passing through the
glucose pool). However, the amount so utilized might well be small and its
neglect may lead to little error. R
21
is also omitted from the model; this implies
that gluconeogenesis from lactate does not occur in the GI which is almost
certainly true. With this simplified model it is not necessary to use two labelled
compounds since there are only three unknown rates; the two carbon balance
equations, plus the two for isotope balance obtained from use with
13
C-glucose
are more than sufficient to solve for the unknowns. Indeed it is possible to
solve without matrix analysis since first R
12
may be obtained from isotope
balance (R
12
þ R
02
¼ R
20
); then R
13
¼ R
01
À (R
10
þ R
12
), since R
31
does not
contribute label. Finally R
31
is obtained from carbon balance.
Determination of the amount of amino acid ‘sequestration’ during absorption
The amount of an amino acid ‘sequestered’ is the amount metabolized in the
absorptive cells of the small intestine, either as export or constitutive protein
synthesis or by catabolism. Similar approaches could be used for other metab-
olites if the rate of disappearance from the gut lumen can be determined or
estimated. The approach requires the differential labelling of both the blood
and small intestinal lumen pools, as the recovery of isotope infused into the gut
lumen must be corrected for absorbed isotope subsequently extracted (seques-
tered) by the PDV from arterial blood. Utilization of blood-derived (arterial)
amino acids by the PDV is determined isotopically much as described above.
After intravenous infusion of labelled m (I
1
), when steady state is reached, E
pm
and E
am
represent respective enrichments of portal and arterial m.
The fractional extraction of I
1
from arterial blood (S
1
)
¼ (A
m
E
am
À P
pm
E
pm
)=A
m
E
am
(12:12)
A different isotope (I
2
) of the amino acid is also infused into the duodenum (or
the same isotope could be infused on a separate occasion), and its fractional
Metabolism of the Portal-drained Viscera and Liver 315