Tài liệu Comparison of lung cancer cell lines representing four histopathological subtypes with gene expression profiling using quantitative real-time PCR pptx
Bạn đang xem bản rút gọn của tài liệu. Xem và tải ngay bản đầy đủ của tài liệu tại đây (819.88 KB, 12 trang )
PRIMARY RESEARCH Open Access
Comparison of lung cancer cell lines representing
four histopathological subtypes with gene
expression profiling using quantitative real-time
PCR
Takashi Watanabe
1
, Tomohiro Miura
1
, Yusuke Degawa
1
, Yuna Fujita
1
, Masaaki Inoue
2
, Makoto Kawaguchi
3
,
Chie Furihata
1*
Abstract
Background: Lung cancers are the most common type of human malignancy and are intractable. Lung cancers
are generally classified into four histopathological subtypes: adenocarcinoma (AD), squamous cell carcinoma (SQ),
large cell carcinoma (LC), and small cell carcinoma (SC). Molecular biological characterization of these subtypes has
been performed mainly using DNA microarrays. In this study, we compared the gene expression profiles of these
four subtypes using twelve human lung cancer cell lines and the more reliable quantitative real-time PCR (qPCR).
Results: We selected 100 genes from public DNA microarray data and examined them by DNA microarray analysis
in eight test cell lines (A549, ABC-1, EBC-1, LK-2, LU65, LU99, STC 1, RERF-LC-MA) and a normal control lung cell
line (MRC-9). From this, we extracted 19 candidate genes. We quantified the expression of the 19 genes and a
housekeeping gene, GAPDH, with qPCR, using the same eight cell lines plus four additional validation lung cancer
cell lines (RERF-LC-MS, LC-1/sq, 86-2, and MS-1-L). Finally, we characterized the four subtypes of lung cancer cell
lines using principal component analysis (PCA) of gene expression profiling for 12 of the 19 genes (AMY2A, CDH1,
FOXG1, IGSF3, ISL1 , MALL, PLAU, RAB25, S100P, SLCO4A1, STMN1, and TGM2). The combined PCA and gene pathway
analyses suggested that these genes were related to cell adhesion, growth, and invasion. S100P in AD cells and
CDH1 in AD and SQ cells were identified as candidate markers of these lung cancer subtypes based on their
upregulation and the results of PCA analysis. Immunohistochemistry for S100P and RAB25 was closely correlated to
gene expression.
Conclusions: These results show that the four subtypes, represented by 12 lung cancer cell lines, were well
characterized using qPCR and PCA for the 12 genes examined. Certain genes, in particular S100P and CDH1, may
be especially important for distinguishing the different subtypes. Our results confirm that qPCR and PCA analysis
provide a useful tool for characterizing cancer cell subtypes, and we discuss the possible clinical applications of this
approach.
Background
Lung cancer is the leading cause of cancer-related death
in men and women worldwide and continues to increase
in frequency. Currently, a diagnosis of lung cancer is
generally based on histopathological findings. Lung can-
cers are generally classified as either small-cell lung
carcinoma (SC) or non-small-cell lung carcinoma
(NSCLC). NSCLC is further classified into three histo-
pathological subtypes: adenocarcinoma (AD), squamous
cell carcinoma (SQ), and large cell carcinoma (LC).
However, progression, metastatic susceptibility, thera-
peutic and radiation therapy sensitivity, and prognosis
cannot be fully predicted based on initial histopathologi-
cal observations. Molecular characterizat ion of tumors,
by assaying gene expression using techniques such as
DNA microarray analysis, has the potential to
* Correspondence:
1
Department of Chemistry and Biological Science, School of Science and
Engineering, Aoyama Gakuin University, Kanagawa 229-8558, Japan
Watanabe et al. Cancer Cell International 2010, 10:2
/>© 2010 Watanabe et al; licensee BioMed Centra l Ltd. This is an Open Acc ess article dis tributed under the terms of the Creative
Commons Attribution License (http://creative commons.org/licenses/by/2.0), which permits unrestricted use, distribution, and
reproduction in any medium, provided the original work is properly c ited.
significantly inform medical care that is otherwise based
on surgical pathology and oncology. Using this technol-
ogy, it may be possible to identify clinically important
subsets of tumors that would otherwise be indistinguish-
able by conventional histopathological assessment. In
principle, expression profiling should identify tumors
that are more likely to invade, relapse, and metastasize,
and the approach should allow improved prediction of
responses to specific therapeutic regimens and clinical
outcomes [1-3]. However, recent publications have
raised concerns about the reliability of microarray tech-
nology for analyzing differential expression, because of
the lack of reproducibility across laboratories and plat-
forms despite the use of highly similar protocols [4].
Initial investigations (e.g., 2000-2003) highlighted discre-
pancies in gene expression analyzed with different
microarray technologies [5]. Although a considerable
number of studies have used DNA microarrays to
genetically identify lung cancer patients and lung cancer
cells [1-3,6-10], marker gene candidates have varied
depending on the report.
Quantitative real-time PCR (qPCR) is generally con-
sidered the “gold-standard” assay for measuring gene
expression and is ofte n used to confirm microarr ay data
[11]. qPCR is the most sensitive technique for detec tion
and quantification of mRNA targets [12]. Recently, it
has been suggested that qPCR may be a simpler, more
reliable, and more reproducible method than DNA
microarrays [13]. qPCR has been used as a supplemen-
tary technique for characterizing lung cancer cells [14].
The recent development of DNA databases and bioin-
formatics techniques has made it possible to determine
gene pathways and gene networks [15]. Statistical ana-
lyses, such as pr incipal component analysis (PCA), have
recently proven useful in this field. Establishing molecu-
lar profiles of the four hist opathological subtypes of
lung cancer cells in relation to gene networks and statis-
tical analysis would be a valuable and meaningful under-
taking. Because the analysis of DNA microarrays is
expensive and compl ex, it is often not practical for rou-
tine diagnosis to use high-throughput DNA microarrays
containing more than 10,000 genes. A diagnostic
approach designed for less than 100 marker genes us ing
either a smaller, less-expensiveDNAmicroarrayor
qPCR would be more practical. To classify the four his-
topatholo gical subtypes, we selected 100 candidate mar-
ker genes tha t showed relatively consistent differential
expression in reports that analyzed a total of 580 clinical
lung cancer tissues and 64 lung cancer cell lines
[1-3,6-10]. We first selected candidate genes using DNA
microarrays and then quantified their expression by
qPCR. Although clinical application is the ultimate goal,
there are some issues to consider when examining clini-
cal tissues with DNA microarray s or qPCR. First, tissues
contain varying amounts of contamination from neigh-
boring stromal cells. Second, RNA amplification is
required if the amount o f clinical tiss ue is lim ited, for
instance when samples are obtained by microdissection
of cancer cells. While these issues are not problematic
for analyzing lung cancer cell li nes, they become signifi-
cant barriers when analyzing clinical samples. Finally,
the use of epithel ial tissue from sites adjacent to tumors
as the normal control has drawn criticism [16], as this
tissue often includes histologically normal but geneti-
cally abnormal cells [17].
In this study, we first selected 100 genes from pub-
lished studies and used DNA microarrays to examine
their expression in eight test cell lines (A549 [AD],
ABC-1 [AD], EBC-1 [SQ], LK-2 [SQ], LU65 [LC], LU99
[LC], STC 1 [SC], RERF-LC-MA [SC]) representing four
histopathological subtypes of lung cancer cells plus a
normal control lung cell line (MRC-9). From this, we
identified 19 candidate genes for subtype-specific mar-
kers. Second, we quantified the expression of these 19
genes in the different cell lines using qPCR. Third, we
evaluated the 19 genes with an additional four validation
lung cancer cell lines (RERF-LC-MS [AD], LC-1/sq
[SQ], 86-2 [LC], and MS-1-L [SC]) and MRC-9 cell by
qPCR. Fourth, we analyzed the data using statistical,
bioinformatics, PCA, and gene pathway analysis (Inge-
nuity Pathways Analysis, IPA). We selected 12 optimal
marker genes and demonstrated that these profiles
could discriminate the four histopathological subtypes of
tumors. In addition, we confirmed the results using
immunohistochemical analysis.
Results
Identification of candidate genes by microarray analysis
We selected 100 genes from public DNA microarray
data [1-3,6-10] and examined their expression in eight
lung cancer cell lines (A549 [AD], ABC-1 [AD], EBC-1
[SQ], LK-2 [SQ], LU65 [LC], LU99 [LC], STC 1 [SC],
RERF-LC-MA [SC]) and a normal control (MRC-9) by
DNA microarray analysis. After eliminating low-expres-
sing genes, we calculated the expression ratio of each
gene in each cancer cell line relative to the normal cell
line. From this, we identified 18 differentially expressed
candidate genes based on the results of a Dunnett’ stest
(Table 1). Another one gene, ISL1, was added as a ten-
tative candidate gene because it had more than 10-fold-
higher expression in one cell line than any other line
(Table 1). The microarray results were deposited in the
CIBEX microarray database (accession CBX 100).
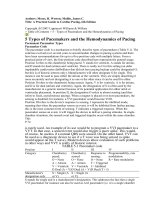
Quantification of 19 candidate genes by qPCR
Using qPCR, we quantified the expression of the 19 can-
didate genes in the same eight test cell lines (A549,
ABC-1, EBC-1, LK-2, LU65, LU99, STC 1, RERF-LC-
MA) and the normal cell line (MRC-9) (Figure. 1). This
Watanabe et al. Cancer Cell International 2010, 10:2
/>Page 2 of 12
gave a total of 152 data points (19 × 8) from each of the
DNA microarray and qPCR analyses. Increases or
decreases in 118 data points from qPCR were consistent
with those from the DNA microarray analysis. Further-
more, qPCR provided more sensitive data than the DNA
microarray analysis (Table 1 and Figure. 1). Using
qPCR, two AD cell lines showed consistent and signifi-
cant upregulation in 12 genes (AMY2A, BEX1, CDH1,
CSTA, DUSP4, FOXG1, IGSF3, INADL, ISL1, MALL,
S100P,andSLCO4 A1) and downregulation in PLAU.
Two SQ cell lines showed upregulation in 11 genes
(AMY2A, BEX1, CDH1, DUSP4, HMGA1, IGSF3,
INADL , ISL1, MALL, RAB25, and SLCO4A1) and down-
regulation in PLAU. Two LC cell lines showed upregula-
tion in 12 genes (AMY2A, CDH1, DUSP4, FOSL1,
FOXG1, HMGA1, IGSF3, ISL1 , MALL, RAB25, S100A2,
and SLCO4A1)anddownregulatedinCSTA.TwoSC
cell lines showed upregulation in nine genes (AMY2A,
BEX1, FOXG1, IGSF3, INADL, ISL1, RAB 25, SLCO4A1,
and STMN1
) and downregulation in TGM2 (Figure 1).
Evaluation by qPCR using validation cell lines
We evaluated the expression profiling of the 19 g enes
using four validation cell lines (RERF-LC-MS [AD], LC-
1/sq [SQ], 86-2 [LC], and MS-1-L [SC]) and t he normal
control (MRC-9). The results of expression profiling are
shown in Figure 1. The validation AD cell line showed
similar upregulation in the same 12 genes (AMY2A,
BEX1, CDH1, CSTA, DUSP4, FO XG1, IGSF3, INADL,
ISL1, MALL, S100P,andSLCO4A1) and downregulation
in PLAU. The validation SQ cell line showed similar
upregulation in 10 genes (AMY2A, BEX1, CDH1,
HMGA1, IGSF3, INADL, ISL1, MALL, RAB25 and
SLCO4A1) and downregulation in PLAU. The validation
LC cell line showed similar upregulation in 10 genes
(AMY2A, CDH1, FOSL1, HMGA1, IGSF3, ISL1, MALL,
RAB25, S100A2,andSLCO4A1). The validation SC cell
line showed similar upregulation in the same nine genes
( AM Y2A, BEX1, FOXG1, IGSF3, INADL, ISL1, R AB25,
SLCO4A1,andSTMN1) and downregulation in TGM2.
Thus, the concordance rates were 100% for the AD, and
SC validation lines, 92% (11/12) for the SQ li ne, 77%
(10/13) for the LC line, and 92% (44/48) overall. CSTA,
DUSP4,andS100P were upregulated consistently in
only AD cells, and FOSL1 and S100A2 we re upregulated
in only LC cells. STMN1 was upregulated and TGM2
was downregulated in only SC cells.
Principal component analysis (PCA)
To classify the four histopathological subtypes by PCA
we tried and selected various set of qPCR results from
19 genes. The four histopathological subtypes were
Table 1 Selection of candidate genes by DNA microarray
Gene Cell lines by histopathological subtype
AD SQ LC SC
A549 ABC-1 EBC-1 LK-2 LU65 LU99 STC 1 RERF-LC-MA
AMY2A -1.22 0.87 3.68 ** 0.68 2.50 * 1.90 2.91 * 1.36
BEX1 3.25 5.69 7.36 ** 3.08 -0.17 2.86 4.72 * 5.72
CDH1 1.85 3.70 ** 1.87 3.85 ** -0.41 5.20 0.48 -0.70
CSTA 2.54 ** 4.79 ** -1.06 0.80 0.09 -1.93 2.18 ** 0.33
DUSP4 4.24 ** 2.34 ** 4.91 ** 1.26 4.12 ** 0.96 -3.21 2.16 *
FOSL1 -1.26 -1.73 3.27 ** -2.62 2.10 ** 2.44 ** -4.13 2.17 **
FOXG1 -0.19 3.78 -0.20 0.65 -0.16 1.14 5.63 ** 0.17
HMGA1 -0.59 0.24 2.82 ** 0.82 1.68 ** 3.24 ** 0.49 2.81 **
IGSF3 5.61 ** 4.86 -0.12 6.35 * 0.19 1.28 4.71 4.62
INADL 2.44 3.70 2.50 7.65 ** 0.48 1.48 0.80 2.30
ISL1 0.31 -0.45 0.08 2.21 4.61 0.10 -0.74 3.96
MALL 2.20 ** 2.39 ** 2.44 ** -0.07 3.86 ** 1.54 * N.D. 2.36 **
PLAU -3.61 ** -7.21 ** -0.02 -6.75 ** -1.82 ** -1.17 ** -6.95 ** -1.62 **
RAB25 -0.39 6.39 ** 3.37 5.33 ** 0.65 0.44 -2.87 -1.18
S100A2 -0.70 -0.02 4.73 ** 0.08 2.95 ** 1.66 -1.01 4.76 **
S100P 6.28 ** 8.57 ** -0.47 5.00 6.80 ** 0.38 0.39 0.13
SLCO4A1 0.13 2.92 2.81 1.52 4.74 * 6.67 ** 2.83 1.78
STMN1 -1.44 1.41 ** 1.49 ** 1.41 ** 0.44 0.68 2.07 ** 2.21 **
TGM2 -0.56 -2.93 ** 0.46 -5.61 ** -0.39 -1.99 -7.62 ** -5.52 **
Total RNA was extracted from each cultured cell line and reverse-transcribed to produce cDNA. cDNA samples from cancer cells (labeled with Alexa 555) and
from normal cells (labeled with Alexa 647) were mixed and hybridized to a DNA microarray that was then scanned with a DNA microarray scanner (n = 6). The
ratio of cancer cells to control cells, based on the relative intensities of the two fluorescence signals, was calculated using ArrayGauge. *p < 0.05, **p < 0.01 with
Dunnett’s test.
Watanabe et al. Cancer Cell International 2010, 10:2
/>Page 3 of 12
MALL
-2
0
2
4
6
8
10
12
DUSP4
-6
-4
-2
0
2
4
6
8
S100P
-2
0
2
4
6
8
10
12
14
PLAU
-12
-10
-8
-6
-4
-2
0
2
TGM2
-12
-10
-8
-6
-4
-2
0
2
4
SLCO4A1
0
2
4
6
8
10
CSTA
-6
-4
-2
0
2
4
6
8
10
S100A2
-1
0
1
2
3
4
5
6
HMGA1
-1
0
1
2
3
4
FOSL1
-6
-5
-4
-3
-2
-1
0
1
2
3
4
Ratio log
2
(Cancer/Normal)
ISL1
0
1
2
3
4
5
6
7
8
FOXG1
0
2
4
6
8
10
12
14
BEX1
-2
0
2
4
6
8
10
INADL
-3
-2
-1
0
1
2
3
4
5
6
7
STMN1
-1
0
1
2
3
IGSF3
0
2
4
6
8
10
12
RAB25
0
2
4
6
8
10
12
14
CDH1
0
2
4
6
8
10
12
14
Cell Lines
A549
ABC-1
RERF-LC-MS
EBC-1
LK-2
LC-1/sq
LU65
LU99
86-2
STC 1
RERF-LC-MA
MS-1-L
AD SQ LC
SC
AD SQ LC
SC
AD SQ LC
SC
AD
SQ
LC
SC
* p < 0.05, * p < 0.01
by Dunnett's test
*
*
*
*
*
*
*
*
*
*
*
*
*
*
*
*
*
*
*
*
*
*
*
*
*
*
*
*
*
*
*
*
*
*
*
*
*
*
*
*
*
*
*
*
*
*
*
*
*
*
*
*
*
*
*
*
*
*
*
*
*
*
*
*
*
*
*
*
*
*
*
*
*
*
*
*
*
*
*
*
*
*
*
*
*
*
*
*
*
*
*
*
*
*
*
*
*
*
*
*
*
*
*
*
*
*
*
*
*
*
*
*
*
*
*
*
*
*
*
*
*
*
*
*
*
*
*
*
*
*
*
*
*
*
*
*
*
*
*
*
*
*
*
*
*
*
*
*
*
*
*
*
*
*
*
*
*
*
*
*
*
*
*
*
*
*
*
*
*
*
*
*
*
*
*
*
*
*
*
*
*
*
*
*
*
*
*
*
*
*
AMY2A
0
1
2
3
4
5
6
*
*
**
*
*
*
*
*
*
*
*
Figure 1 Quantification and validation of 19 genes by qPCR. The expression of 19 genes in 8 test lung cancer cell lines (black and gray) and
four validation cell lines (white) was quantified by qPCR and compared to a normal control cell line (MRC-9).
Watanabe et al. Cancer Cell International 2010, 10:2
/>Page 4 of 12
optimally classified by PCA using 12 genes (AMY2A,
CDH1, FOXG1, IGSF3, ISL1, MALL, PLAU, RAB25,
S100P, SLCO4A1, STMN1,andTGM2)intheeighttest
cell lines, with the loading number of components 1, 2,
and 3 (PC1, PC2, and PC3; 3 dimensions) shown in Fig-
ure 2(A). Using the same frame, the four subtypes were
also classified using all 12 test and validation cell lines,
as shown in Figure 2(B). Figure 2(B) shows that the four
subtypes were divided into two prominen t groups corre-
sponding to positive PC2 values (AD and SQ) and nega-
tive PC2 values (LC and SC). In Figure 2(C), which
shows the principal component for the cell lines (PC1,
PC2, and PC3), two of the three AD cells lines were
close, whereas the third cell line was close in PC2 to the
other two cell lines, but separate in PC1 and PC3. Speci-
fically, A549 and RERF-LC-MS cells were close in PC1,
PC2, and PC3, whereas ABC-1 cells showed a distinct,
small negative value in PC3. Two SQ cell lines, EBC-1
and LK-2, were c lose in PC1, PC2, and PC3, whereas
one SQ cell line, LC-1/s q, showed a distinct, large posi-
tive value in PC1 and PC3. Two close AD cell lines and
two close SQ cell lines were different in PC3 with a
positive value in AD and a negative value in SQ. ABC-1
(AD) and LC-1/sq (SQ) were also separated in different
directions. Two LC cell lines, LU65 and LU99, were
close in PC1, PC2, and PC3, whereas one LC cell line,
86-2, showed intermediate separation in PC1 and PC3.
The three SC cell lines were close to each other. Two
close LC cell lines and three SC cell lines were different
in PC1, with a negative value for LC and a positive
value for SC. The 86-2 cell line (LC) was different in
PC3 from the SC cell lines. Subtypes were characterized
by PC1-3 and lo ading number. In Figure 2(D), which
shows the loading number for genes, PC1 was negatively
correlated with the expression of PLAU, SLCO4A1,and
TGM2, and positively correlated with IGSF3 , STMN1,
FOXG1, and RAB25. PC2 was negatively correlated with
the expression of STMN1, AMY2A,andISL1,andposi-
tively correlated with S100P, RAB25,andCDH1.PC3
was negatively correlated with the expression of RAB25
and AMY2A, and positiv ely correlated with TGM2,
MALL, and IGSF3.
Gene networks and gene pathways
To further under stand the bi ological networks of the 19
genes, we next analyzed their b iological interactions
using the Ingenuity Pathways Analysis (IPA) tool. Ten
networks were extracted from each cancer cell line.
Table 2 shows a major network (network 1) that con-
tained 12 of the 19 candidate genes (AMY2A, BEX1,
CDH1, DUSP4, FOSL1, FOXG1, HMGA1, ISL1, PLAU,
S100P, STMN1,andTGM2), including 7 of the 12 PCA
genes (CDH1, FOXG1, ISL1, PLAU, S100P, STMN1, and
TGM2), using ABC-1 cells as a representative cell line.
The other 11 cell lines showe d a similar network 1, with
various gene-specific increases and decreases and with
slightly different top functions. The other nine networks
were smaller (not shown). Figure 3 shows the gene net-
works of 11 of the 12 PCA genes (except SLCO4A1)
based on IPA results. Link from SLCO4A1 to the pre-
sent gene netwo rks was not extrac ted by IPA. The con-
nection including CD H1, PLAU,andSMAD4 suggested
to be related to cell adhesion by IPA. The connection
including TGM2, IL1B,andPLAU and the connection
including RAB25, SNAI1,andCDH1 were suggested to
be related to tumor invasion by IPA. STMN1 was sug-
gested to influence cell motility, and S100P was sug-
gested to be associated with cell growth by IPA.
Immunohistochemistry
Routine immunohistochemical studies were performed
in four test cell lines (A549, EBC-1, LU65, and STC 1)
and the control (MRC-9), to define their histopathologi-
cal classification (Figure 4). S100P protein was expressed
in the cytoplasm of A549 and LU65 cells. RAB25 pro-
tein was expressed in the cytoplasm of EBC-1 cells.
These results were consistent with the gene expression
data for S100P and RAB25 (Figure 1).
Discussion
We compared four histopathological subtypes of 12 lung
cancer cell lines using a statistical processing method,
PCA, which is based on gene expression profilin g deter-
mined by qPCR. Four subtyp es were optimally classified
by PCA using 12 genes (AMY2A, CDH1, FOXG1,
IGSF3, ISL1, MALL, PLAU, RAB25, S100P, SLCO4A1,
STMN1,andTGM2)fromthe19candidategenes
shown in Figure 1. PCA analysis revealed that the load-
ing number of component 1 (PC1) was negatively corre-
lated with the expression of PLAU, SLCO4A1,and
TGM2, and positively correlated with IGSF3 , STMN1,
FOXG1, and RAB25. The loading number of component
2 (PC2) was negatively correlated with the expression of
STMN1, AMY2A ,andISL1, and positively correlated
with S100P, RAB25,andCDH1. The loading number of
component 3 (PC3) was negatively correlated w ith the
expression of RAB25 and AMY2A, and posit ively corre-
lated with TGM2, MALL,andIGSF3. The four subtypes
were divided into two prominent groups with PC2, cor-
responding to positive PC2 values (AD and SQ) and
negative PC2 values (LC and SC). Because PC2 was
positively correlated with the expression of CDH1,
S100P, and RAB25, these genes may be significant in the
classification of the four subtypes. Three SC cell lines
were close to each other in PC1, PC2, and PC3. As the
presence of subclasses in AD and SQ clinical tissues was
suggested [6,7,18], it w as probable that there was some
diversity in the present AD and SQ cell lines. Gene
expression of these 12 genes was generally consistent
with some exceptions in the four subtypes. Even when
Watanabe et al. Cancer Cell International 2010, 10:2
/>Page 5 of 12
P
C
1
(
2
7
.
4
%
)
P
C
2
(
2
1
.
6
%
)
1
12
2
3
4
5
6
7
89
1011
1
2
4
5
7
8
1011
P
C
1
(
2
7
.
4
%
)
PC3 (18.6%)
P
C
2
(
2
1
.
6
%
)
Loading number for genes
(A)
(B)
(C)
(D)
Principal component for cell lines
PC3 (18.6%)
Figure 2 Principal component analysis of cell lines with 12 genes based on qPCR data. PCA differentiates four histopathological subtypes
by three-dimensional expression clustering. The values of triplicate qPCR assays for each sample were analyzed. Results of PCA are shown in the
three-dimensional contribution scores for component numbers 1, 2, and 3 (PC1, PC2, and PC3), which discriminate the four histopathological
clusters. Data are shown for the eight test cell lines alone (A) and in combination with the four validation cell lines (B). The contribution scores
were produced by conversion from each eigenvector value.
Table 2 IPA network 1 of ABC-1 cell
Cell Genes in network Score Focus genes Top functions
ABC-1 AGER, Ap1, ↑ BEX1,
CDC42EP5, ↑ CDH1, Ck2,
deoxycholate, ↑ DUSP4, ERK,
↓ FOSL1, ↑ FOXG1, FSH,
FXYD5, GDF15, HMGA1, Il8r,
↑ ISL1, Jnk, LCN2, MAD2L2,
Mapk, MGAT3, MKP2/5, NFkB,
PDGF BB, PI3K, ↓ PLAU,
PTPRF, PVR, RAGE, S100A1, ↑
S100P, SLC12A6, ↓ STMN1, ↓
TGM2
28 11 Cancer, Cellular Movement,
Cellular Growth and
Proliferation
Biologically relevant network 1 extracted by IPA is shown for ABC-1 cell as a representative. ↑ marks represent upregulated genes and ↓ marks downregulated
genes. genes.
Watanabe et al. Cancer Cell International 2010, 10:2
/>Page 6 of 12
gene expression was not fully consistent among the sub-
types, PCA with the present 12 genes could be used
effectively to classify the four subtypes.
Using DNA microarrays and qPCR, Kuner et al. [19]
recently compared gene expression in 42 AD and 18 SQ
clinical tumor samples and systematically analyzed their
expression patterns using gene ontology. This group
identified 14 tight junction genes and 9 epithelial-
mesenchymal transition genes that were upregulated or
downregulated in AD samples, SQ samples, or both.
Among these genes, the epithelial-mesenchymal transi-
tion gene CDH1, which codes for E-cadherin, was upre-
gulated in both AD and SQ samples. We also examined
gene ontology. Although our overall results were
unclear, our data suggest that CDH1 is a ssociat ed with
cell adhesion, and that the AD and SQ cell lines are
associated with greater cell adhesion, while LC and SC
cell lines are associated with weaker cell adhesion.
Taken together, these studies demonstrate a remarkable
upregulation of CDH1 in AD and SQ cells, but not LC
and SC cell s, making this a candidate marker for differ-
entiating lung cancer subtypes. CDH1 was the only gene
studied in both the Kuner et al. report and in ours.
Using cDNA microarrays and gene ontology, Inamura
et al. [18] analyzed 48 SQ clinical tissue samples and
classified them into tw o subclasses. Subclass A genes
were related to processes such as cell proliferation and
cell cycle progression, while subclass B genes were
related to processes such as the MAPKKK cascade and
apoptosis. They focused on 30 possible marker genes
that were completely different from the 23 genes identi-
fied in the Kuner et a l. report and the 12 genes w e
studied.
Using b ioinformatics, Kim et al. [20] extracted differ-
entially expressed lung cancer candidate genes from
published data examined bySAGEmethod.Next,they
used qPCR to compare candidate gene expression in 18
AD and 18 SQ samples from microdissected clinical
Network Shapes
Cytokine
Enzyme
Kinase
Transcription Regulator
Other
Relationships
direct interaction
indirect interaction
Figure 3 Gene networks and pathways of 11 genes from PCA analysis. The network was analyzed using Ingenuity Pathways Analysis
software and is displayed graphically as nodes (genes/gene products) and edges (the biological relationships between the nodes). Nodes are
displayed using shapes that represent the functional class of the gene product, as indicated in the key. Edges are displayed with labels that
describe the nature of the relationship between the nodes (E, expression; L, proteolysis; LO, localization; M, biochemical modification; P,
phosphorylation/dephosphorylation; PP, protein-protein binding; RB, regulation of binding).
Watanabe et al. Cancer Cell International 2010, 10:2
/>Page 7 of 12
tissues. They extensively examined seven genes and
identified two, CBLC and CYP24A1, as n ovel candidate
biomarkersforADandSQcells.Theyalsosuggested
that S100P, which encodes S100 calcium-binding protein
P, may be a good biomarker f or AD cells. The expres-
sion ratio of S100P in cancer/normal cells was high in
AD samples and low in SQ samples. I n our study, all
three AD cell lines showed a robust increase in S100P
expression, while the three SQ cell lines showed less or
no increase. Taking our data and the Kim et al. d ata
together, the remarkable and specific upregulation of
S100P in AD cells suggests that this is a candida te mar-
ker for distinguishing the AD subtype. Although the
Kim and Kuner groups both analyzed AD and SQ sam-
ples, their gene sets (7 and 30, respectively) were non-
overlapping.
Identification of molecular markers often leads to
important clinical applications, such as earlier diagnosis,
better prognosis, and more effective drug targeting.
Although numerous papers examining lung cancer tis-
sues and/or lung cancer cell lines using DNA microar-
rays and/or qPCR have been published e.g.
[1-3,6-10,19,20], lung cancers still lack reliable molecular
markers [20]. The genes examined varied between
paper, and the results were not necessarily consistent.
This variability may result from technical limitations,
differences in methodology, a nd the broad biological
heterogeneity of lung cancers themselves. Continued
accumulation of data will help resolve this question.
The studies described were conducted primarily with
AD and SQ samples. Many fewer studies looked at LC
and SC samples, and direct comparison of all four histo-
pathological subtypes using the same method(s) was
rare. Our study is unique because we examined 12 lung
cancer cell lines representing all four subtypes, and we
used both qPCR and PCA of 12 genes (AMY2A, CDH1,
FOXG1, IGSF3, ISL1, MALL, PLAU, RAB25, S100P,
SLCO4A1, STMN1, and TGM2). Although none of these
12 genes represent novel candidate markers because
they were all selected from earlier microarray studies
[1-3,6-10], this is the first report that systematically ana-
lyzed them together in all four subtypes.
The gene network was analyzed using Ingenuity Path-
ways Analysis software and is displayed graphically in
Figure 3. The first connection including CDH1, PLAU,
and SMAD4 was suggested to be related to cell adhesion
[21,22]. It was reported that SMAD4 reduced the
expression level of endog enous PLAU [21] and induced
CDH1 expression [22]. The second connection including
RAB25, SNAI1,andCDH1 was suggested to be related
to tumor invasion. It was reported that RAB25 enhanced
the ability of tumor cells to invade the extracellular
matrix [23]. The first and second connection may be
applicable to AD and SQ cell lines in this study. It was
reported that STMN1 influenced cell motility [24] and
S100P was associated with cell growth [25]. STMN1 and
S100P may work in SC cell lines and AD cell lines,
respectively, in this study. The third connection includ-
ing TGM2, IL1B,andPLAU was suggested to be tumor
invasion. It was reported that IL1B increased the expres-
sion level of
TGM2 [26], which might be involved in
establishing a barrier to tumor spreading [27]. The third
connection may not be effective in cell lines in this
study, because TGM2 was rather downregulated in this
study.
Six of the genes analyzed (CDH1, PLAU, RAB25,
S100P, STMN1, and TGM2) have attracted recent atten-
tion relating to therapeutic drug sensitivity and prog-
nosis. In gene expression profiling studies of lung
cancer cell lines to study therapeutic drug sensitivity,
PLAU and CDH1 have been suggested as novel biomar-
kers of cetuximab sensitivity [28], and TGM2 was sug-
gested as a potential marker of doxorubicin sensitivity
MRC-9
A549
EBC-1
LU65
STC1
RAB25S100P
Figure 4 Immunohistochemical analysis.Representativeimages
of immunohistochemical analysis of S100P and RAB25 protein in
four lung cancer cell lines (A549 [AD], EBC-1 [SQ], LU65 [LC], and
STC 1 [SC]) and the normal cell line MRC-9. Bar, 20 μm.
Watanabe et al. Cancer Cell International 2010, 10:2
/>Page 8 of 12
[27]. STIMN1 was reported to be a novel therapeutic
target for anticancer activity [29]. Additionally, RAB25
may be linked to tumor aggressiveness and metastasis
[23], and S100P maybeadiagnosticmarkerofnon-
small-cell lung cancer [30,31]. PLAU has also been
examined in relation to lung cancer prognosis [32]. The
set of 12 well-characteri zed cell lines de scribed in this
study, representing the four histopathological subtypes,
should prove useful for screening therapeutic drugs and
their effects on specific genes.
We performed additional immunohistochemical stu-
dies to examine S100P and RAB25 (Figure 4). The
results were generally consistent with the gene expres-
sion data (Figure 1). In immunostained tumor tissues,
AD cells showed immunostaining of S100P in the cyto-
plasm and the nucleus, while SQ cells showed immu-
nostaining of RAB25 in the cytoplasm. The localization
of S100P and RAB25 in tumor tissues was similar to
that in cultured cells (data not shown).
Although DNA microarray technology is a powerful
tool for characterizing gene expression on a genome
scale, issues of reliability, reproducibility, and the corre-
lation of data across different DNA microarrays still
need to be addressed. Recently, qPCR was described as
being simpler and more reliable than DNA microarrays
[13]. Our experiments confirmed that qPCR was sim-
pler, more reproducible, and more reliable than DNA
microarrays. In the future, identification of reliable mar-
ker genes will hopefully allow for the development of
automatic qPCR systems for routine clinical cancer
diagnosis.
We examined the characteristi cs of four histopatholo-
gical subtypes in lung cancer cell lines using both statis-
tical analysis and biological network analysis. In the
future, studies with cultured lung c ancer cells should
improve our ability to predict the response of different
lung cancer types to specific therapeutic regimens.
Conclusions
Our results showed that the four histopathological sub-
types, represented by 12 lung cancer cell lines, were well
characteri zed by qPCR and PCA using 12 genes:
AMY2A, CD H1, FOXG1, IGSF3, ISL1, MALL, PLAU ,
RAB25, S100P, SLCO4A1, STMN1,andTGM2. Based
on their upregulation and the results of the PCA analy-
sis, S100P and CDH1 were identified as candida te mar-
kers for AD tumors and for AD and SQ tumors,
respectively.
Methods
Cell lines and RNA isolation
The human lung cancer cell lines ABC-1 (AD), RERF-
LC-MS (AD), EBC-1 (SQ), LK-2 (SQ), LC-1/sq (SQ),
LU65 (LC), LU99 (LC), STC 1 (SC), RERF-LC-MA (SC),
MS-1-L (SC), and MRC-9 (normal control lung cell
line) were purchased from the Japanese Collection
Research Resources Bank (JCRB, Osaka Japan). The 86-
2 (LC) lung cancer cell line was purchased from Riken
Bioresource Center (Tsukuba, Japan), and the A549
(AD) lung cancer cell line was a generous gift provided
by Dr. Akira Yasui of Tohoku Universit y (Sendai,
Japan). Total RNA samples were isolated from each cul-
tured cell line using Micro Smas h MS-100 (Tomy Digi-
tal Biology Co., Ltd. Tokyo) and QuickGene-800
(Fujifilm, Tokyo). RNA quality assurance was performed
by measuring the 260:280 nm ratio with a spectrophot-
ometer (NanoDrop Technologies, LLC, Wilmington, DE,
USA) and by gel electrophoresis using the Bioanalyzer
and Agilent RNA 6000 N ano kit (Agilent Technologies
Inc., Santa Clara, CA, USA).
DNA microarray design and production
The 100 candidate marker genes, which were selected
based on pr evious reports [1-3,6-10], are shown in addi-
tional file 1. jp/Chem/
ChemHP/Furihatalab/. Synthesis of newly designed probes
(Japan Patent No. 2007-234363) w as outsourced to Invi-
trogenCorp.(Carlsbad,CA,USA).Theprobeswere
spotted onto a GeneSlide platform (Toyo Kohan Co., Ltd.
Tokyo) using a Genex Arrayer Type-M (Kaken Geneqs,
Inc., Chiba, Japan). GeneSlides were prehybridized at 80°C
for 1 hour, washed in 2× SSC/0.2% SDS and then ultra-
pure water, and then dried by centrifugation.
cDNA synthesis and gene expression profiling by DNA
microarray
Alexa-labeled target cDNA w as prepared from 20 μg
total RNA using a SuperScript Plus Indirect cDNA Sys-
tem kit (Invitrogen Corp., Carlsbad, CA, USA). cDNA
obtained from cancer cell lin es was labeled with Alexa
555, and cDNA obtained from the control cell line was
labeled with Alexa 647. The two Alexa-labeled cDNA
samples were mixed and hybridiz ed to a single DNA
microarray that was then scanned in a DNA microarray
scanner (FLA-8000, Fujifilm). To identify upregulated
and downregulated genes, the ratio of relative intensities
of the two fluorophor es (Alexa 555: Al exa 647) was cal-
culated after global normalization using ArrayGauge
(Fujifilm). DNA micro array array d ata were deposited
into the Center for Information Biology Gene Expres-
sion Database (CIBEX; accession: CBX 100).
Quantification of genes using qPCR
cDNA was prepared from 2.5 μgtotalRNAusingthe
SuperScript first-strand synthesis system from an RT-
PCR kit (Invitrogen Corp., Carlsbad, CA, USA). qPCR
amplifications were performed with triplicate assays
using the SYBR Green I assay in an Opticon 2 thermal
cycler (MJ Research, Inc., Waltham, MA, USA). The
reactions were carried out in a 96-well plate in 20-μl
reactions containing 2× SYBR Green Master Mix
Watanabe et al. Cancer Cell International 2010, 10:2
/>Page 9 of 12
(Applied Biosystems, Lincoln Centre Drive Foster City,
CA, USA), 2 pmol of each forward a nd reverse primer,
and a cDNA template corresponding to 400 pg total
RNA. The primer sequences and Ct values of the 19
candidate genes and GAPDH (a housekeeping gen e as
an internal control) are shown in Table 3. SYBR G reen
PCR conditions were 95°C for 10 minutes, followed by
45 cycles of 95°C for 10 seconds, 58°C fo r 50 sec onds,
and 72°C for 20 seconds. In each assay, a standard curve
was calculat ed concurrently with the examined sampl es.
In the preliminary experim ent, the group express ing the
highest amount of product was selected for each gene
and used as the standa rd sample in the subse quent
assay. Each standard curve consisted of six serial dilu-
tions (1, 1/5, 1/25, 1/125, 1/625, and 1/3125) of the
selected standard cDNA for each gene. The relative
quantitative value o f each sample was determined with
the 1/25-diluted cDNA and was normalized to GA P DH
as described previously [33]. Relative GAPDH expression
in the experimental cell lines is shown in Figure 5.
Gene pathways, networks, and ontology analysis
Biological networks were generated with Ingenuity Path-
ways Analysis 7.0 (IPA), a w eb-based applicati on http://
www.Ingenuity.com that enables the visualization and
analysis of biologically relevant networks to enable the
discovery, visualization, and exploration of therapeuti-
cally relevant networks as described previously [33].
Ontology analysis was performed with IPA and http://
geneontology.org/.
Immunohistochemistry
Routine immunohistochemistry was performed using
formalin-fixed, paraffin-embedded sections as described
in the manufacturer’ s protocol. We could obtain only
RAB25 and S100P antibodies. The following antibodies,
dilutions, and pretreatment conditions were used: anti-
RAB25 (1:100), trypsin pretreatment; Abnova Corpora-
tion, Taipei, Taiwan) and an ti-S100P (polyclonal rabbit
0
1
2
3
4
5
1 2 3 4 5 6 7 8 9 10 11 12 13
Ratio (Cancer cell / MRC-9)
Figure 5 Relative expression of GAPDH. Total RNA was extracted
from each of the 12 lung cancer cell lines and reverse-transcribed
to produce cDNA. GAPDH expression was determined by qPCR in
triplicate assays. Results are shown as the mean ± S.D. Numbers
indicate cell lines, 1: MRC-9 [normal control], 2: A549 [AD], 3: ABC-1
[AD], 4: RERF-LC-MS [AD], 5: EBC-1 [SQ], 6: LK-2 [SQ], 7: LC-1-sq [SQ],
8: LU65 [LC], 9: LU99 [LC], 10: 86-2 [LC], 11: STC 1 [SC], 12: RERF-LC-
MA [SC] and 13: MS-1-L [SC].
Table 3 Primer sequences of 20 genes examined in the study
No. Symbol Ct Left Right
1 AMY2A 25-31 GGGTTCGTATTTATGTGGATGC GGGTTCGTATTTATGTGGATGC
2 BEX1 21-31 GCCTAGAGGAAATCGTAGGCGGTTC CTCTCATCCTTGCCTGTGGTTCTCC
3 CDH1 22-33 TGGGCAGCTATCCAGTGACTTGTTC CTGTCTTTGGCTGCAGCACTTTAGG
4 CSTA 25-35 CACTTTGGTTCCAGCATCCTGTC ACAATCTCCTGGATTTCTGGAGTG
5 DUSP4 20-29 CTGCTTCTCAGTGGCAACAAAC CCGTAGCATGCAGATGTCAAGG
6 FOSL1 18-22 TAAGGCGCGAGCGGAACAAG TCGCTGCAGCCCAGATTTCTC
7 FOXG1 23-36 GCGCCAGCAGCACTTTGAGTTAC TGGTTGTTGCCCAGCGAGTTC
8 GAPDH(GAPD) 21-22 AGTAGAGGCAGGGATGATGTTC CTTTGGTATCGTGGAAGGACTC
9 HMGA1 17-20 GCGAAGTGCCAACACCTAAGAGACC CCTTGGTTTCCTTCCTGGAGTTGTG
10 IGSF3 24-35 GACCTCATTGCGCATTGTCTAC CATGTCCTAGAATGCGCCTAG
11 INADL 23-31 AGAATGGACTTGGACTCAGCCTTGC CATCTCCAATACGCATTCGTCCATC
12 ISL1 24-33 GTACGGGATCAAATGCGCCAAG AGGCCACACAGCGGAAACACTC
13 MALL(BENE) 21-33 CATTACATCCGTGGATTCTCC GTGCTTAAGAGAATGTGAGGG
14 PLAU 21-31 CGCTGCTCCCACATTGGCTAAG TGTGCATGGGTGAAGGGAGAGC
15 RAB25 21-33 TGATCGGCGAATCAGGTGTGG CAACATCACAGTGCGGGTGGAG
16 S100A2 22-27 GCAGCCTGGATGAGAACAGTGACC CAGCCCTGGAAGAAGTCATTGCAC
17 S100P 18-32 GTCTGAATCTAGCACCATGACG GGAAGCCTGGTAGCTCCTTC
18 SLCO4A1 22-32 TCCATCTGGCTCCTGCTGAAGAAC GCTTCTGAGGCACTCAGGCTGAAC
19 STMN1 21-25 AAAGAACTGGAGAAGCGTGCCTCAG CTGAATTTCCTCCAGGGAAAGATCC
20 TGM2 21-36 CTGGTCACTAACCAACAAGGTTG GAGCAGGAGATAAAGTCAAAGCTG
Ct: cycle threshold.
Watanabe et al. Cancer Cell International 2010, 10:2
/>Page 10 of 12
anti-S100, (1:400), trypsin pretreatment; DakoCytoma-
tion, Copenhagen, Denmark).
Statistical analysis
For statistical ana lysis program, we performed a loga-
rithmic (log
2
) transformation of the data to stabi lize the
variance and the gene expression profile of each cancer
cell line, which was normalized to the median gene
expression level for the entire sample set. DNA microar-
ray results of the eight test cell lines were analyzed with
aDunnett’s te st. qPCR results of the 19 candidate genes
in 12 cell lines were analyzed with a Dunnett’stestand
principal component analysis (PCA). PCA was per-
formed using both the PCA program in R (2.8.0; http://
www.r-project.org/) and Microsoft Office Excel 2003
(Microsoft, Redmond, WA, USA).
Additional file 1: One hundred genes examined in the present
study. Symbols, gene names and accession numbers are shown.
Click here for file
[ />S1.pdf ]
Acknowledgements
This work was supported in part by Regional New Consortium R&D Projects,
The Ministry of Economy, Trade and Industry, Japan (C. Furihata), and a
Grant-in-Aid from the Private School High-tech Research Center Program of
the Ministry of Education, Culture, Sports, Science, and Technology, Japan (C.
Furihata). We thank Dr. Takayuki Negishi, School of Science and Engineering,
Aoyama Gakuin University, for collaboration with the Bioanalyzer experiment,
and Dr. Kazuhiko Matsumoto, Torii Pharmaceutical Co. Ltd. for his advice on
Dunnett’s test.
Author details
1
Department of Chemistry and Biological Science, School of Science and
Engineering, Aoyama Gakuin University, Kanagawa 229-8558, Japan.
2
Department of Chest Surgery, Niigata Rosai Hospital, Japan Labor Health
and Welfare Organization, Niigata 942-8502, Japan.
3
Department of
Pathology, Niigata Rosai Hospital, Japan Labor Health and Welfare
Organization, Niigata 942-8502, Japan.
Authors’ contributions
TW: Experimental design, all experiments, interpretation of data, and
manuscript preparation. TM: Experiments (cell culture and DNA microarray
analysis). YD: Experiments (cell culture and quantitative real-ti me PCR
analysis). YF: Experiments (cell culture and quantitative real-time PCR
analysis). MI: Experiments (analysis with antibody). MK: Experiments (analysis
with antibody). CF: Experimental design, conception, and manuscript
preparation. All authors have read and approved the final manuscript.
Competing interests
The authors declare that they have no competing interests.
Received: 5 October 2009
Accepted: 21 January 2010 Published: 21 January 2010
References
1. Giordano TJ, Shedden KA, Schwartz DR, Kuick R, Taylor JM, Lee N, Misek DE,
Greenson JK, Kardia SL, Beer DG, Rennert G, Cho KR, Gruber SB, Fearon ER,
Hanash S: Organ-specific molecular classification of primary lung, colon,
and ovarian adenocarcinomas using gene expression profiles. Am J
Pathol 2001, 159:1231-1238.
2. Beer DG, Kardia SL, Huang CC, Giordano TJ, Levin AM, Misek DE, Lin L,
Chen G, Gharib TG, Thomas DG, Lizyness ML, Kuick R, Hayasaka S, Taylor JM,
Iannettoni MD, Orringer MB, Hanash S: Gene-expression profiles predict
survival of patients with lung adenocarcinoma. Nat Med 2002, 8:816-824.
3. Endoh H, Tomida S, Yatabe Y, Konishi H, Osada H, Tajima K, Kuwano H,
Takahashi T, Mitsudomi T: Prognostic model of pulmonary
adenocarcinoma by expression profiling of eight genes as determined
by quantitative real-time reverse transcriptase polymerase chain
reaction. J Clin Oncol 2004, 22:811-819.
4. Fan X, Shi L, Fang H, Harris S, Perkins R, Tong W: Investigation of
reproducibility of differentially expressed genes in DNA microarrays
through statistical simulation. BMC Proc 2009, 3(Suppl 2):S4.
5. Yauk CL, Berndt ML: Review of the literature examining the correlation
among DNA microarray technologies. Environ Mol Mutagen 2007, 48:380-
94.
6. Garber ME, Troyanskaya OG, Schluens K, Petersen S, Thaesler Z, Pacyna-
Gengelbach M, Rijn van de M, Rosen GD, Perou CM, Whyte RI, Altman RB,
Brown PO, Botstein D, Petersen I: Diversity of gene expression in
adenocarcinoma of the lung. Proc Natl Acad Sci USA 2001, 98:13784-13789.
7. Bhattacharjee A, Richards WG, Staunton J, Li C, Monti S, Vasa P, Ladd C,
Beheshti J, Bueno R, Gillette M, Loda M, Weber G, Mark EJ, Lander ES,
Wong W, Johnson BE, Golub TR, Sugarbaker DJ, Meyerson M: Classification
of human lung cancer by mRNA expression profiling reveals distinct
adenocarcinoma subclasses. Proc Natl Acad Sci USA 2001, 98:13790-13795.
8. Nacht M, Dracheva T, Gao Y, Fujii T, Chen Y, Player A, Akmaev V, Cook B,
Dufault M, Zhang M, Zhang W, Guo M, Curran J, Han S, Sidransky D,
Buetow K, Madden SL, Jen J: Molecular characteristics of non-small cell
lung cancer. Proc Natl Acad Sci USA 2001, 98:15203-15208.
9. McDoniels-Silvers AL, Nimri CF, Stoner GD, Lubet RA, You M: Differential
gene expression in human lung adenocarcinomas and squamous cell
carcinomas. Clin Cancer Res 2002, 8:1127-1138.
10. Virtanen C, Ishikawa Y, Honjoh D, Kimura M, Shimane M, Miyoshi T,
Nomura H, Jones MH: Integrated classification of lung tumors and cell
lines by expression profiling. Proc Natl Acad Sci USA 2002, 99:12357-12362.
11. Qin LX, Beyer RP, Hudson FN, Linford NJ, Morris DE, Kerr KF: Evaluation of
methods for oligonucleotide array data via quantitative real-time PCR.
BMC Bioinformatics 2006, 7:23.
12. Nardon E, Donada M, Bonin S, Dotti I, Stanta G: Higher random oligo
concentration improves reverse transcription yield of cDNA from bioptic
tissues and quantitative RT-PCR reliability. Exp Mol Pathol 2009, 87:146-51.
13. Provenzano M, Mocellin S: Complementary techniques: validation of gene
expression data by quantitative real time PCR. Adv Exp Med Biol
2007,
593:66-73.
14. Ju Z, Kapoor M, Newton K, Cheon K, Ramaswamy A, Lotan R, Strong LC,
Koo JS: Global detection of molecular changes reveals concurrent
alteration of several biological pathways in nonsmall cell lung cancer
cells. Mol Genet Genomics 2005, 274:141-54.
15. Waagmeester AS, Kelder T, Evelo CT: The role of bioinformatics in
pathway. Genes Nutr 2008, 3:139-142.
16. Braakhuis BJ, Leemans CR, Brakenhoff RH: Using tissue adjacent to
carcinoma as a normal control: an obvious but questionable practice. J
Pathol 2004, 203:620-621.
17. Braakhuis BJ, Tabor MP, Kummer JA, Leemans CR, Brakenhoff RH: A genetic
explanation of Slaughter’s concept of field cancerization: evidence and
clinical implications. Cancer Res 2003, 63:1727-30.
18. Inamura K, Fujiwara T, Hoshida Y, Isagawa T, Jones MH, Virtanen C,
Shimane M, Satoh Y, Okumura S, Nakagawa K, Tsuchiya E, Ishikawa S,
Aburatani H, Nomura H, Ishikawa Y: Two subclasses of lung squamous cell
carcinoma with different gene expression profiles and prognosis
identified by hierarchical clustering and non-negative matrix
factorization. Oncogene 2005, 24:7105-13.
19. Kuner R, Muley T, Meister M, Ruschhaupt M, Buness A, Xu EC, Schnabel P,
Warth A, Poustka A, Sültmann H, Hoffmann H: Global gene expression
analysis reveals specific patterns of cell junctions in non-small cell lung
cancer subtypes. Lung Cancer 2009, 63:32-8.
20. Kim B, Lee HJ, Choi HY, Shin Y, Nam S, Seo G, Son DS, Jo J, Kim J, Lee J,
Kim J, Kim K, Lee S: Clinical validity of the lung cancer biomarkers
identified by bioinformatics analysis of public expression data. Cancer
Res 2007, 67:7431-8.
21. Schwarte-Waldhoff I, Klein S, Blass-Kampmann S, Hintelmann A, Eilert C,
Dreschers S, Kalthoff H, Hahn SA, Schmiegel W: DPC4/SMAD4 mediated
tumor suppression of colon carcinoma cells is associated with reduced
urokinase expression. Oncogene 1999, 18:3152-3158.
Watanabe et al. Cancer Cell International 2010, 10:2
/>Page 11 of 12
22. Muller N, Reinacher-Schick A, Baldus S, van Hengel J, Berx G, Baar A, van
Roy F, Schmiegel W, Schwarte-Waldhoff I: Smad4 induces the tumor
suppressor E-cadherin and P-cadherin in colon carcinoma cells.
Oncogene 2002, 21:6049-6058.
23. Caswell PT, Spence HJ, Parsons M, White DP, Clark K, Cheng KW, Mills GB,
Humphries MJ, Messent AJ, Anderson KI, McCaffrey MW, Ozanne BW,
Norman JC: Rab25 associates with alpha5beta1 integrin to promote
invasive migration in 3D microenvironments. Dev Cell 2007, 13:496-510.
24. Singer S, Malz M, Herpel E, Warth A, Bissinger M, Keith M, Muley T,
Meister M, Hoffmann H, Penzel R, Gdynia G, Ehemann V, Schnabel PA,
Kuner R, Huber P, Schirmacher P, Breuhahn K: Coordinated expression of
stathmin family members by far upstream sequence element-binding
protein-1 increases motility in non-small cell lung cancer. Cancer Res
2009, 69:2234-2243.
25. Basu GD, Azorsa DO, Kiefer JA, Rojas AM, Tuzmen S, Barrett MT, Trent JM,
Kallioniemi O, Mousses S: Functional evidence implicating S100P in
prostate cancer progression. Int J Cancer 2008, 123:330-339.
26. Mangala LS, Arun B, Sahin AA, Mehta K: Tissue transglutaminase-induced
alterations in extracellular matrix inhibit tumor invasion. Mol Cancer 2005,
4:33.
27. Ai L, Kim WJ, Demircan B, Dyer LM, Bray KJ, Skehan RR, Massoll NA,
Brown KD: The transglutaminase 2 gene (TGM2), a potential molecular
marker for chemotherapeutic drug sensitivity, is epigenetically silenced
in breast cancer. Carcinogenesis 2008, 29:510-518.
28. Nikolova DA, Asangani IA, Nelson LD, Hughes DP, Siwak DR, Mills GB,
Harms A, Buchholz E, Pilz LR, Manegold C, Allgayer H: Cetuximab
attenuates metastasis and u-PAR expression in non-small cell lung
cancer: u-PAR and E-cadherin are novel biomarkers of cetuximab
sensitivity. Cancer Res 2009, 69:2461-2470.
29. Rana S, Maples PB, Senzer N, Nemunaitis J: Stathmin 1: a novel
therapeutic target for anticancer activity. Expert Rev Anticancer Ther 2008,
8:1461-1470.
30. Bartling B, Rehbein G, Schmitt WD, Hofmann HS, Silber RE, Simm A:
S100A2-S100P expression profile and diagnosis of non-small cell lung
carcinoma: impairment by advanced tumour stages and neoadjuvant
chemotherapy. Eur J Cancer 2007, 43:1935-1943.
31. Diederichs S, Bulk E, Steffen B, Ji P, Tickenbrock L, Lang K, Zänker KS,
Metzger R, Schneider PM, Gerke V, Thomas M, Berdel WE, Serve H, Müller-
Tidow C: S100 family members and trypsinogens are predictors of
distant metastasis and survival in early-stage non-small cell lung cancer.
Cancer Res 2004, 64:5564-5569.
32. Offersen BV, Pfeiffer P, Andreasen P, Overgaard J: Urokinase plasminogen
activator and plasminogen activator inhibitor type-1 in nonsmall-cell
lung cancer: relation to prognosis and angiogenesis. Lung Cancer 2007,
56:43-50.
33. Watanabe T, Tanaka G, Hamada S, Namiki C, Suzuki T, Nakajima M,
Furihata C: Dose-dependent alterations in gene expression in mouse
liver induced by diethylnitrosamine and ethylnitrosourea and
determined by quantitative real-time PCR. Mutat Res 2009, 673:9-20.
doi:10.1186/1475-2867-10-2
Cite this article as: Watanabe et al.: Comparison of lung cancer cell lines
representing four histopathological subtypes with gene expression
profiling using quantitative real-time PCR. Cancer Cell International 2010
10:2.
Publish with BioMed Central and every
scientist can read your work free of charge
"BioMed Central will be the most significant development for
disseminating the results of biomedical research in our lifetime."
Sir Paul Nurse, Cancer Research UK
Your research papers will be:
available free of charge to the entire biomedical community
peer reviewed and published immediately upon acceptance
cited in PubMed and archived on PubMed Central
yours — you keep the copyright
Submit your manuscript here:
/>BioMedcentral
Watanabe et al. Cancer Cell International 2010, 10:2
/>Page 12 of 12