Tài liệu Báo cáo khoa học: A strategy for discovery of cancer glyco-biomarkers in serum using newly developed technologies for glycoproteomics ppt
Bạn đang xem bản rút gọn của tài liệu. Xem và tải ngay bản đầy đủ của tài liệu tại đây (635.9 KB, 11 trang )
REVIEW ARTICLE
A strategy for discovery of cancer glyco-biomarkers
in serum using newly developed technologies for
glycoproteomics
Hisashi Narimatsu, Hiromichi Sawaki, Atsushi Kuno, Hiroyuki Kaji, Hiromi Ito and Yuzuru Ikehara
Research Center for Medical Glycoscience (RCMG), National Institute of Advanced Industrial Science and Technology (AIST), Tsukuba, Japan
Introduction
Aberrant glycosylation has been known to be associ-
ated with various human diseases, particularly with
cancer, for many years. However, the discovery of
aberrant modifications often depends on serendipity,
and the biological significance of these disease-related
glycosylation patterns is revealed only gradually. To
facilitate this process by more systematic approaches,
we initiated a three-tiered project approximately 9 years
ago with the sponsorship of New Energy and Industrial
Technology Development Organization of the Japanese
government. The first project, named the Glycogene
Project (2001–2004), was focused on a better under-
standing of the molecular basis of glycosylation in
humans. By using bioinformatics technologies, we iden-
tified approximately new 100 glycogene candidates. Of
these, 24 were confirmed to be glycogenes, and we con-
structed a human glycogene library consisting of 183
genes related to glycosylation and glycan synthesis
Keywords
biomarker; glycan MS; glyco-biomarker;
glycogene; glycomics; glycoproteomics;
IGOT; JCGGDB; lectin microarray; qPCR
array
Correspondence
H. Narimatsu, Research Center for Medical
Glycoscience, National Institute of Advanced
Industrial Science and Technology (AIST),
1-1-1 Umezono, Tsukuba, Ibaraki 305-8568,
Japan
Fax: +81 298 861 3191
Tel: +81 298 861 3200
E-mail:
(Received 24 June 2009, Revised
7 September 2009, accepted 9 October
2009)
doi:10.1111/j.1742-4658.2009.07430.x
Detection of cancer at early stages that can be treated through surgery is a
difficult task. One methodology for cancer biomarker discovery exploits
the fact that glycoproteins produced by cancer cells have altered glycan
structures, although the proteins themselves are common, ubiquitous,
abundant, and familiar. However, as cancer tissue at the early stage proba-
bly constitutes less than 1% of the normal tissue in the relevant organ,
only 1% of the relevant glycoproteins in the serum should have altered gly-
can structures. Here, we describe our strategy to approach the detection of
these low-level glycoproteins: (a) a quantitative real-time PCR array for
glycogenes to predict the glycan structures of secreted glycoproteins; (b)
analysis by lectin microarray to select lectins that distinguish cancer-related
glycan structures on secreted glycoproteins; and (c) an isotope-coded glyco-
sylation site-specific tagging high-throughput method to identify carrier
proteins with the specific lectin epitope. Using this strategy, we have identi-
fied many glycoproteins containing glycan structures that are altered in
cancer cells. These candidate glycoproteins were immunoprecipitated from
serum using commercially available antibodies, and their glycan alteration
was examined by a lectin microarray. Finally, they were analyzed by multi-
stage tandem MS.
Abbreviations
AAL, Aleuria aurantia lectin; AFP, a-fetoprotein; GGDB, GlycoGene Database; GlycoProtDB, GlycoProtein Database; GMDB, Glycan Mass
Spectral Database; HCC, hepatocellular carcinoma; HV, healthy volunteer; IGOT, isotope-coded glycosylation site-specific tagging; JCGGDB,
Japan Consortium for Glycobiology and Glycotechnology Database; LC ⁄ MS, liquid chromatography/mass spectrometry; LCA, Lens culinaris
agglutinin; LfDB, Lectin Frontier Database; MS
n
, multistage tandem MS; PNGase, N-glycanase; qPCR, quantitative PCR; RCA120,
Ricinus communis agglutinin 120.
FEBS Journal 277 (2010) 95–105 ª 2009 The Authors Journal compilation ª 2009 FEBS 95
pathways [1]. Knowledge of the substrate specificities of
these gene products allowed us to better understand the
molecular basis of human glycosylation.
The second project was named the Structural Glyco-
mics Project (2003–2006); in this project, we developed
two technologies for highly sensitive and high-through-
put glycan structural analysis, i.e. a strategy for the
identification of oligosaccharide structures using obser-
vational multistage mass spectral libraries [2], and an
evanescent-field fluorescence-assisted lectin microarray
for glycan profiling [3]. Taking full advantage of our
glycogene library and detailed information regarding
the substrate specificities of the gene products, we
developed a glycan library that was then used as a
standard to develop instruments for glycan structural
analysis, such as a mass spectrometer-based glycan
sequencer and lectin microarray-based glycan profiler.
In 2006, we launched a new project termed the Med-
ical Glycomics project. Our aims in the project are
two-fold: (a) the development of discovery systems for
disease-related glyco-biomarkers; and (b) functional
analysis of glycosylation associated with diseases.
Armed with our knowledge of human glycosylation,
glycan structural analysis systems, the bioinformatics
capability and the databases that we have developed
over the years, and animal models of aberrant glyco-
sylation and clinical samples, we are now pursuing this
goal. Here, we report our cancer glyco-biomarker dis-
coveries made using the technologies that we have
developed in past projects.
Construction of databases as
useful tools for glycomics and
glycoproteomics research
The results of two past projects concerning the identifi-
cation of genes involved in glycosylation and glycan
synthesis and the development of bioinformatic tools
for their study have been made publicly available as
the Japan Consortium for Glycobiology and Glyco-
technology Database (JCGGDB: />index_en.html). The JCGGDB includes four subdata-
bases: the GlycoGene Database (GGDB), the Lectin
Frontier Database (LfDB), the GlycoProtein Database
(GlycoProtDB), and the Glycan Mass Spectral Data-
base (GMDB).
The GGDB ( />provides users with easy access to information on glyc-
ogenes. In the GGDB, the information on each glyco-
gene is stored in XML format: gene names (gene
symbols), enzyme names, DNA sequences, tissue distri-
bution (gene expression), substrate specificities, homol-
ogous genes, EC numbers, and external links to
various databases. The database also includes graphic
information on substrate specificities, etc.
The LfDB ( />codb/LectinSearch) provides quantitative interaction
data in terms of the affinity constants (K
a
) of a series
of lectins for a panel of pyridylaminated glycans
obtained by automated frontal affinity chromatogra-
phy with a fluorescence detection system. As the data
are accurate and reliable, providing the absolute values
of sugar–protein interactions, the LfDB is a valuable
resource in studies of glycan-related biology.
The GlycoProtDB ( />glycodb/Glc_ResultSearch) is a searchable database
providing information on N-glycoproteins that have
been identified experimentally from Caenorhabditis
elegans N2 and mouse tissues (strain C52BL ⁄ 6J, male),
as described previously [4]. In the initial phase of
this database, we have included a full list of N-glycopro-
teins from C. elegans and a partial list from mouse liver
containing the protein (gene) ID, protein name, glycosy-
lated sites, and kinds of lectins used to capture glyco-
peptides. In the next phase, we will provide additional
data for other tissues of the mouse, such as those of the
brain, kidney, lung, and testis, and extend the variety of
lectin columns used to capture glycopeptides.
The GMDB ( />codb/Ms_ResultSearch) offers a novel tool for glyco-
mics research, as it enables users to identify glycans
very easily and quickly by spectral matching. We are
constructing a multistage tandem MS (MS
n
) spectral
database using a variety of structurally defined gly-
cans, some of which were prepared using glyco-
syltransferases in vitro [1,2,5]. The GMDB currently
stores collision-induced dissociation spectra (i.e. MS
2
,
MS
3
and MS
4
spectra) of N-glycans, O-glycans, and
glycolipid glycans, as well as the partial structures of
these glycans. O-glycans were converted to their corre-
sponding alditols before MS acquisition. The other
types of glycan stored in the GMDB are mostly tagged
with 2-aminopyridine, which can be used for fluo-
rescence detection in HPLC. MS
n
spectra of glycans
containing sialic acids were acquired after methylesteri-
fication of sialic acid moieties. All spectra were
obtained in the positive ion mode using MALDI–
quadrupole ion trap (QIT)-TOF MS.
A strategy for discovery of cancer
glyco-biomarkers
On the basis of the technologies that we developed, we
designed a strategy for high-throughput discovery of
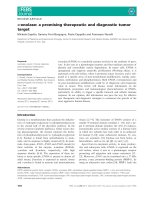
cancer glyco-biomarkers. As seen in Fig. 1, cultured
cancer cells were first examined with two technologies.
Discovery of cancer glyco-biomarkers H. Narimatsu et al.
96 FEBS Journal 277 (2010) 95–105 ª 2009 The Authors Journal compilation ª 2009 FEBS
First, their mRNAs were extracted, and expression
was measured by a quantitative real-time PCR (qPCR)
method (shown as stage I in Fig. 1). The qPCR results
suggested that different glycan structures were synthe-
sized in different cell lines. Secreted proteins from the
same cancer cells were collected from serum-free cul-
ture and then applied to a lectin microarray to select
lectin(s) that showed differential binding to glycopro-
teins secreted from each cancer cell line (stage II).
After selection of a specific lectin, we employed the
isotope-coded glycosylation site-specific tagging
(IGOT) method to identify a large number of cancer
biomarker candidates, i.e. core proteins that carry an
epitope bound by a specific lectin (stage III). The
abundance of each glycoprotein in serum was esti-
mated by IGOT using Ricinus communis agglutinin 120
(RCA120), which binds to a ubiquitous N-glycan epi-
tope. Each candidate was immunoprecipitated from
serum using commercially available antibodies (stage
IV), and their glycan structures were profiled by lectin
microarray, and finally determined by MS
n
technology
(stage V). Below, we describe in detail each stage in
this process.
Establishment of a qPCR method for
the measurement of 186 human
glycogenes
We began by performing a comprehensive study of
human glycogenes, which encode proteins involved in
glycan synthesis and modification [1]. Almost all
human glycogenes have been cloned and are listed in
the GGDB, including those encoding glycosyltransfe-
rases, sulfotransferases, and sugar–nucleotide trans-
porters. The cDNA clones of glycogenes were used as
reference templates for qPCR analysis in the experi-
ments. To improve the throughput of qPCR measure-
ments, we built a customized qPCR array platform for
glycogene expression profiling. The qPCR array con-
sists of probes and primer sets for measuring 186 gene
mRNAs, and enabled the determination of expression
profiles for the 186 glycogenes in a single assay. The
reference templates enabled construction of calibration
curves across the 186 genes with threshold values, dis-
tinguishing signals that arise from actual amplification
from arising from nonspecific amplification.
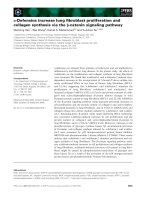
As demonstrated in Fig. 2, glycogene expression was
analyzed in two colorectal cancer cell lines, SW480 [6]
and COLO 205 [7], by the qPCR array, and then com-
pared with the results of DNA microarray measure-
ments reported in the GEO database (http://
www.ncbi.nlm.nih.gov/geo/). Using qPCR, we were
able to accurately quantitate genes with very low
expression levels. In contrast, the DNA microarray
results were much less accurate. Our qPCR array
results indicated that 44 genes had at least a 10-fold
difference in expression between the two cell lines. In
contrast, 42 genes were identified as being differentially
expressed by the DNA microarray, but only when the
threshold was decreased to include those showing at
least a two-fold difference. Furthermore, DNA micro-
array analysis missed 15 genes that exhibited more
I
II
III
IV
V
Fig. 1. Strategy for cancer glyco-biomarker
discovery. The roman numbers indicate the
stages described in ‘A strategy for discovery
of cancer glyco-biomarkers’.
H. Narimatsu et al. Discovery of cancer glyco-biomarkers
FEBS Journal 277 (2010) 95–105 ª 2009 The Authors Journal compilation ª 2009 FEBS 97
than a 10-fold change by qPCR analysis. False discov-
ery problems with microarrays are well known [8], but
our results highlighted the potential issues of false-neg-
ative results. In contrast to DNA microarray analysis,
qPCR provides both sensitivity and accuracy for
studying glycogenes. We have been able to increase the
measurement throughput to three unknown samples
per day without loss of sensitivity or accuracy.
Our qPCR array system determines expression pro-
files of cells as transcript copy numbers. In our system,
we can roughly estimate that the total RNA in a single
reaction well is derived from 1000 cells; in various cell
lines, the mean copy number for the measured tran-
scripts over the 186 glycogenes was several thousand.
Thus, across the 186 glycogenes, the mean copy num-
ber was less than 10 per cell. A considerable fraction of
the glycogenes are expressed as rare transcripts, with
less than one transcript per single cell, shown in Fig. 2
as results below 1000 copies. In our cells, the products
of the glycogenes, transferases and transporters, are
localized in the Golgi apparatus and⁄ or endoplasmic
reticulum, where they synthesize glycans on proteins
and lipids [9]. As they are concentrated in a small
space, it is likely that a small amount of enzyme may
be sufficient to effect large changes in glycan structures.
Also, the glycogene regulation at a low level of expres-
sion would be expected to affect the frequency of
glycan structural alteration in cells. For example, in
the hepatic cell line HuH-7, rare transcripts of the
B4GALNT3 gene are responsible for synthesis of a
specific glycan structure, termed the LacdiNAc moiety,
on glycoproteins [10]. From the results of the qPCR
measurements, we can further explore glycan alteration
during malignant transformation.
Lectin microarray – a powerful
technology for selection of lectins
for cancer glyco-biomarkers
The lectin microarray system is an emerging technique
for analyzing glycan structures. This method is based
on the concept of glycan profiling, and utilizes lectins,
a group of glycan-discriminating proteins. In general,
however, the glycan–lectin interaction is relatively
weak in comparison with, for example, antigen–anti-
body interactions. Thus, once bound to a lectin on an
array, some glycans may dissociate during the washing
process, and this often results in a significant reduction
in the signal intensity. Unfortunately, most conven-
tional microarray scanners require the washing pro-
cess. To circumvent this problem, Hirabayashi et al.
[3] previously developed a unique lectin microarray
based on the principle of evanescent-field fluorescence
detection (Fig. 3A). Furthermore, they succeeded in
improving the array platform analysis to achieve the
highest sensitivity reported to date (the limit of detec-
tion is 10 pg of protein for assay) [11].
COLO 205
SW480
1 10 100 1000 10 000 100 000
1
10
100
1000
10
000
10
0000
mRNA copy number
mRNA copy number
0
0
10-fold
change
10-fold
change
qPCR array
Relative unit
Relative unit
COLO 205
SW480
1 10 100 1000 10 000
1
10
100
1000
10
000
A
B
2-fold
change
2-fold change
DNA microarray
Fig. 2. Glycogene expression levels in two colorectal cancer cell
lines. SW480 and COLO 205 were compared with two analytical
methods, DNA microarray (A) and qPCR array (B). (A) Each box rep-
resents the expression signal due to each probe for glycogene on a
GeneChip Human Genome U133 Plus 2.0 Array (Affymetrix). Values
of glycogene expression levels were extracted from the GSE8332
dataset in the GEO database [39]. Raw data were normalized by
the RMA method [40], using the
JUSTRMA METHOD OF AFFY package in
R [41]. Forty-two genes showed differential expression, with two-
fold or higher increases. Open boxes indicate probes for genes that
were unevenly expressed in cells analyzed with the qPCR array. (B)
Boxes represent transcript copy number of glycogenes in 7.5 ng of
total RNA, measured by qPCR array. Genes with differential or
uneven expression are indicated by open boxes.
Discovery of cancer glyco-biomarkers H. Narimatsu et al.
98 FEBS Journal 277 (2010) 95–105 ª 2009 The Authors Journal compilation ª 2009 FEBS
As mentioned above, changes in glycosylation pat-
terns correlate well with alterations in the gene expres-
sion of individual glycosyltransferases in carcinogenesis
and oncogenesis, as well as in cell differentiation and
proliferation. Therefore, it is quite possible, by means
of differential profiling, to identify aberrant cell surface
glycans. Owing to its extremely high sensitivity and
accuracy, the lectin microarray system is the best tool
for a ‘cell profiler’, and it is expected to be applicable
for selection of cancer-specific lectins and for quality
control of stem cells before transplantation [12–15].
Recently, we have constructed systematic manipulation
protocols for these approaches, including methods for
the preparation of fluorescently labeled glycoproteins
from only 10 000 cells and data-mining procedures
[16]. Furthermore, we developed a methodology for
differential glycan analysis targeting restricted areas of
tissue sections (Fig. 3B) [17], which is sufficient to
detect glycoproteins from approximately 1000 cells
derived from tissue sections (1.0 mm
2
and 5 lmin
thickness). With this system, cancer-related glycan
alterations can be clearly detected as signal differences
in appropriate lectins on the array (Fig. 3B).
To date, we have accumulated datasets of cell glycan
profiles for 80 different cancer cell lines. The obtained
datasets could be statistically compared to identify
lectins that show significant differences between cell
types. For example, supernatants from liver cancer
cells, such as HuH-7 [hepatocellular carcinoma (HCC)]
[18] and HepG2 (hepatoblastoma) [19] cells, showed
differential signals with Aleuria aurantia lectin (AAL),
which binds fucose [10]. The resultant AAL was then
used as a probe for lectin affinity chromatography to
capture glycopeptides with aberrant fucosylation in
HCC cells prior to comprehensive analysis with IGOT
technology to identify glyco-biomarker candidates.
Evanescent-field
fluorescence detection scanner
Cancer Normal
Step 2
Step 3
Step 4
Cancer
Normal
Step 1
Ex.
light
A
BC
Fig. 3. A schematic for glycan profiling using the lectin microarray. (A) A highly sensitive glycan profiler lectin microarray system on the
basis of an evanescent-field fluorescence detection scanner. The fluorescence-labeled glycoproteins binding to the lectins immobilized on
the glass slide were selectively detected with the aid of an evanescent wave (the area within 200 nm from the glass surface). The experi-
mental process of the glycan profiling consists of four steps, as follows: step 1, sample preparation; step 2, binding reaction; step 3, array
scanning; and step 4, data processing and analysis. Differential glycan profiling between cancer and normal cells enables identification of
aberrant glycosylation in cancer [indicated as a red triangle in (B) and (C)] as an alteration in lectin signal pattern. According to the purpose of
the analysis, we used different detection methods, i.e. a direct fluorescence-labeling method (B) or an antibody-assisted fluorescence-label-
ing method (C). For differential analysis among the supernatants from cancer cell lines, we used the former method. In this case, an analyte
glycoprotein should be labeled with Cy3 before the binding reaction. Alternatively, the binding reaction was visualized by overlaying a fluo-
rescently labeled detection antibody against the core protein moiety of the target glycoprotein; this is especially useful for verification of
glyco-biomarker candidates.
H. Narimatsu et al. Discovery of cancer glyco-biomarkers
FEBS Journal 277 (2010) 95–105 ª 2009 The Authors Journal compilation ª 2009 FEBS 99
Determination of core proteins with
the specific lectin epitope by the IGOT
method
In order to identify core proteins modified with specific
glycans, glycoproteomic approaches coupled with
lectin-mediated affinity capture for glycopeptides and
followed by liquid chromatography/mass spectrometry
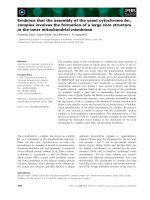
(LC ⁄ MS) can be used [4]. The IGOT method for
glycoproteomic analysis was developed by Kaji et al.
(Fig. 4) [20]. In this method, protein mixtures derived
from cells, tissues and culture supernatants are
digested with trypsin to generate peptides and glyco-
peptides, and the glycopeptides are then captured and
isolated by lectin affinity chromatography. They are
more extensively purified by hydrophilic interaction
chromatography, followed by N-glycanase (PNGase)
digestion in the presence of stable isotope-labeled
water, H
2
18
O. During this digestion, the asparagine
carrying the N-glycan is converted to aspartic acid,
with concomitant incorporation of
18
O and release of
the glycan. Finally, these
18
O-tagged peptides are
identified by LC ⁄ MS [21]. This technology yields
high-throughput identification, and provides a list of
hundreds of candidate glyco-biomarkers with their sites
of N-glycosylation within approximately 1 week. Thus,
this method allows reliable identification of core N-gly-
cosylated proteins in a high-throughput manner, as the
N-glycan binding site is labeled with
18
O in the peptide
[4,20]. However, if the modification is an O-glycosyla-
tion, the method is more difficult, as there is no glyco-
sidase to release the O-glycan from the modified
peptides. Although the specifically modified peptide is
not easily identified by the IGOT method, sequences
from nonglycosylated peptides are observed, allowing
identification of the core domain. Then, it is necessary
to confirm that the protein has the target O-glycosyla-
tion by an alternative method, although it remains
difficult to confirm the O-glycan attachment site.
Using the IGOT method, we first attempted to iden-
tify serobiomarkers for HCC, in view of the known
pathological changes of hepatic cells, i.e. chronic hepa-
titis and hepatic cirrhosis. We selected AAL as a probe
for the capture of fucosylated glycans, according to
the results of the glycogene expression profile described
above. Starting from their culture media, AAL-bound
glycopeptides were identified by IGOT-LC ⁄ MS; at the
same time, AAL-bound glycopeptides were collected
and identified from the sera of HCC patients and
healthy volunteers (HVs). Glyco-biomarker candidates
were selected by comparison of these glycoprotein
profiles (Fig. 5). We identified about 180 AAL-bound
-Asn-Xaa-[Ser/Thr]-
O
NH
H-
-O H
-Asp-Xaa-[Ser/Thr]-
O
H-
-OH
OH
18
MS
MS/M S
CI D
m/ z
m/ z
Identification of core proteins
Databas e search
Sample protein mixture (e.g., serum & culture medium)
Peptide pool
Reduction & S -alkylation
Protease digestion
Lectin column
HI C
PNGase
H O
2
18
LC/MS/MS
Isotope-coded glycoslation site-specific tagging (IGOT)
N-Glycopeptides
O-labeled peptides
18
Fig. 4. Outline of the IGOT-LC ⁄ MS method. The sample protein mixture is digested with a protease such as trypsin to prepare a peptide
pool. Glycopeptides are captured with a probe lectin column from the pool, and followed by hydrophilic interaction chromatography (HIC).
Purified glycopeptides are treated with PNGase in
18
O-labeled water to remove the glycan moiety and label the glycosylation asparagine with
the stable isotope,
18
O. The labeled peptides are identified by LC ⁄ MS analysis.
Discovery of cancer glyco-biomarkers H. Narimatsu et al.
100 FEBS Journal 277 (2010) 95–105 ª 2009 The Authors Journal compilation ª 2009 FEBS
glycoproteins from the culture media and HCC patient
sera. Of these, 60 proteins were discarded, as they
were also identified from the sera of HVs. To estimate
the abundance of the remaining candidates in serum,
glycopeptides containing common serum glycans,
namely sialylated bianntenary glycans, were captured
with RCA120 after bacterial sialidase treatment, and
then identified by IGOT-LC ⁄ MS analysis. RCA120
binds to the Galb1–4GlcNAc (LacNAc) structure,
which is a ubiquitous N-glycan epitope. Therefore, the
frequency of peptide identification following RCA120
capture is considered to be associated with the level of
abundance. Among the remaining 120 candidates,
about half were also observed in the RCA120-bound
fraction, and included a-fetoprotein (AFP) (probably
the AFP-L3 fraction) and Golgi phosphoprotein
GP73, which are known to be HCC markers [22,23].
These results strongly indicate that this approach
would be successful for the identification of glyco-
biomarkers. Thus, we were able to identify nearly 65
candidate fucosylated glyco-biomarkers for liver
cancer. We next proceeded to examine whether these
candidates would be useful for clinical diagnosis.
Verification of glyco-alteration in
candidate glycoproteins to determine
clinical utility
After the identification of numerous candidate glyco-
proteins with cancer-associated glyco-alterations, it
was necessary to confirm their usefulness by differen-
tial analysis of 100 or more clinical samples. This step
required a reliable glyco-technology to analyze the
samples in a high-throughput manner. Furthermore, in
many cases, the concentrations of the serum glyco-
proteins with cancer-associated glyco-alterations are
considered to be extremely low, as observed for
Lens culinaris agglutinin (LCA) lectin-binding AFP
(the so-called AFP-L3 fraction), which represents 30%
of 10–100 ngÆmL
)1
AFP in HCC patients. However,
there had been no highly sensitive, reliable system for
differential glycan analysis of a target glycoprotein. To
overcome this challenge, Kuno et al. [24] recently
developed a focused differential glycan analysis system
with antibody-assisted lectin profiling (Fig. 3C). In this
system, 100 ng or less of each candidate is immunopre-
cipitated from serum using an antibody against the
core protein moiety of the candidate glycoprotein (Step
1 in Fig. 3C). The enriched glycoprotein can then be
quantified by western blotting, and a small portion of
the eluate can subsequently be directly applied to a lec-
tin microarray (Step 2 in Fig. 3C). After incubation
with the lectin microarray, bound glycoproteins were
detected using the specific antibody (Step 3 in Fig. 3C).
The resultant microarray data were used to validate
the glyco-alteration and select the best lectin for cancer
diagnosis. This antibody-assisted lectin profiling
method has several advantages that make it a versatile
technology: (a) the target protein does not need to be
highly purified, because each lectin signal is observed
only through the contribution of the detection anti-
body; (b) specific signals corresponding to the target
glycoprotein glycans can be obtained at nanogram lev-
els; (c) the target glycoproteins can be detected in a
rapid, reproducible and high-throughput manner; and
(d) statistical analysis of lectin signals makes it possible
to select an optimal lectin–antibody set and facilitates
construction of a sandwich assay for glyco-marker
validation.
Confirmation of glycan structure using
MS
n
technology
Analytical difficulties in the analysis of glycan struc-
tures arise primarily from their structural complexity,
which includes variation in branching, linkage, and ste-
reochemistry. Recently, identification of the detailed
glycan structures on glycoproteins has been performed
using MS
n
-based analytical methods. In MS analysis,
it is important that a suitable derivatization method is
selected, as the ionization efficiency of glycans (espe-
cially sialylated or sulfated glycans) is generally low.
Therefore, glycans are typically derivatized by perme-
Fig. 5. Selection of glyco-biomarker candidates by comparison of
glycoprotein profiles for further validation. Glycoproteins identified
from the sera of HCC patients and culture media of hepatoma cells
(HepG2 and HuH-7) with the probe lectin, AAL, are compared with
those found in the sera of HVs. Overlapping proteins are removed
from the candidates. The profiles are then compared with those of
RCA120. Overlapping proteins appearing in the dark gray area of
the Venn diagram are thought to be relatively abundant in serum,
and are primary candidates for further validation. Glycoproteins
found in the pale gray area are secondary candidates that are
thought to be less abundant in serum and therefore more challeng-
ing to study.
H. Narimatsu et al. Discovery of cancer glyco-biomarkers
FEBS Journal 277 (2010) 95–105 ª 2009 The Authors Journal compilation ª 2009 FEBS 101
thylation [25], by methylesterification of sialic acids
[26] or by reducing end-labeling [27,28] before MS
analysis, in order to ensure the highest sensitivity.
Many analytical technologies are being developed to
facilitate the structural analysis of glycans. In general,
the current principal technologies in use are: (a)
de novo sequencing; (b) glycan mass fingerprinting [29];
and (c) MS
n
spectral matching [2,30–32]. Determina-
tion of glycan structures using the first two methods is
driving the development of better tools for glycan
analysis by MS
n
techniques.
We are currently building a spectral library of gly-
can structures by measuring MS
n
spectra of a variety
of glycans, as glycans or glycopeptides with various
structures can be synthesized in vitro by using specific
enzymes [1,2,5]. MS
n
experiments have revealed that
different glycan structures give rise to distinct frag-
mentation patterns in collision-induced dissociation
spectra. Therefore, structural assignment of the com-
plicated glycans can be performed by using MS
n
spectral libraries without the need for detailed identifi-
cation of fragment ions. Indeed, we have previously
demonstrated the application of this method to the
determination of the glycan structure of a form of
AFP [10]. However, identification of the details of a
glycan structural change on a glycoprotein is limited,
as a comparatively large amount of a relatively homo-
geneous sample of the target glycoprotein is required.
To facilitate the preparation of the sample, an anti-
body with good specificity and strong affinity is
required for immunoprecipitation and purification.
With the present MS technology, approximately 1 lg
of glycoprotein is the minimum required for analysis
of the glycan structure [2,10]. Thus, it still remains
challenging to determine the glycan structures of glyco-
proteins present in serum at low levels, although struc-
tural analysis of glycans from cultured cells is more
feasible [10]. As there is no universal method for the
rapid and reliable identification of glycan structure,
research goals must dictate the best method or combi-
nation of methods for analysis.
The four technologies for glycomics and glycopro-
teomics have various advantages and disadvantages.
The lectin microarray has the highest sensitivity, with
only 1000 cells being required to obtain glycan pro-
files. In contrast, MS analysis for glycan identification
requires more than 10
7
cells. However, the final deter-
mination of glycan structure can only be performed
by MS
n
experiments. IGOT-LC ⁄ MS can be utilized
for the discovery of candidate glycoproteins in a
high-throughput manner. Finally, the qPCR method
is useful to confirm predicted alterations in glycan
structures.
Future challenges in the discovery of
glyco-biomarkers
Our ultimate goal is the discovery of cancer glyco-
biomarkers with high sensitivity and specificity that are
useful for clinical diagnosis. However, sensitivity and
specificity are often contrasting properties; that is, the
more sensitive marker usually shows less specificity.
Cancer cells grow with the help of cancer-associated
stromal cells, such as vascular endothelial cells, infil-
trating inflammatory cells, bone marrow-derived cells,
and myofibroblasts [33,34]. Such stromal cells are diffi-
cult to distinguish from those involved in wound heal-
ing and inflammation. In association with cancer
growth, the stromal cells grow and expand to release
many glycoproteins into serum. Thus, serum derived
from patients with advanced cancers often contains
complicated protein patterns that are not directly
related to cancer cells. We believe, then, that it is quite
difficult to identify true cancer glyco-biomarkers in
such a complex mixture. For this reason, we begin our
experiments with cultured cancer cells and cancer
tissues obtained by microdissection. Unfortunately,
researchers often analyze the serum of patients with
advanced cancer without paying much attention to the
histopathological status. It is easy to find markers that
differentiate between healthy individuals and patients
with advanced cancer, but useful biomarkers may
make up less than 1% of the differential markers iden-
tified. In the case of liver cancer, for example, a human
liver weighs 1.5–2.0 kg on average. For early detec-
tion of liver cancer, the tumor should be diagnosed
when it is only 1.0–1.5 cm in diameter, representing
less than 1% of the whole liver weight. Thus, a cancer-
derived glycoprotein in which the glycan structure is
altered from that of noncancerous cells constitutes less
than 1% of the glycoprotein population. In our view,
then, to identify biomarkers with specificity, the pro-
teins must be produced by the cancer cells themselves,
and such glyco-biomarkers are present in serum at
very low levels.
An earlier study of liver cancer detection used a very
different approach to identify cancer glyco-biomarkers
[35,36]. The authors recovered all of the glycoproteins
from serum, released the N-glycans from the total
glycoprotein pool by PNGase digestion, and then
performed N-glycan profiling using MS. The study
compared the total N-glycans from sera of healthy
volunteers and liver cancer patients, and reported
dramatic differences in N-glycan profiles between these
two groups. However, it is well established that liver
cancer occurs through the process of chronic liver
inflammation followed by hepatic cirrhosis. Liver cancer
Discovery of cancer glyco-biomarkers H. Narimatsu et al.
102 FEBS Journal 277 (2010) 95–105 ª 2009 The Authors Journal compilation ª 2009 FEBS
appears near the end-stage of hepatic cirrhosis, at
which time many patients are suffering from loss of
liver function and malnutrition. Thus, comparison of
N-glycan changes in total serum glycoproteins between
HVs and liver cancer patients is likely to identify more
markers of liver function than cancer markers.
A challenge for future research is to increase the
sensitivity of assays for biomarkers, which is a key to
early detection. Currently, 1 lg of glycoprotein is
required to determine its N-glycan structure by MS
technology. Thus, it is currently impossible to discover
glyco-biomarkers in serum using MS. MS technology
is more useful for the determination of glycan struc-
tural changes. Previously, we were able to use MS to
determine the N-glycan structure of AFP produced by
cultured cells, because we could purify AFP in large-
scale culture [10]. To determine the N-glycan structure
of AFP from serum would require 100 mL of
serum, as the concentration is only about 10 ngÆmL
)1
.
In our strategy, we use one very sensitive and one
high-throughput technology, i.e. an evanescent-field
fluorescence detection lectin microarray and the IGOT
method, in place of MS analysis as a first approach to
address the sensitivity challenge. If a detection technol-
ogy with 10-fold higher sensitivity could be developed,
it would theoretically become possible to detect mark-
ers in one-tenth of the amount of cancer tissue that is
currently needed. As antibodies have the best specific-
ity and affinity of any protein–protein interaction stud-
ied thus far, our final goal is to develop detection kits
using simple sandwich assays. Although it is not so
difficult to produce a specific antibody against a
protein core, it is quite challenging to probe a specific
glycan structure. The binding affinity of lectins is
generally quite weak, which is a disadvantage for sensi-
tive detection of glycans. We foresee two possible ways
to solve this problem: the first is the development of
antibodies or other molecules that recognize specific
glycan structures; and the second is the amplification
of the signals that result from lectin binding to
increase their sensitivity.
The final challenge to be faced is the feasibility of
using biomarkers in the drug development process.
Incorporation of biomarkers into phase II clinical trial
studies has been widely accepted to improve the drug
development process, but they have not replaced
conventional clinical trial endpoints [37]. Indeed, any
biomarkers identified from either proteomic or glyco-
mics approaches have failed to generate robust clinical
endpoints, owing to their lack of specificity. In contrast,
the glycoprotein biomarkers identified by our strategy
may have the potential to be incorporated into phase
II clinical trials, because of their disease specificity.
Furthermore, the technology described in this review
may help to establish specific biomarkers for both can-
cer cells and stromal cells, helped by recent develop-
ments in our understanding of their pathobiological
function [38]. Thus, the tools presented here for glyco-
mics and glycoproteomics have the potential to pro-
vide a better understanding of how biomarkers can be
utilized in the clinic.
Acknowledgements
All the work described here, except for the develop-
ment of databases, was supported by New Energy and
Industrial Technology Development Organization of
the Ministry of Economy, Trades and Industry of the
Japanese government. The work of database construc-
tion is supported by the Integrated Database Project
of the Ministry of Education, Culture, Sports, Science
and Technology of the Japanese government.
References
1 Narimatsu H (2004) Construction of a human glyco-
gene library and comprehensive functional analysis.
Glycoconj J 21, 17–24.
2 Kameyama A, Kikuchi N, Nakaya S, Ito H, Sato T,
Shikanai T, Takahashi Y, Takahashi K & Narimatsu H
(2005) A strategy for identification of oligosaccharide
structures using observational multistage mass spectral
library. Anal Chem 77, 4719–4725.
3 Kuno A, Uchiyama N, Koseki-Kuno S, Ebe Y,
Takashima S, Yamada M & Hirabayashi J (2005)
Evanescent-field fluorescence-assisted lectin microarray:
a new strategy for glycan profiling. Nat Methods 2,
851–856.
4 Kaji H, Saito H, Yamauchi Y, Shinkawa T, Taoka M,
Hirabayashi J, Kasai K-i, Takahashi N & Isobe T
(2003) Lectin affinity capture, isotope-coded tagging
and mass spectrometry to identify N-linked glycopro-
teins. Nat Biotechnol 21, 667–672.
5 Ito H, Kameyama A, Sato T, Kiyohara K, Nakahara Y
& Narimatsu H (2005) Molecular-weight-tagged
glycopeptide library: efficient construction and
applications. Angewandte Chemie (Int Ed) 44, 4547–
4549.
6 Fogh J, Wright W & Loveless J (1977) Absence of
HeLa cell contamination in 169 cell lines derived from
human tumors. J Natl Cancer Inst 58, 209–214.
7 Semple T, Quinn L, Woods L & Moore G (1978)
Tumor and lymphoid cell lines from a patient with
carcinoma of the colon for a cytotoxicity model. Cancer
Res 38, 1345–1355.
8 Schmittgen T (2001) Real-time quantitative PCR.
Methods 25, 383–385.
H. Narimatsu et al. Discovery of cancer glyco-biomarkers
FEBS Journal 277 (2010) 95–105 ª 2009 The Authors Journal compilation ª 2009 FEBS 103
9 Kikuchi N & Narimatsu H (2006) Bioinformatics for
comprehensive finding and analysis of glycosyltransfe-
rases. Biochim Biophys Acta 1760, 578–583.
10 Ito H, Kuno A, Sawaki H, Sogabe M, Ozaki H,
Tanaka Y, Mizokami M, Shoda J-I, Angata T, Sato T
et al. (2009) Strategy for glycoproteomics: identification
of glyco-alteration using multiple glycan profiling tools.
J Proteome Res 8, 1358–1367.
11 Uchiyama N, Kuno A, Tateno H, Kubo Y, Mizuno M,
Noguchi M & Hirabayashi J (2008) Optimization of
evanescent-field fluorescence-assisted lectin microarray
for high-sensitivity detection of monovalent oligosac-
charides and glycoproteins. Proteomics 8, 3042–3050.
12 Ebe Y, Kuno A, Uchiyama N, Koseki-Kuno S,
Yamada M, Sato T, Narimatsu H & Hirabayashi J
(2006) Application of lectin microarray to crude
samples: differential glycan profiling of lec mutants.
J Biochem 139, 323–327.
13 Pilobello KT, Slawek DE & Mahal LK (2007) A ratio-
metric lectin microarray approach to analysis of the
dynamic mammalian glycome. Proc Natl Acad Sci USA
104, 11534–11539.
14 Tateno H, Uchiyama N, Kuno A, Togayachi A, Sato
T, Narimatsu H & Hirabayashi J (2007) A novel strat-
egy for mammalian cell surface glycome profiling using
lectin microarray. Glycobiology 17, 1138–1146.
15 Krishnamoorthy L, Bess JW, Preston AB, Nagashima
K & Mahal LK (2009) HIV-1 and microvesicles from T
cells share a common glycome, arguing for a common
origin. Nat Chem Biol 5, 244–250.
16 Kuno A, Itakura Y, Toyoda M, Takahashi Y, Yamada
M, Umezawa A & Hirabayashi J (2008) Development
of a data-mining system for differential profiling of cell
glycoproteins based on lectin microarray. J Proteomics
Bioinformatics 1, 68–72.
17 Matsuda A, Kuno A, Ishida H, Kawamoto T, Shoda
J-I & Hirabayashi J (2008) Development of an all-in-
one technology for glycan profiling targeting formalin-
embedded tissue sections. Biochem Biophys Res
Commun 370, 259–263.
18 Nakabayashi H, Taketa K, Miyano K, Yamane T &
Sato J (1982) Growth of human hepatoma cells lines
with differentiated functions in chemically defined med-
ium. Cancer Res 42, 3858–3863.
19 Aden DP, Fogel A, Plotkin S, Damjanov I & Knowles
BB (1979) Controlled synthesis of HBsAg in a differen-
tiated human liver carcinoma-derived cell line. Nature
282, 615–616.
20 Kaji H, Yamauchi Y, Takahashi N & Isobe T (2006)
Mass spectrometric identification of N-linked glycopep-
tides using lectin-mediated affinity capture and glycosyl-
ation site-specific stable isotope tagging. Nat Protocols
1, 3019–3027.
21 Natsume T, Yamauchi Y, Nakayama H, Shinkawa T,
Yanagida M, Takahashi N & Isobe T (2002) A direct
nanoflow liquid chromatography–tandem mass
spectrometry system for interaction proteomics. Anal
Chem 74, 4725–4733.
22 Kagebayashi C, Yamaguchi I, Akinaga A, Kitano H,
Yokoyama K, Satomura M, Kurosawa T, Watanabe
M, Kawabata T, Chang W et al. (2009) Automated
immunoassay system for AFP-L3% using on-chip
electrokinetic reaction and separation by affinity
electrophoresis. Anal Biochem 388, 306–311.
23 Wang M, Long RE, Comunale MA, Junaidi O,
Marrero J, Di Bisceglie AM, Block TM & Mehta AS
(2009) Novel fucosylated biomarkers for the early detec-
tion of hepatocellular carcinoma. Cancer Epidemiol
Biomarkers Prev 18, 1914–1921.
24 Kuno A, Kato Y, Matsuda A, Kaneko MK, Ito H,
Amano K, Chiba Y, Narimatsu H & Hirabayashi J
(2009) Focused differential glycan analysis with the plat-
form antibody-assisted lectin profiling for glycan-related
biomarker verification. Mol Cell Proteomics
8, 99–108.
25 Ciucanu I & Kerek F (1984) A simple and rapid
method for the permethylation of carbohydrates. Carbo-
hydr Res 131, 209–217.
26 Powell AK & Harvey DJ (1996) Stabilization of sialic
acids in N-linked oligosaccharides and gangliosides for
analysis by positive ion matrix-assisted laser desorp-
tion ⁄ ionization mass spectrometry. Rapid Commun
Mass Spectrom 10, 1027–1032.
27 Hase S (1994) High-performance liquid chromatography
of pyridylaminated saccharides. Methods Enzymol 230,
225–237.
28 Bigge JC, Patel TP, Bruce JA, Goulding PN, Charles
SM & Parekh RB (1995) Nonselective and efficient
fluorescent labeling of glycans using 2-amino benzamide
and anthranilic acid. Anal Biochem 230, 229–238.
29 Joshi HJ, Harrison MJ, Schulz BL, Cooper CA, Packer
NH & Karlsson NG (2004) Development of a mass
fingerprinting tool for automated interpretation of oligo-
saccharide fragmentation data. Proteomics 4, 1650–1664.
30 Tseng K, Hedrick JL & Lebrilla CB (1999) Catalog-
library approach for the rapid and sensitive structural
elucidation of oligosaccharides. Anal Chem 71, 3747–
3754.
31 Zhang H, Singh S & Reinhold VN (2005) Congruent
strategies for carbohydrate sequencing. 2. FragLib: an
MSn spectral library. Anal Chem 77, 6263–6270.
32 Lapadula AJ, Hatcher PJ, Hanneman AJ, Ashline DJ,
Zhang H & Reinhold VN (2005) Congruent strategies
for carbohydrate sequencing. 3. OSCAR: an algorithm
for assigning oligosaccharide topology from MSn data.
Anal Chem 77, 6271–6279.
33 Coussens L & Werb Z (2000) Inflammation and cancer.
Nature 420, 860–867.
34 Ru
¨
egg C (2006) Leukocytes, inflammation, and angio-
genesis in cancer: fatal attractions. J Leukoc Biol 80,
682–684.
Discovery of cancer glyco-biomarkers H. Narimatsu et al.
104 FEBS Journal 277 (2010) 95–105 ª 2009 The Authors Journal compilation ª 2009 FEBS
35 Itoh N, Sakaue S, Nakagawa H, Kurogochi M, Ohira
H, Deguchi K, Nishimura S & Nishimura M (2007)
Analysis of N-glycan in serum glycoproteins from
db ⁄ db mice and humans with type 2 diabetes. Am J
Physiol Endocrinol Metab 293, E1069–1077.
36 Miura Y, Hato M, Shinohara Y, Kuramoto H,
Furukawa J, Kurogochi M, Shimaoka H, Tada M,
Nakanishi K, Ozaki M et al. (2008) BlotGlycoABC
TM
,
an integrated glycoblotting technique for rapid and
large scale clinical glycomics. Mol Cell Proteomics 7,
370–377.
37 McShane L, Hunsberger S & Adjei A (2009) Effective
incorporation of biomarkers into phase II trials. Clin
Cancer Res 15, 1898–1905.
38 Hanahan D & Weinberg R (2000) The hallmarks of
cancer. Cell 100, 57–70.
39 Wagner KW, Punnoose EA, Januario T, Lawrence DA,
Pitti RM, Lancaster K, Lee D, Goetz MV, Yee SF,
Totpal K et al. (2007) Death-receptor O-glycosylation
controls tumor-cell sensitivity to the proapoptotic
ligand Apo2L ⁄ TRAIL. Nat Med 13, 1070–1077.
40 Irizarry RA, Hobbs B, Collin F, Beazer-Barclay YD,
Antonellis KJ, Scherf U & Speed TP (2003) Explora-
tion, normalization, and summaries of high density
oligonucleotide array probe level data. Biostat 4,
249–264.
41 Ihaka R & Gentleman R (1996) R: a language for data
analysis and graphics. J Comput Graph Stat 5, 299–314.
H. Narimatsu et al. Discovery of cancer glyco-biomarkers
FEBS Journal 277 (2010) 95–105 ª 2009 The Authors Journal compilation ª 2009 FEBS 105