Tài liệu Báo cáo khoa học: A systems biology approach for the analysis of carbohydrate dynamics during acclimation to low temperature in Arabidopsis thaliana doc
Bạn đang xem bản rút gọn của tài liệu. Xem và tải ngay bản đầy đủ của tài liệu tại đây (555.25 KB, 13 trang )
A systems biology approach for the analysis of
carbohydrate dynamics during acclimation to low
temperature in Arabidopsis thaliana
Thomas Nagele, Benjamin A. Kandel*, Sabine Frana*, Meike Meiòner and Arnd G. Heyer
ă
Biologisches Institut, Abteilung Panzenbiotechnologie, Universitat Stuttgart, Germany
ă
Keywords
acclimation dynamics; Arabidopsis;
carbohydrate metabolism; freezing
tolerance; mathematical modelling
Correspondence
T. Na
ăgele, Biologisches Institut, Abteilung
Panzenbiotechnologie, Universitat
ă
Stuttgart, Pfaffenwaldring 57, D-70550
Stuttgart, Germany
Fax: +49 711 685 65096
Tel: +49 711 685 69141
E-mail:
*These authors contributed equally to this
work
(Received 11 August 2010, revised 22 September 2010, accepted 22 November 2010)
doi:10.1111/j.1742-4658.2010.07971.x
Low temperature is an important environmental factor affecting the performance and distribution of plants. During the so-called process of cold
acclimation, many plants are able to develop low-temperature tolerance,
associated with the reprogramming of a large part of their metabolism. In
this study, we present a systems biology approach based on mathematical
modelling to determine interactions between the reprogramming of central
carbohydrate metabolism and the development of freezing tolerance in two
accessions of Arabidopsis thaliana. Different regulation strategies were
observed for (a) photosynthesis, (b) soluble carbohydrate metabolism and
(c) enzyme activities of central metabolite interconversions. Metabolism of
the storage compound starch was found to be independent of accessionspecific reprogramming of soluble sugar metabolism in the cold. Mathematical modelling and simulation of cold-induced metabolic reprogramming
indicated major differences in the rates of interconversion between the
pools of hexoses and sucrose, as well as the rate of assimilate export to
sink organs. A comprehensive overview of interconversion rates is presented, from which accession-specific regulation strategies during exposure
to low temperature can be derived. We propose this concept as a tool for
predicting metabolic engineering strategies to optimize plant freezing tolerance. We confirm that a significant improvement in freezing tolerance in
plants involves multiple regulatory instances in sucrose metabolism, and
provide evidence for a pivotal role of sucrose–hexose interconversion in
increasing the cold acclimation output.
Introduction
Low temperature is an important environmental factor
affecting plant growth, and constraining crop productivity and species distribution [1,2]. Whereas many
tropical and subtropical species have only limited
capacities to cope with low temperature, plants from
temperate climates, such as Arabidopsis thaliana, grow
at low temperature and can increase their freezing tolerance when exposed to low but nonfreezing temperatures, in a process termed cold acclimation [3]. The
acclimation process is a very complex phenomenon
comprising numerous changes in metabolism and
affecting gene expression, membrane structure, and the
composition of proteins and primary and secondary
metabolites [4–7]. In this context, many studies have
shown a strong correlation between changes in the
regulation of central carbohydrate metabolism and
freezing tolerance [4,8]. In Arabidopsis, the development
of leaves at low temperature causes reprogramming of
Abbreviations
eInv, extracellular invertase; FrcK, fructokinase; FW, fresh weight; GlcK, glucokinase; LT50, 50% lethality temperature; nInv, neutral
invertase; Rsch, Rschew; SD, standard deviation; SPS, sucrose phosphate synthase; vInv, vacuolar invertase.
506
FEBS Journal 278 (2011) 506–518 ª 2010 The Authors Journal compilation ª 2010 FEBS
T. Nagele et al.
ă
carbon metabolism, with a shift in partitioning of
newly fixed carbon into sucrose rather than starch
[9,10], indicating cold-induced selective stimulation of
sucrose synthesis, which could be the reason for the
elevated cellular sucrose content that is found in many
plants upon cold exposure. Sucrose may act directly as
a cryoprotectant, as has been shown in vitro with
artificial membrane systems [11], or serve as a substrate for the synthesis of other cryoprotective
compounds, such as raffinose, the level of which has
been found to correlate with freezing tolerance in species
as diverse as A. thaliana [12], grape vines [13] and woody
conifers [14].
As already outlined [12], direct correlation of a multigenic trait such as freezing tolerance with the concentration of only one or a few metabolites may not be
what one would expect. This was demonstrated by
work [15] showing that, despite the correlation of
freezing tolerance with raffinose levels in natural accessions of Arabidopsis, varying raffinose concentrations
in accession Col-0 by overexpression of galactinol synthase or knockout of raffinose synthase did not affect
freezing tolerance. Considering the complexity of the
metabolic and regulatory networks, indicated by the
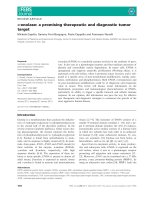
schematic and very simplified structure of primary carbohydrate metabolism in Fig. 1, it becomes obvious
that, to investigate such nonintuitive networks, an
approach is needed that incorporates multiple and, in
part, circular metabolite interconversions and regulation strategies. This is provided by systems biology
techniques, which have rapidly become integrated into
metabolic research, driven by the need to study complex interactions among components of biological systems [16]. Basically, the intention of systems biology is
Fig. 1. Schematic representation of central carbohydrate metabolism in leaf cells of Arabidopsis thaliana. Reaction rates (r) represent
central processes of carbon input, output and interconversion.
Systems biology of cold acclimation in A. thaliana
to resolve the relationship between individual entities,
e.g. molecules or genes, that are parts of highly interconnected networks, in order to understand the resulting system behaviour, e.g. a phenotype of an
organism. To handle complex networks, formal representation by mathematical models is indispensable.
Integration of data on, for example, gene expression,
protein abundance, metabolite concentration and other
biological parameters with an iterative model, and
exploration of model characteristics such as modularity, optimality and robustness, promise to advance our
system-wide understanding of complex biological networks [17].
In this work, we present a systems biology approach
focused on the dynamic modelling of cold-induced
reprogramming of central carbohydrate metabolism in
A. thaliana. Performing experiments with two accessions of different origin, i.e. Rschew (Rsch), originating from Russia, and C24, originating from southern
Europe, which show significantly different cold-acclimation capacities, we prove that mathematical modelling of metabolism and validation by experimental
data offers an attractive possibility for the study of
complex system–environment interactions.
Results
Freezing tolerance
Changes in freezing tolerance of Rsch and C24 during
7 days of exposure to cold (4 °C) was analysed with
the well-established electrolyte leakage method, as
described in Experimental procedures, with measurements at days 0, 1, 3 and 7 (Fig. 2). The 50% lethality
Fig. 2. Freezing tolerance of Rsch (black, continuous line) and C24
(grey, dotted line) over time of exposure to 4 °C. Closed circles represent means ± SD (n = 6) of LT50.
FEBS Journal 278 (2011) 506–518 ª 2010 The Authors Journal compilation ª 2010 FEBS
507
Systems biology of cold acclimation in A. thaliana
T. Nagele et al.
ă
temperature (LT50) values of both accessions were signicantly different at all time points during acclimation, confirming that Rsch is more tolerant to freezing
than C24, and has a higher acclimation capacity, as
previously outlined [6]. The basic tolerance of C24
was ) 3.3 ± 0.07 °C, whereas that of Rsch was
) 4.9 ± 0.09 °C. Rsch showed the strongest reduction
in LT50 between 1 and 3 days, whereas the gain in tolerance was only minor during the first 24 h of cold
exposure and between days 3 and 7. In contrast, LT50
decreased almost continuously in C24 until day 3 and
did not change thereafter, resulting in final freezing
tolerances of ) 5.4 ± 0.12 °C in C24 and ) 9.1 ±
0.16 °C in Rsch.
Enzyme activites of central carbohydrate
interconversions
As enzyme activities represent crucial points of regulation in metabolic networks, we analysed the maximum
activities (Vmax) of prominent enzymes in central carbohydrate metabolism with respect to different durations of exposure to 4 °C (Fig. 3). The enzymes
analysed included vacuolar invertase (vInv), neutral
invertase (nInv), extracellular invertase (eInv), sucrose
phosphate synthase (SPS), fructokinase (FrcK) and
glucokinase (GlcK). Significant differences in Vmax
between Rsch and C24 were found for vInv (Fig. 3A)
and SPS (Fig. 3D). Whereas SPS activities were consistently higher in Rsch, C24 showed significantly higher
activities of vInv at 0, 1 and 3 days of cold exposure.
The activity of vInv in Rsch increased continuously
during cold exposure, and became significantly higher
than in C24 after 7 days at 4 °C. As compared with
that of vInv, the activities of nInv and eInv were low,
and became noticeably higher only in Rsch after
7 days of cold exposure (Fig. 3B,C). However, in both
accessions, values of Vmax for eInv increased continuously from 0 to 3 days of cold exposure.
Maximum activities of the hexose-phosphorylating
FrcK and GlcK showed similar patterns in both accessions over the whole period of cold exposure
(Fig. 3E,F). The Vmax of GlcK rose sharply in both
accessions by a factor of $ 1.5 during the first day of
cold exposure (Fig. 3F).
Cold-induced changes in net carbon uptake and
sink export
To obtain a quantitative measure of how exposure to
4 °C influenced the process of photosynthesis, gas
exchange of plants was measured by infrared gas analysis. Measurements were performed during the first 8 h
508
of the light phase, representing the time period of photosynthetic activity until plants were harvested for
analysis of metabolites (see below). The rate of net carbon uptake was integrated and divided by the time
period of measurement to obtain the mean uptake rate
per hour (Fig. 4A). Mean net carbon uptake was not
significantly influenced by cold exposure in Rsch, but
showing a slight decrease during the first day at 4 °C
and stabilization over the following time period. C24
showed slightly lower mean rates of carbon uptake
before and during the first day of cold acclimation.
After 3 days of cold exposure, the mean rate of carbon
uptake was significantly lower for C24 than for Rsch
(P = 0.03), and this was followed by recovery until
7 days at 4 °C, when the mean uptake rate
[21.5 ± 1.03 lmol C1Ỉh)1Ỉg)1 fresh weight (FW)] was
almost the same as in Rsch (24.7 ± 1.8 lmol
C1Ỉh)1Ỉg)1 FW).
Calculated means of uptake rates were fed into the
mathematical model, and standard deviations (SDs)
were set as boundaries in the estimation process for
model parameters (Fig. 4A). As described in Experimental procedures, the rate of assimilate export from
photosynthetically active source organs to consuming
sink organs or metabolic pathways other than carbohydrate pathways was calculated as the difference
between net carbon uptake and changes in cellular carbohydrate content. The resulting surplus of carbon
equivalents (Fig. 4B) was regarded as being exported
to sink organs or other pathways. The time courses of
simulated export rate during the first day of exposure to
4 °C were very similar in both accessions, showing a
slight decrease, which was also found for net carbon
uptake (see above). During the following days of cold
exposure, Rsch showed a noticeably faster regeneration
of sink export rate than did C24, although both accessions reached almost the same export rate after 7 days
of cold exposure. Discontinuities in the calculated
export rate after 1 day and 3 days result from the sharp
increase in carbohydrate content (starch and soluble carbohydrates) during that time period of cold exposure.
Effect of cold exposure on levels of soluble
carbohydrates and starch
Contents of leaf starch, sucrose, hexoses and raffinose
were determined over the course of cold exposure
(Fig. 5). In both accessions, starch content was not
altered at 1 day of cold exposure (Fig. 5A), but
showed a significant increase between 1 day and 3 days
(PRsch < 0.0001; PC24 < 0.0001), coinciding with the
main increase in freezing tolerance (see Fig. 2). The
starch content of C24 decreased nonsignificantly until
FEBS Journal 278 (2011) 506–518 ª 2010 The Authors Journal compilation ª 2010 FEBS
T. Nagele et al.
ă
Systems biology of cold acclimation in A. thaliana
A
D
B
E
C
F
Fig. 3. Maximum activities of enzymes in central carbohydrate metabolism during cold exposure. (A–C) Vmax values of three invertase isoforms: vInv, nInv and eInv. (D) Vmax of SPS. (E, F) Vmax values of FrcK and GlcK. Significant differences between the ecotypes Rsch (black)
and C24 (grey) are indicated by asterisks (P < 0.05). Bars represent means ± SD (n = 7).
7 days of cold exposure, reaching 16.2 ± 7.07 lmol C6Ỉg)1 FW, whereas Rsch had a starch level of
23 ± 7.4 lmol C6Ỉg)1 FW after the cold acclimation
period.
Over the time course of acclimation, changes in concentrations of soluble carbohydrates during cold exposure displayed some similarities with respect to
dynamics, but differed greatly in absolute values
FEBS Journal 278 (2011) 506–518 ª 2010 The Authors Journal compilation ª 2010 FEBS
509
Systems biology of cold acclimation in A. thaliana
T. Nagele et al.
ă
A
B
Fig. 4. Rates of net photosynthesis (A) and simulated sink export (B) during cold exposure in Rsch (black) and C24 (grey). Open circles represent means of measurements ± SD (n = 3). Continuous lines represent means of model simulations (n = 50). Dotted lines represent
results of model simulations with lower and top values of kinetic parameters.
A
B
C
D
Fig. 5. Cold-induced dynamics of central carbohydrates in Rsch (black) and C24 (grey). Open circles represent means of measurements ± SD (n = 5). Continuous lines represent means of model simulations (n = 50). In (B) (sucrose) and (C) (hexoses), dotted lines represent the results of model simulations with lower and top values of kinetic parameters.
(Fig. 5B–D). Sucrose content increased significantly
and reached peak values after 3 days of cold exposure:
7.1 ± 2.3 lmolỈg)1 FW in Rsch and 3 ± 0.8 lmolỈg)1
510
FW in C24 (Fig. 5B). This was followed by a slight
but nonsignificant decrease until 7 days of cold exposure. Concentrations of free hexoses, calculated as the
FEBS Journal 278 (2011) 506–518 ª 2010 The Authors Journal compilation ª 2010 FEBS
T. Nagele et al.
ă
sum of fructose and glucose equivalents, were similar
in both accessions at the beginning of cold exposure
(Fig. 5C). However, after 3 days of cold exposure,
Rsch (67.1 ± 9.3 lmol C6Ỉg)1 FW) accumulated
almost three times as much hexose as C24
(28.1 ± 2.8 lmol C6Ỉg)1 FW), and it maintained this
level until 7 days, whereas C24 showed a significant
decrease in hexose level to 15.1 ± 3.7 lmol C6Ỉg)1 FW
(P < 0.001). The raffinose concentration increased
almost linearly with time of cold exposure in both
accessions. In Rsch, the raffinose content increased significantly from 0.13 ± 0.04 to 2.25 ± 0.6 lmolỈg)1
FW after 7 days of cold exposure (P < 0.01), and was
about twice as high as in C24, which showed an
increase from 0.09 ± 0.02 to 0.96 ± 0.39 lmolỈg)1
FW (P < 0.01; Fig. 5D).
Simulation of metabolic levels and rates of
interconversion
Identification of parameters used to describe the metabolic network as represented in Fig. 1 was performed
by applying a constraint-based approach (for the explicit model structure, see Experimental procedures).
Model constraints were set by experimental data on
net carbon uptake, metabolite levels and maximum
enzyme activities, which gave a provisional estimation
of the maximum flux capacity of the corresponding
pathway. Experimental data on maximum enzyme
activities of SPS, GlcK, FrcK and invertase at 4 °C
were used as lower and upper bounds in the process of
parameter identification. The resulting model simulation using identified parameters was successful in
describing cold exposure-dependent changes in carbohydrate levels (Fig. 5A–D, continuous lines). To test
the statistical robustness of the identified model
parameters and to validate them with experimental
data, 50 independent identification processes with varying initial carbohydrate levels were performed, yielding
means with corresponding SDs of estimated kinetic
parameters. Identified values of Vmax matched the values from experiments, and comparison of identified Km
and Ki values agreed with values from the literature
(Table 1). Rate constants and corresponding rates of
sucrose synthesis were compared with Vmax values for
both hexokinase activity (GlcK and FrcK) and SPS
activity, as both enzymes contribute to hexose-based
sucrose synthesis (see also ‘Model documentation’ in
Doc. S3). Simulations resulting from upper, lower and
mean values of parameter sets described metabolic
changes during cold exposure within the SDs of experimental results (Fig. 5A–D), thus proving reproducibility
of the obtained parameters and of simulation results.
Systems biology of cold acclimation in A. thaliana
Mean values of accession-specific parameter sets
were used to analyse low-temperature effects on interconversion rates during the 7-day cold acclimation period. Rates of sucrose–hexose interconversions showed
significant differences between Rsch and C24 after
7 days of exposure to 4 °C (Fig. 6A,B), but were the
same for the first 3 days of cold exposure, except for a
small peak in sucrose cleavage rate in Rsch on day 2
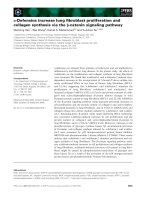
(Fig. 6A). In order to obtain a comprehensive overview of all simulated rates of metabolite interconversions, a three-dimensional surface plot was created
(Fig. 7A,B) that allowed (a) assessment of the trajectory of interconversion rates as a function of time of
cold exposure, (b) comparison of the magnitudes of
the various interconversion rates, and (c) lineup of the
accessions with respect to their metabolic acclimation
strategies. Major differences in sucrose metabolism
between the accessions were identified. Whereas C24
showed a cold-induced reduction of carbon channelling
into sucrose synthesis from the start until day 3 of
exposure to 4 °C, the corresponding flux in Rsch was
reduced only during the first 24 h of cold exposure
(Fig. 7A,B, CO2 to sucrose). A similar pattern was
observed for rates of CO2 uptake and export of
sucrose to sink organs, but not for starch synthesis. As
already illustrated in Fig. 6, sucrose cleavage and hexose-based resynthesis were increased in Rsch, whereas
C24 showed a significant reduction in sucrose cycling
during cold exposure (Fig. 7A,B, sucrose to hexoses,
hexoses to sucrose).
In silico experiments
To estimate the metabolic impact of differences
between Rsch and C24 concerning sucrose cycling, we
performed in silico experiments, using the validated
mathematical model in terms of predictive metabolic
engineering [18]. Replacing Vmax values and k values
in the C24 model with the identified values for Rsch
resulted in simulations that were not successful in
describing the whole experimental dataset on sucrose
and hexoses (Fig. S1). The sucrose content after 1 day
at 4 °C was predicted to be higher than the experimental value, whereas the simulated hexose content was
lowered. Performance of a further in silico experiment
in which the Vmax and k values of C24 were applied to
the Rsch model confirmed that the main differences in
reprogramming of carbohydrate metabolism occur during the first 3 days of exposure to low temperature
(Fig. S2). In particular, the sucrose content after 1 day
at 4 °C was underestimated and, simultaneously, the
hexose content showed a faster increase than in the
corresponding experimental data.
FEBS Journal 278 (2011) 506–518 ª 2010 The Authors Journal compilation ª 2010 FEBS
511
512
Hexoses fi sucrose
(Hxk, SPS)
Sucrose fi hexoses
(invertase)
Vmax
Km
Ki
r
k
r
62.1
10.5
1.7
2.33
0.33
0.29
17.3
11.9
4.1
0.91
1.1
0.85
±
±
±
±
±
±
±
±
±
±
±
±
9.8
2.7
0.3
0.1
0.08
0.08
7.7
2.9
0.8
0.43
0.3
0.24
Parameter
estimation
GT, genotype; Hxk, hexokinase (glucokinase + fructokinase).
C24
Vmax
Km
Ki
r
k
r
Sucrose fi hexoses
(invertase)
Rsch
Hexoses fi sucrose
(Hxk, SPS)
Parameter
Reaction
GT
0
22.2 ± 11.7
5–12 [35]
2.5 [36]
–
–
Hxk: 3.73 ± 0.97
SPS: 22.1 ± 7.0
64.6 ± 18.3
5–12 [35]
2.5 [36]
–
–
Hxk: 3.3 ± 1.0
SPS: 6.3 ± 2.6
Experiment ⁄
literature
Time of exposure to 4 °C (days)
36.6
12.1
1.7
0.58
0.05
0.72
11.0
10.4
4.1
0.76
0.04
0.61
±
±
±
±
±
±
±
±
±
±
±
±
3.1
1.9
0.3
0.06
0.01
0.1
2.5
2.6
0.8
0.14
0.02
0.22
Parameter
estimation
1
16.0 ± 11.9
–
–
–
–
Hxk: 0.51 ± 0.13
SPS: 2.4 ± 0.5
28.9 ± 12.6
–
–
–
–
Hxk: 0.54 ± 0.09
SPS: 0.73 ± 0.54
Experiment ⁄
literature
42.2
12.1
1.7
0.48
0.03
0.88
41.4
10.4
4.1
0.99
0.02
1.21
±
±
±
±
±
±
±
±
±
±
±
±
5.0
1.9
0.3
0.06
0.004
0.12
4.7
2.6
0.8
0.27
0.009
0.58
Parameter
estimation
3
21.1 ± 17.3
–
–
–
–
Hxk: 0.42 ± 0.1
SPS: 3.2 ± 1.7
34.7 ± 19.6
–
–
–
–
Hxk: 0.59 ± 0.2
SPS: 1.2 ± 0.61
Experiment ⁄
literature
12.8
12.1
1.7
0.12
0.04
0.67
75.9
10.4
4.1
1.24
0.04
2.63
±
±
±
±
±
±
±
±
±
±
±
±
2.1
1.9
0.3
0.02
0.002
0.04
36.4
2.6
0.8
0.45
0.016
0.76
Parameter
estimation
7
85.1 ± 59.1
–
–
–
–
Hxk: 0.51 ± 0.18
SPS: 4.7 ± 1.2
10.8 ± 6.1
–
–
–
–
Hxk: 0.66 ± 0.16
SPS: 1.4 ± 0.8
Experiment ⁄
literature
Table 1. Validation of enzyme parameters determined by parameter estimation. Values of Km and Ki are given in mM. The unit of maximum enzyme activity (Vmax) and rate of metabolite
interconversion (r) is lmol substrath)1Ỉg)1 FW. Rate constants (k) are given in h)1. The results of parameter estimation for Km and Ki are compared with values from the literature. Identified values of Vmax are compared with experimental data obtained at 22 °C (0 days at 4 °C) and 4 °C (1 day, 3 days and 7 days at 4 °C), respectively. The results of parameter estimation
represent means ± SD (n = 50). Experimental data represent means ± SDs (n = 7).
Systems biology of cold acclimation in A. thaliana
T. Nagele et al.
ă
FEBS Journal 278 (2011) 506518 ê 2010 The Authors Journal compilation ª 2010 FEBS
T. Nagele et al.
ă
Systems biology of cold acclimation in A. thaliana
A
B
Fig. 6. Dynamics of rates of sucrose cleavage (A) and hexose-based sucrose synthesis (B) during exposure to 4 °C. Lines represent means
of simulation (n = 50) for Rsch (black) and C24 (grey). Dotted lines represent results of model simulations with lower and top values of
kinetic parameters.
A
B
Fig. 7. Surface plot of simulated rates of
metabolite interconversion for accessions
C24 (A) and Rsch (B). For comparison, all
fluxes are represented in lmol C6Ỉh)1Ỉg)1
FW. In addition to surface topography,
quantities of fluxes are indicated by colour
as defined in the colour bar.
Discussion
Cold acclimation of plants involves a large number of
metabolic changes as well as readjustments in other
cellular processes. Numerous studies have emphasized
the importance of primary carbohydrate metabolism
during cold acclimation, and have identified regulatory
instances with significant influence [9,10,12,15,19,20].
FEBS Journal 278 (2011) 506–518 ª 2010 The Authors Journal compilation ª 2010 FEBS
513
Systems biology of cold acclimation in A. thaliana
T. Nagele et al.
ă
However, the complex interactions of metabolic pathways precludes the generation of a full picture of
cold acclimation through assembly of reaction details.
In the present study, a systems biology approach with
dynamic modelling was developed and validated by
experimental data on two Arabidopsis accessions, Rsch
and C24, with different cold acclimation capacities.
Dynamics were generated by varying the time periods
for which plants were exposed to 4 °C, thus capturing
different stages of metabolic adjustment to low temperature. As indicated by the LT50 values, the freezing tolerances of the accessions differed not only in terms of
the absolute values but also in the progression of the
acclimation process. This is an important outcome, as
it allows estimation of the impact of different metabolic responses on the improvement in freezing tolerance. Comparison of changes in metabolism between
1 day and 3 days of cold exposure revealed significant
differences in net carbon uptake and sink export rate
between Rsch and C24. Whereas net carbon uptake
and rate of sink export were constantly reduced in C24
over the entire exposure time, Rsch almost completely
compensated for the low-temperature effects at day 3.
This coincides with the time point of maximal tolerance acquisition, thus proving the importance of photosynthesis
and
long-distance
transport
for
acclimation. The requirement for photosynthetic activity has also been demonstrated [21], and it was shown
that acclimation does not take place in total darkness.
Strand et al. [22] found that cold acclimation was significantly enhanced in plants with increased SPS activity, leading to higher photosynthetic performance at
low temperatures. Interestingly, model simulations for
C24 and Rsch revealed that synthesis of soluble sugar
was never limited by photosynthetic capacity. Even
C24, which displayed a reduction in photosynthesis at
days 3 and 7, had the capacity to assimilate at least
about 3 lmol C6Ỉh)1Ỉg)1 FW, which would have been
sufficient to bring about much higher sugar levels than
those determined. Therefore, we suggest that assimilate
allocation within the plant may become limiting in the
cold. This was also demonstrated for cucumber, in
which the sucrose supply to sink organs rather than
source capacity correlated with low-temperature tolerance [23]. It appears that the major difference between
Rsch and C24 is the capacity to re-establish homeostasis in carbon allocation. This is supported by the
observation that Arabidopsis plants with SPS overexpression, which show a significant increase in freezing
tolerance as compared with the wild type, not only
accumulate sucrose in their leaves, but also specifically
increase the expression of the high-affinity sucrose
transporter AtSUC1, which is highly homologous to
514
the phloem loading transporter AtSUC2 [20,24]. However, it has to be kept in mind that the sink export rate
in our model is composed of assimilate export to sink
organs and flux into further pools of carbon-containing metabolites and structural components, e.g. amino
acids and cell wall components. Therefore, the real
rates of export of carbohydrates to sink organs might
be smaller than predicted by our model.
In contrast to soluble carbohydrates, the starch content of plants did not show significant differences
between the accessions over the whole period of cold
exposure, even though net carbon uptake rates varied
strongly. This suggests that starch metabolism was
directly correlated neither with photosynthesis nor with
the cold acclimation process. This may explain why
we, using C24 and Rsch, did not find a negative correlation of freezing tolerance with channelling of carbon
into starch, whereas Klotke et al. [12] reported such a
correlation for C24 and Col-0, which has a freezing
tolerance similar to that of [6]. Given that starch plays
an important role as a major integrator in the regulation of plant growth [25], it is noticeable that, at least
in Rsch, the most significant changes in starch content
occurred simultaneously with the largest increase in
freezing tolerance. Considering that rates of rosette
biomass increase are negatively correlated with starch
levels [25], our data confirm the observation that the
acquisition of freezing tolerance is coupled to a metabolic state in which growth is suspended [26].
Major changes in pools of free hexoses and sucrose
took place until the third day of cold exposure, but
after this no further significant changes could be
observed. Therefore, we conclude that the process of
cold acclimation is divisible into three consecutive
stages: (a) immediate response to displacement of
homeostasis; (b) reprogramming of central carbohydrate metabolism; and (c) stabilization of a new state
of metabolic homeostasis with respect to carbohydrate
metabolism. Simulation of metabolite interconversion
rates revealed a distinct difference in sucrose metabolism of Rsch and C24. In particular, rates of sucrose
cleavage and hexose-based sucrose resynthesis showed
significant differences with respect to both their absolute values and the time course. From the simulations,
it appears that the ability to sustain the cycling of
sucrose, which has been postulated to function in the
stabilization of mesophyll sugar metabolism [27–29],
positively correlates with low-temperature acclimation
capacity. Additional support for this hypothesis arises
from experimental data on enzyme activities, which
show that invertase activity is increased during cold
exposure in Rsch, whereas acitivity is reduced in C24
after 7 days in the cold. Regarding the question of
FEBS Journal 278 (2011) 506–518 ª 2010 The Authors Journal compilation ª 2010 FEBS
T. Nagele et al.
ă
how to engineer plant metabolism in order to improve
freezing tolerance, one could suggest increasing the
maximum activities of enzymes participating in sucrose
cycling. Assuming that Rsch is optimized for cold
acclimation, we suggest, on the basis of the results of
the in silico experiments (Figs S1 and S2), that the
metabolism of C24 has to be changed in a way that
leads to an increased sucrose content and a simultanous reduction in hexose concentration, particularly
during the initial period of cold exposure. Using RNA
interference-mediated inhibition of the dominating vacuolar invertase ATbFRUCT4 (At1g12240), we have
already demonstrated this [12]. However, it was shown
that fully cold-acclimated transformants of C24 did
not differ from the wild type with regard to freezing
tolerance and, at the same time, differences in sucrose
concentration between the C24 genotypes were lost.
Therefore, we suggest that inhibition of invertase must
be linked with overexpression of SPS, as described in
[22], to achieve sucrose accumulation, a decrease in
hexose content and, in consequence, a significant
increase in freezing tolerance.
Conclusions
The present study elucidates differences in coldinduced reprogramming of central carbohydrate
metabolism. Mathematical modelling of metabolism
with respect to the dynamics of freezing tolerance
revealed a significant correlation of sucrose synthesis
and degradation with the process of cold acclimation.
We conclude that acclimation to low temperature represents a dynamic process, the investigation of which
therefore requires approaches that take into account
metabolic dynamics and interdependencies rather than
simple steady-state concentrations. We present a
method based on dynamic modelling that allows for
the quantification and visualization of cellular rates of
metabolite interconversion during an acclimation process incorporating environmental changes. Furthermore, we suggest that successful metabolic engineering
of freezing tolerance in plants should include such an
analysis of the dynamics of metabolism to gain comprehensive information about the effects of individual
overexpression or knockout events on the whole acclimation process.
Experimental procedures
Plant material
A. thaliana plants of the accessions Rsch and C24 were
grown in GS90 soil and vermiculite (1 : 1), with three
Systems biology of cold acclimation in A. thaliana
plants per 10-cm pot in a growth chamber at 8 h of light
(50 lmolỈm)2Ỉs)1; 22 °C) ⁄ 16 h of dark (16 °C) for 4 weeks,
and then transferred to a growth chamber with a temperature regime of 22 °C in the day (16 °h) and 16 °C at night
(8 h). The light intensity was 50 lmolỈm)2Ỉs)1, and the relative humidity was 70%. Plants were watered daily, and fertilized every 2 weeks with standard NPK fertilizer. After
42 days, plants were shifted to a 16-h ⁄ 8-h light ⁄ dark regime
of 4 ⁄ 4 °C and a light intensity of 50 lmolỈm)2Ỉs)1. Leaf
samples consisting of two rosette leaves each were taken
from nine individual plants grown in three different pots
in a random design before and after 1 day, 3 days and
7 days of exposure to 4 °C. Samples were taken after a
light period of 8 h. At that stage, the aerial part of the
plant is exclusively composed of rosette leaves, allowing
a direct comparison of metabolite with CO2 exchange
data. Leaf samples were weighed, immediately frozen in
liquid nitrogen and stored at ) 80 °C until metabolite
extraction.
Electrolyte leakage measurement
Freezing tolerance was tested according to the electrolyte
leakage method as previously described [30], with a few
modifications. The cooling rate was set to 4 °C ⁄ h, and samples were taken at 2 °C intervals over a temperature range
of 0 to ) 18 °C. Conductivity was measured with an inoLab740 conductivity meter (WTW GmbH, Weilheim, Germany) and multilabpilot software. The LT50 values were
calculated as the log EC50 values of sigmoidal dose–
response curves, fitted to the measured leakage values with
graphpad prism 3 software.
Gas exchange measurement
Exchange rates of CO2 were measured with an infrared gas
analysis system (Uras 3 G; Hartmann & Braun AG, Frankfurt am Main, Germany). A whole-rosette cuvette design
was used as described in [31]. Gas exchange was measured
in the growth chamber shortly before plant harvesting.
Means of raw data for gas exchange were converted to flux
rates per gram of FW obtained at the end of the exposure
by weighing complete rosettes.
Carbohydrate analysis
Frozen leaf samples were homogenized with a Retsch MM20 ball mill (Retsch, Haan, Germany). The
homogenate was extracted twice in 400 lL of 80% ethanol at 80 °C. Extracts were dried and dissolved in
500 lL of distilled water. Contents of glucose, fructose,
sucrose and raffinose were analysed by high-performance
anion exchange chromatography (HPAEC) with a CarboPac PA-1 column on a Dionex (Sunnyvale, CA, USA)
FEBS Journal 278 (2011) 506–518 ª 2010 The Authors Journal compilation ª 2010 FEBS
515
Systems biology of cold acclimation in A. thaliana
T. Nagele et al.
ă
DX-500 gradient chromatography system coupled with a
pulsed amperometric detection by a gold electrode. For
starch extraction, pellets for ethanol extraction were
solubilized by heating them to 95 °C in 0.5 m NaOH
for 30 min. After acidification with 1 m CH3COOH, the
suspension was digested for 2 h with amyloglucosidase.
The glucose content of the supernatant was then determined and used to assess the starch content of the
sample.
Measurement of enzyme activities
Enzyme activities were determined in crude extracts of leaf
samples. For assessment of acitivities of soluble acid
invertase, cell wall-bound invertase and nInv, about
100 mg of frozen leaf tissue was homogenized in 50 mm
Hepes ⁄ KOH (pH 7.4), 5 mm MgCl2, 1 mm EDTA, 1 mm
EGTA, 1 mm phenylmethanesulfonyl fluoride, 5 mm dithiothreitol, 0.1% Triton X-100 and 10% glycerin. Suspensions were centrifuged at 3500 g for 25 min at 4 °C, and
invertase activities were assayed in the supernatants. Soluble acid invertase was assayed in 20 mm sodium acetate
buffer (pH 4.7) with 100 mm sucrose as a substrate. nInv
was assayed in 20 mm Hepes ⁄ KOH (pH 7.5), also with
100 mm sucrose as substrate. The activity of cell wallbound invertase was determined as described for soluble
acid invertase, but without centrifugation of the homogenized suspension and subsequent subtraction of soluble
acid invertase activity. The control of each assay was
boiled for 3 min after addition of enzyme extract. Reactions were incubated for 60 min at 30 and 4 °C, and
stopped by boiling for 3 min; the concentration of glucose
was determined photometrically.
The activity of SPS was determined after homogenization of frozen leaf tissue in 50 mm Hepes ⁄ KOH (pH 7.5),
15 mm MgCl2, 1 mm EDTA, 2.5 mm dithiothreitol and
0.1% Triton X-100. Suspensions were centrifuged at
16 200 g for 5 min at 4 °C, and SPS activity was assayed
in the supernatant with a reaction buffer consisting of
50 mm Hepes ⁄ KOH (pH 7.5), 15 mm MgCl2, 2.5 mm
dithiothreitol, 10 mm UDP-glucose, 10 mm fructose 6phosphate and 40 mm glucose 6-phosphate; 30% KOH
was added to the control of each assay. Reactions were
incubated for 30 min at 25 and 4 °C, and then at 10 min
at 95 °C. Anthrone 0.2% in 95% H2SO4 was added, and
the samples were incubated for 8 min at 90 °C. Absorption at 620 nm was determined photometrically.
Activities of GlcK and FrcK were measured as described
in [32], at ambient temperature (22 °C) and 4 °C. Synthesized glucose 6-phosphate was converted to 6-phosphogluconolactone by glucose-6-phosphate dehydrogenase, and the
conversion was measured photometrically by changes in the
concentration of the reduced cosubstrate NADPH. For
isomerization of fructose 6-phosphate, phosphoglucoisomerase was added.
516
Mathematical modelling, parameter identification
and simulation
A mathematical model was developed, representing central
carbohydrate metabolism in leaves of A. thaliana. The
model was based on the following system of ordinary differential equations describing alterations in carbohydrate
pools over time of exposure to low temperature (4 C):
d= Sucị ẳ 1 rCO !Suc rSuc!Raf rSuc!Hex
2
dt
2
1
1
ỵ rHex!Suc rSuc!Sinks
2
2
d= Starchị ẳ rCO !Starch
2
dt
d= Hexị ẳ 2rSuc!Hex rHex!Suc
dt
d= Rafị ẳ rSuc!Raf
dt
d= Sinksị ẳ rSuc!Sinks
dt
These state equations for sucrose, starch, hexoses, rafnose and sinks depended on the adjoining fluxes r(t). The
different rA fi B values described the respective metabolic
fluxes from metabolite A to metabolite B (see Fig. 1).
The rate of net starch synthesis (rCO2 !Starch )was deter-
mined by interpolation of measured starch contents
(unit: C6) and calculation of the first derivative of this
function. The flux rate of CO2 into sucrose synthesis
(rCO2 !Suc ) was caclulated as the difference between the rate
of net photosynthesis and that of net starch synthesis (unit:
C6 h)1Ỉg)1 FW):
rCO2 !Suc ¼ rNetPhotosynthesis ÀrCO2 !Starch
Ratesof net photosynthesis (rNetPhotosynthesis) were calculated as the average rate of carbon uptake during the first
half of the light phase (n = 8 h):
n
R
rNetPhotosynthesis ¼
xNPSi
i¼1
n
;
where xNPSi describes the integral of carbon uptake per
hour. Data points were spline-interpolated to obtain timecontinuous information on net photosynthesis during the
whole period of cold exposure. The rate of raffinose synthesis, rSuc fi Raf, was calculated as already described for
starch, assuming that pools of raffinose and sucrose are
reversibly interconnected.
The rate of sucrose export to sink organs (rSuc fi Sinks)
was calculated as the difference between the spline-interpolated rates of net photosynthesis and of changes in the
carbohydrate pool.
FEBS Journal 278 (2011) 506–518 ª 2010 The Authors Journal compilation ª 2010 FEBS
T. Nagele et al.
ă
Systems biology of cold acclimation in A. thaliana
The rate of sucrose cleavage (rSuc fi Hex) was described
by an irreversible Michaelis–Menten enzyme kinetic, with
competitive inhibition by the product as described in [31]:
rA!B tị ẳ
Vmax;A cA tị
cB
Km;A ỵ cA tịị 1 ỵ Ki;B ị
The reaction rate rA fi B(t) depends on the substrate concentration cA(t), the maximum activity of the catalysing
enzyme (Vmax,A) and the enzyme specific substrate affinity,
expressed by Km,A. It also depends on the concentration of
the reaction product and the dissociation constant Ki,B for
inhibitor binding.
The rate of hexose-based sucrose synthesis was described
by the mass action rate law:
3
4
5
6
rA!B tị ẳ k cA tị
In this reaction kinetic, the reaction rate rAfiB(t) depends
on the substrate concentration cA(t) and the rate constant k.
The model code and a detailed description of the model
structure are provided in Docs S1a, S1b, S2a,b and S3).
The identification of unknown parameters (Vmax,A, Km,A,
Ki,B and k) was carried out by minimizing the cost function,
i.e. the sum of squared errors between simulated and measured states, by variation of the model parameters. The
identification process was performed with a particle swarm
pattern search method for bound constrained global optimization, as described in [33].
The model was implemented in the numerical software
matlab (Version 7.6.0.324, R2008a) with the software
packages systems biology toolbox2 and the sbpd Extension Package as described in [34]. Both matlab and systems biology toolbox2 are necessary for the performance
of model simulations using the sbsimulate function.
7
8
9
10
Statistics
ANOVAs and t-tests were performed with matlab (Version 7.6.0.324, R2008a).
11
Acknowledgements
We would like to thank S. Stutz for fruitful discussions
and for helping with measurements of enzyme activities at low temperature. We would also like to thank
A. Allinger for expertise in plant cultivation, and the
Landesgraduiertenforderung Baden-Wurttemberg at
ă
ă
the Universitat Stuttgart for nancial support.
ă
References
1 Boyer JS (1982) Plant productivity and environment.
Science 218, 443–448.
2 Stitt M & Hurry V (2002) A plant for all seasons: alterations in photosynthetic carbon metabolism during cold
12
13
14
acclimation in Arabidopsis. Curr Opin Plant Biol 5,
199–206.
Xin Z & Browse J (2000) Cold comfort farm: the acclimation of plants to freezing temperatures. Plant Cell
Environ 23, 893–902.
Guy CL, Huber JLA & Huber SC (1992) Sucrose phosphate synthase and sucrose accumulation at low temperature. Plant Physiol 100, 502–508.
Gilmour SJ, Sebolt AM, Salazar MP, Everard JD &
Thomashow MF (2000) Overexpression of the Arabidopsis CBF3 transcriptional activator mimics multiple
biochemical changes associated with cold acclimation.
Plant Physiol 124, 1854–1865.
Hannah MA, Wiese D, Freund S, Fiehn O, Heyer AG
& Hincha DK (2006) Natural genetic variation of
freezing tolerance in Arabidopsis. Plant Physiol 142,
98–112.
Kaplan F, Kopka J, Sung DY, Zhao W, Popp M,
Porat R & Guy CL (2007) Transcript and metabolite
profiling during cold acclimation of Arabidopsis reveals
an intricate relationship of cold-regulated gene expression with modifications in metabolite content. Plant J
50, 967–981.
Sasaki H, Ichimura K, Imada S & Yamaki S (2001)
Sucrose synthase and sucrose phosphate synthase, but
not acid invertase, are regulated by cold acclimation
and deacclimation in cabbage seedlings. J Plant Physiol
158, 847–852.
Strand A, Hurry V, Gustafsson P & Gardestrom P (1997)
ă
Development of Arabidopsis thaliana leaves at low temperatures releases the suppression of photosynthesis and
photosynthetic gene expression despite the accumulation
of soluble carbohydrates. Plant J 12, 605–614.
Strand A, Hurry V, Henkes S, Huner N, Gustafsson P,
Gardestrom P & Stitt M (1999) Acclimation of Arabidă
opsis leaves developing at low temperatures. Increasing
cytoplasmic volume accompanies increased activities of
enzymes in the Calvin cycle and in the sucrose-biosynthesis pathway. Plant Physiol 119, 1387–1397.
Hincha DK, Zuther E & Heyer AG (2003) The preservation of liposomes by raffinose family oligosaccharides
during drying is mediated by effects on fusion and lipid
phase transitions. Biochim Biophys Acta 1612, 172–177.
Klotke J, Kopka J, Gatzke N & Heyer AG (2004)
Impact of soluble sugar concentrations on the acquisition of freezing tolerance in accessions of Arabidopsis
thaliana with contrasting cold adaptation – evidence for
a role of raffinose in cold acclimation. Plant Cell Environ 27, 1395–1404.
Grant TN, Dami IE, Ji T, Scurlock D & Streeter J
(2009) Variation in leaf and bud soluble sugar concentration among Vitis genotypes grown under two temperature regimes. Can J Plant Sci 89, 961–968.
Strimbeck GR, Kjellsen TD, Schaberg PG & Murakami
PF (2008) Dynamics of low-temperature acclimation in
FEBS Journal 278 (2011) 506–518 ª 2010 The Authors Journal compilation ª 2010 FEBS
517
Systems biology of cold acclimation in A. thaliana
15
16
17
18
19
20
21
22
23
24
25
26
27
28
518
T. Nagele et al.
ă
temperate and boreal conifer foliage in a mild winter
climate. Tree Physiol 28, 1365–1374.
Zuther E, Buchel K, Hundertmark M, Stitt M, Hincha
ă
DK & Heyer AG (2004) The role of rafnose in the
cold acclimation response of Arabidopsis thaliana. FEBS
Lett 576, 169–173.
Yuan JS, Galbraith DW, Dai SY, Griffin P & Stewart
CN (2008) Plant systems biology comes of age. Trends
Plant Sci 13, 165–171.
Stelling J (2004) Mathematical models in microbial
systems biology. Curr Opin Microbiol 7, 513–518.
Sweetlove LJ, Last L & Fernie AR (2003) Predictive
metabolic engineering: a goal for systems biology. Plant
Physiol 132, 420–425.
Koster KL & Lynch DV (1992) Solute accumulation
and compartmentation during the cold acclimation of
puma rye. Plant Physiol 98, 108–113.
Lundmark M, Cavaco AM, Trevanion S & Hurry V
(2006) Carbon partitioning and export in transgenic
Arabidopsis thaliana with altered capacity for sucrose
synthesis grown at low temperature: a role for metabolite transporters. Plant Cell Environ 29, 1703–1714.
Wanner LA & Junttila O (1999) Cold-induced freezing
tolerance in Arabidopsis. Plant Physiol 120, 391–400.
Strand A, Foyer CH, Gustafsson P, Gardestrom P &
ă
Hurry V (2003) Altering ux through the sucrose biosynthesis pathway in transgenic Arabidopsis thaliana
modifies photosynthetic acclimation at low temperatures
and the development of freezing tolerance. Plant Cell
Environ 26, 523–535.
Miao M, Xu X, Chen X, Xue L & Cao B (2007) Cucumber
carbohydrate metabolism and translocation under chilling
night temperature. J Plant Physiol 164, 621–628.
Gottwald JR, Krysan PJ, Young JC, Evert RF & Sussman MR (2000) Genetic evidence for the in planta role
of phloem-specific plasma membrane sucrose transporters. Proc Natl Acad Sci USA 97, 13979–13984.
Sulpice R, Pyl E, Ishihara H, Trenkamp S, Steinfath
M, Witucka-Wall H, Gibon Y, Usadel B, Poree F,
Piques MC et al. (2009) Starch as a major integrator in
the regulation of plant growth. Proc Natl Acad Sci
USA 106, 10348–10353.
Sasaki Y, Takahashi K, Oono Y, Seki M, Yoshida R,
Shinozaki K & Uemura M (2008) Characterization of
growth-phase-specific responses to cold in Arabidopsis
thaliana suspension-cultured cells. Plant Cell Environ
31, 354–365.
Goldschmidt EE & Huber SC (1992) Regulation of
photosynthesis by end-product accumulation in leaves
of plants storing starch, sucrose, and hexose sugars.
Plant Physiol 99, 1443–1448.
Krapp A, Hofmann B, Schafer C & Stitt M (1993) Regulation of the expression of rbcs and other photosynthetic genes by carbohydrates – a mechanism for the
sink regulation of photosynthesis. Plant J 3, 817–828.
29 Moore BD, Cheng SH, Rice J & Seemann JR (1998)
Sucrose cycling, rubisco expression, and prediction of
photosynthetic acclimation to elevated atmospheric
CO2. Plant Cell Environ 21, 905–915.
30 Rohde P, Hincha DK & Heyer AG (2004) Heterosis in
the freezing tolerance of crosses between two Arabidopsis thaliana accessions (Columbia-0 and C24) that show
differences in non-acclimated and acclimated freezing
tolerance. Plant J 38, 790–799.
31 Naegele T, Henkel S, Hoermiller I, Sauter T, Sawodny
O, Ederer M & Heyer AG (2010) Mathematical modelling of the central carbohydrate metabolism in Arabidopsis thaliana reveals a substantial regulatory influence
of vacuolar invertase on whole plant carbon metabolism. Plant Physiol 153, 260–272.
32 Wiese A, Groner F, Sonnewald U, Deppner H, Lerchl
ă
J, Hebbeker U, Flugge U & Weber A (1999) Spinach
ă
hexokinase I is located in the outer envelope membrane
of plastids. FEBS Lett 461, 13–18.
33 Vaz AIF & Vicente LN (2007) A particle swarm pattern
search method for bound constrained gloabal optimization. J Glob Optim 39, 197–219.
34 Schmidt H & Jirstrand M (2006) Systems Biology Toolbox for MATLAB: a computational platform for
research in systems biology. Bioinformatics 22, 514–
515.
35 Tang X, Ruffner HP, Scholes JD & Rofle SA (1996)
Purification and characterization of soluble invertases
from leaves of Arabidopsis thaliana. Planta 198, 17–23.
36 Kingston-Smith AH, Walker RP & Pollock CJ (1999)
Invertase in leaves: conundrum or control point? J Exp
Bot 50, 735–743.
Supporting information
The following supplementary material is available:
Fig. S1. Simulation results of in silico experiment 1 for
hexoses (black) and sucrose (grey).
Fig. S2. Simulation results of in silico experiment 2 for
hexoses (black) and sucrose (grey).
Doc. S1a. Model structure of C24.
Doc. S1b. sbml format of model structure of C24.
Doc. S2a. Model structure of Rsch.
Doc. S2b. sbml format of model structure of Rsch.
Doc. S3. Documentation of the model structure.
This supplementary material can be found in the
online version of this article.
Please note: As a service to our authors and readers,
this journal provides supporting information supplied
by the authors. Such materials are peer-reviewed and
may be re-organized for online delivery, but are not
copy-edited or typeset. Technical support issues arising
from supporting information (other than missing files)
should be addressed to the authors.
FEBS Journal 278 (2011) 506–518 ª 2010 The Authors Journal compilation ª 2010 FEBS