Tài liệu Báo cáo khoa học: RMI1 deficiency in mice protects from diet and genetic-induced obesity pptx
Bạn đang xem bản rút gọn của tài liệu. Xem và tải ngay bản đầy đủ của tài liệu tại đây (328.75 KB, 10 trang )
RMI1 deficiency in mice protects from diet and
genetic-induced obesity
Akira Suwa
1
, Masayasu Yoshino
2
, Chihiro Yamazaki
3
, Masanori Naitou
2
, Rie Fujikawa
3
,
Shun-ichiro Matsumoto
2
, Takeshi Kurama
1
, Teruhiko Shimokawa
1
and Ichiro Aramori
2
1 Pharmacology Research Labs, Astellas Pharma Inc., Tsukuba, Ibaraki, Japan
2 Molecular Medicine Labs, Astellas Pharma Inc., Tsukuba, Ibaraki, Japan
3 Trans Genic Inc., Chuo-ku, Tokyo, Japan
Introduction
Obesity is a complex disorder and a major risk factor
for metabolic diseases such as type 2 diabetes mellitus,
hypertension and cardiovascular disease. This energy
balance disorder is controlled by multiple pathways.
Several genes are known to be responsible for obesity:
the genes obese (ob) [1], fat (fa) [2], agouti (ay) [3],
tubby (tub) [4] and diabetes (db) [5] have been identified
and characterized in genetically obese models.
However, other important molecules involved in the
regulation of energy homeostasis have yet to be
identified.
The exchangeable gene trap method is a powerful
strategy that could be used to locate single-gene defects
responsible for energy homeostasis disorders [6]. With
this method, it is possible to mutate the mouse genome
randomly on a large scale, and then isolate and
identify the mutated gene. Several other genes have
been identified by this method [7–9]. In this study, we
Keywords
E2F; energy homeostasis; gene trap;
high-fat diet; obesity; RMI1
Correspondence
A. Suwa, Department of Metabolic
Diseases, Pharmacology Research Labs,
Drug Discovery Research, Astellas Pharma
Inc., 21 Miyukigaoka, Tsukuba-shi, Ibaraki
305-8585, Japan
Fax: +81 29 852 5391
Tel: +81 29 863 6417
E-mail:
(Received 2 September 2009, revised 19
November 2009, accepted 24 November
2009)
doi:10.1111/j.1742-4658.2009.07513.x
The aim of this study is to discover and characterize novel energy homeo-
stasis-related molecules. We screened stock mouse embryonic stem cells
established using the exchangeable gene trap method, and examined the
effects of deficiency of the target gene on diet and genetic-induced obesity.
The mutant strain 0283, which has an insertion at the recQ-mediated gen-
ome instability 1 (RMI1) locus, possesses a number of striking features that
allow it to resist metabolic abnormalities. Reduced RMI1 expression, lower
fasting-blood glucose and a reduced body weight (normal diet) were
observed in the mutant mice. When fed a high-fat diet, the mutant mice
were resistant to obesity, and also showed improved glucose intolerance
and reduced abdominal fat tissue mass and food intake. In addition, the
mutants were also resistant to obesity induced by the lethal yellow agouti
(A
y
) gene. Endogenous RMI1 genes were found to be up-regulated in the
liver and adipose tissue of KK-A
y
mice. RMI1 is a component of the
Bloom’s syndrome gene helicase complex that maintains genome integrity
and activates cell-cycle checkpoint machinery. Interestingly, diet-induced
expression of E2F8 mRNA, which is an important cell cycle-related mole-
cule, was suppressed in the mutant mice. These results suggest that the reg-
ulation of energy balance by RMI1 is attributable to the regulation of food
intake and E2F8 expression in adipose tissue. Taken together, these find-
ings demonstrate that RMI1 is a novel molecule that regulates energy
homeostasis.
Abbreviations
AUC, area under the curve; A
y
, lethal yellow agouti; BLM, Bloom syndrome; RMI1, recQ-mediated genome instability 1.
FEBS Journal 277 (2010) 677–686 ª 2009 The Authors Journal compilation ª 2009 FEBS 677
screened gene-trapped mice to identify novel energy
balance-related genes. We describe here the phenotype
of mutant mouse strain 0283. This strain exhibited a
phenotype indicative of resistance to diet-induced and
genetic obesity. The mutation of the 0283 strain is in
the RMI1 gene.
RecQ-mediated genome instability 1 (RMI1) has
recently been identified as a member of the Bloom
syndrome (BLM)–topoisomerase complex [10]. This
complex is essential for the maintenance of genome
integrity, and can activate the cell-cycle checkpoint
machinery [11,12]. Depletion of RMI1 by siRNA leads
to reduced cell proliferation [13]. In addition, uncon-
trolled cell-cycle management in adipose tissue is asso-
ciated with obesity [14,15]. It has been shown that
several cell cycle-related molecules play an important
role in the development of obesity [16–21]. Therefore,
we hypothesize that RMI1 might modulate energy
homeostasis via regulation of cell-cycle progression in
metabolic tissues. In this study, we describe the associ-
ation between RMI1 and energy homeostasis as well
as the contribution of RMI1 to the regulation of E2F
expression, which is a well-documented cell cycle-
related molecule.
Results
In vivo phenotype-driven screening
We used a phenotype-driven in vivo approach to iden-
tify novel molecules involved in the regulation of
energy homeostasis. Using the gene trap vector pU-Ha-
chi, we performed random insertional mutagenesis, and
then replaced the b-geo gene with any gene of interest
through Cre-mediated integration. We isolated 100
trap mouse strains in this study. One of these lines was
the 0283 mutant strain, which exhibits a remarkable
obesity-resistant phenotype. All homozygous embryos
died; therefore heterozygous mice (RMI1+ ⁄ )) were
used for this study (RMI1 was identified as the target
gene of this mutant strain as described below). Body
and organ weights as well as plasma parameters
(Tables S2 and S3) were measured, and learning, mem-
ory and behavioral tests (Table S4) as well as histo-
pathological analysis (Table S5) were performed for 8-
week-old RMI1+ ⁄ ) mice fed normal laboratory chow.
Although RMI1+ ⁄ ) mice had a phenotype almost
equivalent to that of the wild-type (RMI1+ ⁄ +), body
weight and fasting-plasma glucose were significantly
lower in RMI1 + ⁄ ) mice (Table 1).
Resistance to diet-induced obesity in RMI1+/)
mice
Wild-type (RMI1+ ⁄ +) and heterozygous (RMI1+ ⁄ ))
littermate mice were created via in vitro fertilization
using a single RMI1+ ⁄ ) male. At 4 weeks of age, the
individually housed littermates were fed either a normal
diet or one in which 60% of the calories were from fat
(high-fat diet). These mice were kept for 14 weeks, and
monitored for body weight changes and food intake.
Initially, the male RMI1+ ⁄ ) mice weighed less than
their male RMI1+ ⁄ + littermates, and those fed a nor-
mal diet consistently weighed less than their RMI1+ ⁄ +
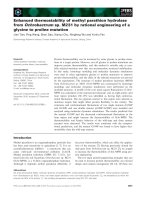
littermates during the entire 14 weeks (Fig. 1A). The
rate of weight gain was equivalent for both genotypes
fed a normal diet (Fig. 1B). In contrast, RMI1+ ⁄ ) mice
were more resistant to weight gain than RMI1+ ⁄ +
control mice under high-fat diet conditions (18.3% ver-
sus 13.7% at 14 weeks, P = 0.005, Fig. 1B). Food
intake was significantly lower for RMI1
+ ⁄ ) mice than
RMI1+ ⁄ + mice on the high-fat diet only, indicative of
selective weight control (Fig. 1C,D). The female
RMI1+ ⁄ ) mice exhibited the same phenotype
described above (data not shown). These results suggest
that the regulation of energy homeostasis was altered in
the RMI1+ ⁄ ) mice.
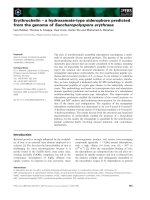
The RMI1+ ⁄ ) also gained less intra-abdominal fat
(gonadal fat volumes measured as intra-abdominal fat)
as a result of high-fat feeding compared to the wild-
type (Fig. 2B). In contrast, liver weights were unaltered
in the RMI1 + ⁄ ) mice compared to the wild-type, and
Table 1. Metabolic parameters for RMI1+ ⁄ + and RMI1+ ⁄ ) mice. Data for 10-week-old mice (n = 6 per genotype) fasted for 16 h are
shown. Plasma values are the means ± SEM of the measurements obtained. Asterisks indicate statistically significant differences compared
with RMI1+ ⁄ + mice (*P < 0.05; **P < 0.01; ***P < 0.001, Student’s t test).
Genotype
Body
weight (g)
Glucose
(mgÆdL
)1
)
Insulin
(ngÆmL
)1
)
Triglycerides
(mgÆdL
)1
)
HDL cholesterol
(mgÆdL
)1
)
LDL cholesterol
(mgÆdL
)1
)
Male RMI1+ ⁄ + 20.6 ± 0.2 120.7 ± 7.6 1.15 ± 0.22 32.0 ± 3.1 33.2 ± 2.6 60.5 ± 2.2
RMI1+ ⁄ ) 18.8 ± 0.4** 86.7 ± 2.8** 1.61 ± 0.50 40.3 ± 2.6 39.0 ± 1.2 65.3 ± 3.2
Female RMI1+ ⁄ + 17.2 ± 0.3 112.7 ± 6.1 0.68 ± 0.14 28.2 ± 3.6 26.8 ± 1.5 61.2 ± 4.0
RMI1+ ⁄ ) 15.5 ± 0.1 *** 80.3 ± 3.0*** 0.85 ± 0.25 26.5 ± 2.5 34.0 ± 1.7* 59.3 ± 3.4
RMI1 deficiency prevents diet and genetic-induced obesity A. Suwa et al.
678 FEBS Journal 277 (2010) 677–686 ª 2009 The Authors Journal compilation ª 2009 FEBS
did not differ between the two feeding conditions
(Fig. 2A). The blood glucose and plasma insulin con-
centrations in the fasted or fed state did not differ sig-
nificantly between RMI1+ ⁄ ) and RMI1+ ⁄ + mice at
14 weeks (Table 2). However, an oral glucose tolerance
test showed that diet-induced glucose intolerance
improved significantly in RMI1+ ⁄ ) mice (Fig. 2C,D).
Insulin levels did not differ between RMI1+ ⁄ + and
RMI1+ ⁄ ) mice in the oral glucose tolerance test
(Fig. 2E,F).
Resistance to KK- and KK-A
y
-induced genetic
induced obesity in RMI1+/) mice
To explore resistance to the development of obesity
under other conditions, we generated KK-a ⁄ a and
KK-A
y
⁄ a RMI1-deficient mice. KK mice are known
to be spontaneously hyperinsulinemic and hyperglyce-
mic. Introduction of the lethal yellow agouti gene (A
y
)
into KK mice resulted in a congenitally lethal yellow
obese KK mouse strain (KK-A
y
), which exhibits both
hyperphagia and severe features of type 2 diabetes.
Both the KK and KK-A
y
strains are useful for study-
ing therapies for the prevention of diabetes and obes-
ity. We thus crossed RMI1+ ⁄ ) mice with KK-A
y
to
obtain F
1
heterozygous mice (RMI1+ ⁄ ) xKKor
KK-A
y
gives RMI1+ ⁄ ) a⁄ a or RMI1+ ⁄ ) A
y
⁄ a,
respectively).
Between 7 and 14 weeks of age, both RMI1+ ⁄ ) a ⁄ a
and RMI1+ ⁄ ) A
y
⁄ a mice experienced a consistent and
significant reduction of body weight compared to their
wild-type littermates (Fig. 3A). Hyperphagia induced
by the A
y
mutation was significantly less in RMI1+ ⁄ )
mice than RMI1+/+. However, KK-crossed
RMI1+ ⁄ ) mice did not show altered food intake, even
though their body weight was reduced (Fig. 3B). The
intra-abdominal fat found in KK-crossed mice was not
present in RMI1+ ⁄ ) mice. Similarly, the fat found in
the KK-A
y
-crossed RMI1+/) mice was a tendency
towards reduction compared to KK-Ay F1 mice
(Fig. 3D). Additionally, the enlargement of the liver
observed in KK- and KK-A
y
crossed mice was signifi-
cantly reduced in RMI1+ ⁄ ) mice (Fig. 3C).
The fasted blood glucose concentration in
RMI1+ ⁄ ) a ⁄ a and RMI1+ ⁄ ) A
y
⁄ a mice was signifi-
cantly lower than in their RMI1+ ⁄ + littermates. The
non-fasted glucose did increase slightly in RMI1+ ⁄ )
a ⁄ a mice, and this increase was statistically significant
(Table 3). The oral glucose tolerance test indicated that
glucose tolerance improved in both RMI1+ ⁄ ) a ⁄ a
and RMI1+ ⁄ ) A
y
⁄ a mice (Fig. 3E,F).
RMI1 as the target gene of the mutant strain
We analyzed the insertion site of the trap vector to
identify the trapped gene. Genomic DNA fragments
flanking both the 5¢ and 3¢ ends of the integrated
vector were obtained using the plasmid rescue method.
Sequence analysis of this flanking genomic DNA
(Appendix S2) revealed that the trap vector was
20
16
18
RMI1+/+ ND
RMI1+/
–
ND
RMI1+/+ HF
** **
10
12
14
RMI1+/
–
HF
*
*
**
**
6
8
2
4
0
012345678910111213
Number of days fed diet
Body weight gain (%)
5.0
4.5
RMI1+/+ ND
RMI1+/
–
ND
3.5
4.0
3.0
***
*
2.0
2.5
Daily food intake (g)
0 1 2 3 4 5 6 7 8 9 1011121314
Number of days fed diet
45
40
RMI1+/+ ND
RMI1+/– ND
RMI1+/+ HF
30
35
RMI1+/– HF
****
**
**
**
**
**
**
**
20
25
**
**
**
**
**
**
** *
*
*
*
*
**
*
15
Body weight (g)
**
** **
**
**
**
10
0 1 2 3 4 5 6 7 8 9 10 11 12 13 14
Number of days fed diet
5.0
4.5
RMI1+/+ HF
RMI1+/– HF
3.5
4.0
***
*
*
*
3.0
**
**
**
***
*
*
*
*
*
*
*
*
2.5
2.0
0 1 2 3 4 5 6 7 8 9 10 11 12 13 14
Number of days fed diet
Daily food intake (g)
A
B
CD
**
Fig. 1. RMI1 heterozygous (RMI1+ ⁄ )) mice
fed a high-fat diet are resistant to weight
gain and are hypophagic. Male wild-type
(RMI1+ ⁄ +) and mutant (RMI1+ ⁄ )) mice
(n = 6 per group) were fed a normal diet
(ND; 10% of total kcal from fat) or a high-fat
diet (HF; 60% of total kcal from fat) for
14 weeks. (A) Body weight and (B) body
weight gain for RMI1+ ⁄ + and RMI1+ ⁄ )
mice over the feeding period. (C) The food
intake of the RMI1+ ⁄ ) mice does not
change when fed a normal diet. (D) The
food intake for the RMI1+ ⁄ ) mice is lower
than that for the RMI1+ ⁄ + mice when both
are fed a high-fat diet. Values are means ±
SEM. Asterisks indicate significant
differences: *P < 0.05, **P < 0.01,
***P < 0.001 versus RMI1+ ⁄ +.
A. Suwa et al. RMI1 deficiency prevents diet and genetic-induced obesity
FEBS Journal 277 (2010) 677–686 ª 2009 The Authors Journal compilation ª 2009 FEBS 679
inserted into the first exon of the RMI1 gene (Gen-
bank accession number NM_028904). We attempted to
confirm that RMI1 is the target gene of this mutant
mice using quantitative PCR. The RMI1 mRNA level
in the skeletal muscle, fat, hypothalamus and liver of
RMI1+ ⁄ ) mice was approximately half that in
RMI1+ ⁄ + mice (Fig. 4A), which indicates that RMI1
is the responsible gene for this mutant mouse strain.
Next we compared the expression levels of RMI1 in
various tissues from normal mice. RMI1 mRNA was
expressed ubiquitously in most tissues (Fig. S1). To
clarify the association between RMI1 and the develop-
ment of obesity, we examined the RMI1 mRNA levels
in KK-A
y
mice. Five-week-old KK-A
y
mice did not
exhibit the obese phenotype. Therefore, we compared
the RMI1 mRNA levels of KK-A
y
mice before
(5 weeks) and after (15 weeks) obesity was observable.
Interestingly, the RMI1 mRNA level increased signifi-
cantly in the liver and intra-abdominal fat of the obese
phenotype mice; however, that in the skeletal muscle
did not increase, and that in the subcutaneous fat actu-
ally decreased (Fig. 4B). These results suggested that
the level of RMI1 expression in the fat and liver is
associated with development of obesity.
RMI1 is the component of the BLM helicase com-
plex that maintains complex stability and aids in the
maintenance of genome integrity. RMI1 is also known
to regulate the cell-cycle checkpoint machinery. In fact,
400
300
350
** *
200
250
100
150
0
50
Blood glucose AUC
0–2 h (mg·dL
–1
)
+/+ +/–+/+ +/–
ND HF
4
4.5
RMI1+/+ ND
RMI1+/– ND
RMI1+/+ HF
2.5
3
3.5
RMI1+/– HF
1.5
2
0.5
1
Plasma insulin (ng·mL
–1
)
0
0 0.2 0.4 0.6
Time (h)
350
400
450
250
300
RMI1+/– HF
RMI1+/– ND
RMI1+/+ ND
RMI1+/+ HF
*
150
200
***
50
100
Blood glucose (mg·dL
–1
)
0
0 0.5 1 1.5 2
Time (h)
2
2.5
1.5
0.5
1
Liver (g)
0
+/+ +/++/– +/–
ND HF
2.5
3
*** **
1.5
2
1
0
0.5
Intra-abdominal fat (g)
+/+ +/– +/+ +/–
ND HF
1.40
1.60
1.80
**
1.00
1.20
0.60
0.80
0.20
0.40
Plasma insulin AUC
0–2 h (ng·mL
–1
)
0.00
+/+ +/–
+/+ +/–
ND
HF
AB
CD
EF
Fig. 2. RMI1 heterozygous (RMI1+ ⁄ )) mice
had less visceral adipose tissue and lower
glucose tolerance than wild-type (RMI1+/+)
on a high-fat diet. Male wild-type (RMI1+ ⁄ +)
and mutant (RMI1+ ⁄ )) mice (n = 6 per
group) were fed a normal diet (ND) or a
high-fat diet (HF) for 14 weeks. (A)
RMI1+ ⁄ ) mice do not differ from RMI1+ ⁄ +
mice in terms of liver weight. (B) The
amount of intra-abdominal fat was signifi-
cantly less in RMI1+ ⁄ ) than RMI1+/+ fed a
high-fat diet than RMI1+/+. (C) The blood
glucose concentration during the oral glu-
cose tolerance test was significantly lower
in RMI1+ ⁄ ) mice than RMI1+/+ at 1 and
2 h after glucose injection. (D) The
RMI1+ ⁄ ) mice fed a high-fat diet had a
lower area under the curve (AUC) than
RMI1+/+ for the plasma glucose concentra-
tion than RMI1+/+ between 0 and 2 h after
glucose injection. (E) Plasma insulin concen-
trations during the oral glucose tolerance
test. (F) AUC for plasma insulin levels
between 0 and 0.5 h after glucose injection.
Values are means ± SEM. Asterisks indicate
significant differences: *P < 0.05,
**P < 0.01, ***P < 0.001 versus RMI1+ ⁄ +.
RMI1 deficiency prevents diet and genetic-induced obesity A. Suwa et al.
680 FEBS Journal 277 (2010) 677–686 ª 2009 The Authors Journal compilation ª 2009 FEBS
it has been reported that using siRNA to deplete
RMI1 could reduce cell proliferation. Therefore, we
speculated that the RMI1 mechanism is important for
the regulation of energy balance and the quantitative
management of metabolic tissues. For this reason,
we investigated the change in expression of cell cycle-
related molecules in RMI1-deficient mice (Table 4).
We did not detect any changes in the expression of
Table 2. Metabolic parameters in RMI1+ ⁄ + and RMI1+ ⁄ ) mice fed a normal or high-fat (60% fat) diet for 14 weeks. Plasma levels are the
means ± SEM of measurements obtained. Asterisks indicate statistically significant differences compared with RMI1+ ⁄ + mice (*P < 0.05;
**P < 0.01, Student’s t test).
Body weight (g)
Glucose (mgÆdL
)1
) Insulin (ngÆmL
)1
)
Fed Fasted Fed Fasted
Normal diet RMI1+ ⁄ + 27.8 ± 0.9 123 ± 5.3 102 ± 6 1.7 ± 0.2 0.61 ± 0.05
RMI1+ ⁄ ) 24.5 ± 0.9* 125 ± 5.7 88 ± 7 1.5 ± 0.1 0.62 ± 0.04
High-fat diet RMI1+ ⁄ + 38.8 ± 0.8 140 ± 2.9 121 ± 3 3.6 ± 0.8 0.76 ± 0.06
RMI1+ ⁄ ) 31.8 ± 1.3** 156 ± 8.2 124 ± 9 3.2 ± 0.9 0.56 ± 0.08
1.4
1.6
**
P = 0.10
1.0
1.2
0.6
0.8
0.0
0.2
0.4
Intra-abdominal fat (g)
+/–+/+ +/–+/+
a/a A
y
/a
450
RMI1+/+ a/a
RMI1+/– a/a
300
350
400
RMI1+/+ A
y
/a
RMI1+/– A
y
/a
*
200
250
**
100
150
*
*
*
**
0
50
0 0.5 1 2
Blood glucose (mg·dL
–1
)
4.5
***
**
3.0
3.5
4.0
*
1.5
2.0
2.5
Liver (g)
0.0
0.5
1.0
+/+ +/– +/+ +/–
a/a A
y
/a
7.0
7.5
RMI1+/+ a/a
RMI1+/– a/a
RMI1+/+ A
y
/a
5.5
6.0
6.5
RMI1+/– A
y
/a
**
**
*
4.5
5.0
*
3.0
3.5
4.0
Daily food intake (g)
9 10111213
Age (weeks)
55
60
RMI1+/+ a/a
RMI1+/– a/a
RMI1+/+ A
y
/a
45
50
RMI1+/– A
y
/a
**
**
**
**
**
**
30
35
40
**
**
**
**
**
**
** **
** **
20
25
Body weight (g)
7 8 9 1011121314
Age (weeks)
700
*** *
500
600
**
300
400
100
200
Blood glucose AUC
0–2 h (mg·dL
–1
)
0
+/+ +/– +/+ +/–
a/a A
y
/a
AB
CD
EF
Fig. 3. RMI1 heterozygous (RMI1+ ⁄ )) mice
were resistant to the obesity, hyperphagia
and improved glucose intolerance induced
by the A
y
mutation. (A) RMI1 heterozygotes
(RMI1+ ⁄ ) a ⁄ a and RMI1+ ⁄ ) A
y
⁄ a) had
lower body weights than the KK or KK-A
y
mice (n = 12 per group). (B) RMI1+ ⁄ ) A
y
⁄ a
mice showed a significant reduction in the
hyperphagia induced by the Ay mutation.
At 14 weeks of age, the (C) liver weights
and (D) intra-abdominal fat weights for the
RMI1+ ⁄ ) mice (RMI1+ ⁄ ) a ⁄ a, RMI1+ ⁄ )
A
y
⁄ a) were less than those for the KK and
KK-A
y
F
1
mice. (E) The blood glucose
concentration during the oral glucose toler-
ance test was significantly lower in
RMI1+ ⁄ ) mice than the KK or KK-Ay F1
mice. (F) The RMI1+ ⁄ ) mice had a lower
AUC for the plasma glucose concentration
between 0 and 2 h after glucose administra-
tion than the KK or KK-A
y
F
1
mice. Values
are means ± SEM. Asterisks indicate signifi-
cant differences: *P < 0.05, **P < 0.01
versus RMI1+ ⁄ +.
A. Suwa et al. RMI1 deficiency prevents diet and genetic-induced obesity
FEBS Journal 277 (2010) 677–686 ª 2009 The Authors Journal compilation ª 2009 FEBS 681
E2F1, 4 or 5 mRNA in mice fed a high-fat diet. In
contrast, E2F8 mRNA was strongly induced by high-
fat feeding (7.1-fold increase over mice fed a normal
diet). Interestingly, the expression of E2F8 mRNA
induced in RMI1+ ⁄ ) mice was much less (60% sup-
pression) than that in RMI1+ ⁄ + mice. Recent reports
have indicated that the E2F family quantitatively regu-
lates adipose cells and thus plays an important role in
the development of obesity [21]. These results suggest
that E2F8 is associated with development of obesity
via cell-cycle regulation in the metabolic tissues, and,
in this study, regulation of E2F8 was found to be med-
iated by RMI1.
Given that RMI1-deficient mice have been found to
eat significantly less food under conditions of excessive
energy diets than under normal conditions, we com-
pared levels of RMI1 mRNA in the hypothalamus
between normal and high-fat feeding conditions. The
results showed that RMI1 mRNA levels were signifi-
cantly higher in the hypothalamus under high-fat feed-
ing conditions than under normal feeding (Fig. 4C).
In contrast, RMI1 expression was reduced under fast-
ing conditions. These results suggested that RMI1
might be associated with feeding behavior and energy
balance regulation. We then investigated whether or
not these changes were related to modulation of cen-
tral nervous system pathways. We compared expres-
sion levels of well-documented hypothalamic signaling
factors (namely neuropeptide Y, pro-opiomelanocortin,
cocaine- and amphetamine-regulated transcript),
Table 3. Metabolic parameters for RMI1+ ⁄ + and RMI1+ ⁄ ) mice crossed with KK or KK-A
y
mice. Data for 14-week-old mice are shown.
Plasma levels are the means ± SEM of the measurements obtained. Asterisks indicate statistically significant differences compared with
RMI1+ ⁄ + mice (*P < 0.05; **P < 0.01, Student’s t test). NEFA, non-esterified fatty acids.
Body
weight (g)
Glucose (mgÆdL
)1
) NEFA (mEqÆL
)1
)
Ketone bodies
(mgÆdL
)1
)
Triglycerides
(mgÆdL
)1
)
Fed Fasted Fed Fasted Fed Fasted Fed Fasted
a ⁄ a RMI1+ ⁄ + 37.2 ± 0.7 147 ± 1.7 126 ± 4 0.34 ± 0.03 0.58 ± 0.07 53 ± 27 1405 ± 189 268 ± 40 161 ± 15
RMI1+ ⁄ ) 31.8 ± 0.4*** 165 ± 2.7*** 113 ± 4* 0.34 ± 0.02 0.85 ± 0.1* 56 ± 11 1699 ± 103 257 ± 39 139 ± 13
Ay ⁄ a RMI1+ ⁄ + 51.0 ± 0.9 440 ± 11 175 ± 9 0.44 ± 0.03 0.32 ± 0.02 164 ± 17 1987 ± 241 460 ± 61 182 ± 21
RMI1+ ⁄ ) 44.3 ± 0.4*** 431 ± 9.6 150 ± 6* 0.37 ± 0.04 0.38 ± 0.03 191 ± 29 2545 ± 269 525 ± 39 153 ± 7
140
120
RMI1+/+
RMI1+/–
80
100
60
20
40
0
Relative expression of RMI1
Muscle Fat Hypo Liver
300
250
**
200
*
100
150
50
0
Muscle
515515515515
Age (week)
Relative expression of RMI1
Sub-fat Abd-fat Liver
120
130
*
**
*
100
110
70
80
90
50
60
Fed FedFast Fast
ND HF
Relative expression of RMI1
A
C
B
Fig. 4. Identification of RMI1 as the trapped
gene in RMI1+ ⁄ ) mice. (A) Expression of
RMI1 mRNA in wild-type (RMI1+ ⁄ +) and
RMI1 heterozygous (RMI1+ ⁄ )) mice. Hypo,
hypothalamus. (B) Expression of RMI1 in
normal (5 weeks of age) and obese
(15 weeks of age) KK-A
y
mice (n = 6 per
group). Sub, subcutaneous; Abd, intra-
abdominal. (C) Expression of RMI1 in the
hypothalamus under normal diet (ND) and
high-fat diet (HF) conditions (n = 8 per
group). Fast, 16 h fasted. Values are
means ± SEM. Asterisks indicate significant
differences: *P < 0.05, **P < 0.01.
RMI1 deficiency prevents diet and genetic-induced obesity A. Suwa et al.
682 FEBS Journal 277 (2010) 677–686 ª 2009 The Authors Journal compilation ª 2009 FEBS
Agouti-related protein, pro-melanin-concentrating hor-
mone and CPT1c) in the hypothalamus of RMI1-defi-
cient mice. No changes were noted in the expression
levels of these factors (Table S1).
Discussion
Using a random mutagenesis approach based on the
exchangeable gene trap method, we identified RMI1 as
a novel regulator of energy homeostasis. The attributes
of RMI1 heterozygous mice, which exhibited a typical
lean phenotype, observed in this study are as follows:
first, RMI1-deficient mice were resistant to obesity
resulting from a high-fat diet or genetics. Second,
RMI1-deficient mice fed a high-fat diet gained less
abdominal fat. Third, the RMI1-deficient mice ate sig-
nificantly less food under the excess energy feeding
conditions. Fourth, impaired glucose tolerance induced
by high-fat diet or genetic obesity was improved in the
RMI1-deficient mice. In addition, levels of RMI1
expression were higher in the abdominal fat, liver and
hypothalamus of obese model mice than normal mice.
We could not find any abnormalities in the RMI1-
deficient mice under normal conditions, except the
reduced body weight and lower fasting glucose. Of
note is the fact that the deficient mice showed a rate of
weight gain and amount of food intake equivalent to
those of wild-type mice under normal diet conditions.
These results indicate that deficient mice can grow nor-
mally despite development of basal abnormalities, sug-
gesting that resistance to developing obesity under
high-fat feeding conditions is directly due to the RMI1
deficiency. However, we could not exclude the possibil-
ity that these slight basal changes and as yet unidenti-
fied abnormalities can affect the energy balance
indirectly.
RMI1, an enzyme-binding protein, has previously
been reported to mediate DNA recombination, chro-
mosome organization and biogenesis, as well as regu-
lating the cell-cycle checkpoint machinery [10].
However, no evidence has linked it to energy homeo-
stasis. RMI1 is also a member of the BLM–topoisom-
erase complex. Mice with a targeted mutation of BLM
are developmentally delayed and die by embryonic day
13.5 [22,23]. Bloom’s syndrome is a rare recessive
genetic disorder characterized by dwarfism, telangiec-
tatic erythema, immune deficiency and a predisposition
toward cancer [13,24]. Recently, RMI1 was reported to
be an essential component of BLM protein complexes
[25]. This BLM phenotype may explain the lethality
seen in RMI1 homozygous mice. Although we did not
explore such phenotypes in this study, birth weight
reduction might show one aspect of the BLM pheno-
type, dwarfism. Further studies will be needed to
clarify whether the RMI1-deficient mice exhibit a
BLM-like phenotype.
Obesity develops as the result of an imbalance
between energy intake and expenditure. The reduction
of energy expenditure leads to an increase in fat mass,
ultimately resulting in obesity. The increase in cell
number (preadipocyte proliferation) and cell size (adi-
pocyte hypertrophy) is thought to be responsible for
the increase in the fat mass [14,15]. The cell cycle plays
an important role in preadipocyte proliferation, and is
regulated by several cell cycle-related proteins. RMI1
is known to be a cell cycle-related molecule with the
ability to activate the cell-cycle checkpoint machinery
[10], and siRNA depletion of RMI1 results in the
suppression of cell proliferation [13].
Sakai et al. have shown that a deficiency in the Skp2
gene, which encodes a cell cycle-related molecule,
results in resistance to obesity due to inhibition of
preadipocyte proliferation without causing adipocyte
hypertrophy [17]. This was found to be the case in
both the high-fat diet and Ay-induced obesity models.
Interestingly, the Skp2 knockout phenotype is very
similar to that of RMI1+ ⁄ ); however, Skp2 mRNA
levels were not altered in RMI1+ ⁄ ) mice. Fajas et al.
demonstrated that the E2F protein family also plays a
central role in preadipocyte proliferation, and that
E2F1-deficient mice are resistant to obesity induced by
a high-fat diet (due to the suppression of fat mass
accumulation) [21]. In this study, we found that the
high-fat diet upregulated E2F8 expression, but not that
of E2F1, E2F3 or E2F5. Interestingly, E2F8 upregula-
tion was suppressed in RMI1+ ⁄ ) mice. Although the
Table 4. Gene expression analysis in the adipose tissue of
RMI1+ ⁄ + and RMI1+ ⁄ ) mice fed a normal or high-fat (60% fat)
diet for 14 weeks. The relative amounts of mRNA are the means ±
SEM of the measurements obtained. Asterisks indicate statistically
significant differences compared with RMI1+ ⁄ + mice (*P < 0.05,
Student’s t test). E2F1, E2F transcription factor 1; E2F4, E2F tran-
scription factor 4; E2F5, E2F transcription factor 5; E2F8, E2F tran-
scription factor 8; MKP-1, MAP kinase phosphatase1; SKP2, S-
phase kinase-associated protein 2; p27, p27/Kip1 cyclin-dependent
kinase inhibitor.
Gene
Normal diet High-fat diet
RMI1+ ⁄ + RMI1+ ⁄ ) RMI1+ ⁄ + RMI1+ ⁄ )
E2F1 100 ± 10 88 ± 8 125 ± 8 127 ± 10
E2F4 100 ± 8 90 ± 4 82 ± 2 91 ± 10
E2F5 100±10 93±8 75±4 77±8
E2F8 100 ± 12 88 ± 11 710 ± 120 280 ± 53*
MKP-1 100±16 64±9 51±4 64±9
SKP2 100 ± 13 97 ± 7 128 ± 10 112 ± 11
p27 100 ± 9 102 ± 4 76 ± 7 87 ± 9
A. Suwa et al. RMI1 deficiency prevents diet and genetic-induced obesity
FEBS Journal 277 (2010) 677–686 ª 2009 The Authors Journal compilation ª 2009 FEBS 683
precise molecular mechanism underlying RMI1’s regu-
lation of E2F8 and its downstream targets has yet to
be clarified, our data indicate that RMI1 may be
essential for the E2F8-mediated proliferation of prea-
dipocytes. In fact, a deficiency in RMI1 could lead to
decreased adiposity due to deficits in E2F-driven prea-
dipocyte proliferation. However, other reports have
found that E2F8 reduces rather than induces cell pro-
liferation [26,27]. Recently, Hagemann et al. reported
that E2F8 has a novel function as a guanine nucleotide
exchange factor for heterotrimeric G proteins [28].
Given the disparity of these reports, elucidation of
E2F8’s functions and contribution to the regulation of
cell proliferation will require further experiments.
Increased energy intake also leads to an increase in
the fat mass, which ultimately results in obesity. The
deficiency in RMI1 significantly decreased the food
intake only under conditions of excessive energy diet.
These results suggest that regulation of the energy bal-
ance by RMI1 is due to changes in the food intake.
Peripheral secreted adipocytokines, such as leptin, can
regulate food intake via the central nervous system in
response to changes in body fat content [29]. It is well
established that hypothalamic neurocircuits and signal
transductions modulate feeding behavior, thereby regu-
lating energy homeostasis [30]. First, we investigated
the expression levels of RMI1 in the hypothalamus.
The results showed that RMI1 expression was signifi-
cantly increased in the hypothalamus under high-fat
feeding conditions, and decreased under fasting condi-
tions. Next we examined whether these changes in
feeding behavior were based on modulation of central
nervous system pathways. Previous studies have shown
that several hypothalamic signaling factors, such as
neuropeptide Y and pro-opiomelanocortin, affect feed-
ing behavior via central nervous system pathways [30].
In the present study, we did not find any changes in
the expression levels of these factors; however, the pos-
sibility that RMI1 regulates other hypothalamic signal-
ing molecules cannot be ruled out.
In summary, we have shown that RMI1 is a novel
regulator of energy homeostasis. This suggests the
exciting possibility that an RMI1 modulator may
improve several disorders linked to energy homeosta-
sis, such as obesity.
Experimental procedures
Establishment of mutant mice
The 0283 gene trap strain was isolated using a previously
described gene-trap method [31]. The gene trap vector
pU_Hachi comprises a splice acceptor region (SA) from the
mouse En-2 gene, lox71, an internal ribosomal entry site, a
b-alactosidase ⁄ neomycin phosphotransferase fusion gene (b-
geo), loxP, the SV40 polyadenylation sequence and pUC19.
The vector was electroporated into embryonic stem cells.
After selection for 9 days with 200 lgÆ mL
-1
geneticin, the
trapped clones were isolated. The chimeric male mice were
mated with C57BL ⁄ 6 females (CLEA Japan, Tokyo, Japan)
to obtain F1 heterozygotes. In this study, we used mice from
the F
3
to F
5
generations. Wild-type (RMI1+ ⁄ +) and
mutant (RMI1+ ⁄ )) littermate mice were produced using
in vitro fertilization to ensure that all mice in the study were
age-, sex- and littermate-matched. For the KK-A
y
experi-
ment, unfertilized eggs were collected from RMI1+ ⁄ )
females and fertilized in vitro with sperm from a KK-A
y
male (CLEA Japan). The genetic effects of the KK strain
and the A
y
mutation were investigated using F
1
mice. Only
male mice were used for the KK-A
y
experiment. For exami-
nation of the effects of high-fat feeding, 4-week-old mice
were fed a diet in which 60% of the calories were from fat.
The components of this high-fat diet were determined using
the method described by Ikemoto [32]. Briefly, the high-fat
diet contains 32% safflower oil, 33.1% casein, 17.6%
sucrose, 1.4% vitamin mixture, 9.8% mineral mixture, 5.6%
cellulose powder and 0.5% dl-methionine. Casein, sucrose
and the vitamin and mineral mixtures were purchased from
Oriental Yeast Co. Ltd (Tokyo, Japan), while the safflower
oil was purchased from Benibana Food (Tokyo, Japan) and
the dl-methionine from Wako Pure Chemical Industries
Ltd (Tokyo, Japan). The caloric density of this diet is
490 kcal per 100 g, with fat energy of 294.7 kcal per 100 g
(60.2%). The gonadal depots (representing intra-abdominal
fat) and liver tissues of of killed mice were removed and
weighed. All animal procedures were performed in accor-
dance with the international guidelines for biomedical
research involving animals (Council for International Orga-
nizations of Medical Science) and were approved by the
Animal Ethical Committee of Astellas Pharma Inc.
Characterization of the trapped gene
The previously described plasmid rescue method was used
to obtain the genomic DNA fragment flanking the insertion
site [31]. DNA samples for genotyping were isolated from
the severed tips of the mice tails. Genotyping was performed
by PCR using tail genomic DNA as the template.
Analysis of plasma constituents
Plasma samples were taken from the severed tail tips. Plasma
glucose, triglycerides, HDL cholesterol and LDL cholesterol
levels were determined using an enzyme assay method and
Hitachi Autoanalyzer model 7170 (Hitachi Seisakusho, Hit-
achi, Japan). The plasma insulin level was measured using an
insulin ELISA kit (Shibayagi, Gunma, Japan). In the KK-A
y
experiment, levels of glucose, triglycerides, non-esterified
RMI1 deficiency prevents diet and genetic-induced obesity A. Suwa et al.
684 FEBS Journal 277 (2010) 677–686 ª 2009 The Authors Journal compilation ª 2009 FEBS
fatty acids and ketone bodies were measured using the glu-
cose CII-test reagent, triglyceride G-test reagent, NEFA C-
test reagent and Autokit total ketone bodies reagent, respec-
tively (all from Wako, Osaka, Japan).
Glucose tolerance test
Oral glucose tolerance tests were performed using the fol-
lowing procedures. After 16 h of fasting, the mice received
a single oral injection of glucose solution (1.5 gÆkg
)1
for
the high-fat feeding study or 2.0 gÆkg
)1
for the KK-A
y
study), at time 0. Plasma samples for glucose measure-
ment were taken from the severed tail tips at 0.1, 0.5, 1.0
and 2 h.
Expression analysis of mRNA
The tissue samples were pulverized in liquid nitrogen, and
the total RNA was extracted using an Isogen kit (Nippon
Gene, Tokyo, Japan) according to the manufacturer’s
instructions. cDNAs were synthesized using SuperScript III
(Invitrogen, Carlsbad, CA, USA). Target mRNAs were
quantified via RT-PCR and the SYBR green method using
a PRISM 7900 sequence detector according to the manu-
facturer’s instructions (Perkin-Elmer Applied Biosystems,
Foster City, CA, USA). The level of mouse ribosomal pro-
tein (P0) was measured as an internal control. The primers
for each target gene are listed in Appendix S1.
Statistical analysis
The data represent the means ± SEM. The statistical sig-
nificance of the difference between groups was determined
using Student’s t test. P values < 0.05 were considered sig-
nificant. Statistical and data analyses were performed using
the sas 8.2 software package (SAS Institute Japan Ltd,
Tokyo, Japan).
Acknowledgements
We thank Drs Kiyoshi Furuichi, Masao Kato, Mas-
ayuki Shibasaki, Hitoshi Matsushime, Masato Kobori,
Jiro Hirosumi and Mr Tsutomu Higashiya at Astellas
Pharma Inc., and Junko Kawano and Akemi Mats-
uoka at Trans Genic Inc. for their helpful advice and
support.
References
1 Zhang Y, Proenca R, Maffei M, Barone M, Leopold L &
Friedman JM (1994) Positional cloning of the mouse obese
gene and its human homologue. Nature 372, 425–432.
2 Naggert JK, Fricker LD, Varlamov O, Nishina PM,
Rouille Y, Steiner DF, Carroll RJ, Paigen BJ & Leiter
EH (1995) Hyperproinsulinaemia in obese fat ⁄ fat mice
associated with a carboxypeptidase E mutation which
reduces enzyme activity. Nat Genet 10, 135–142.
3 Wilson BD, Ollmann MM, Kang L, Stoffel M, Bell GI
& Barsh GS (1995) Structure and function of ASP, the
human homolog of the mouse agouti gene. Hum Mol
Genet 4, 223–230.
4 Kleyn PW, Fan W, Kovats SG, Lee JJ, Pulido JC, Wu
Y, Berkemeier LR, Misumi DJ, Holmgren L, Charlat O
et al. (1996) Identification and characterization of the
mouse obesity gene tubby: a member of a novel gene
family. Cell 85, 281–290.
5 Tartaglia LA, Dembski M, Weng X, Deng N, Culpep-
per J, Devos R, Richards GJ, Campfield LA, Clark FT,
Deeds J et al. (1995) Identification and expression clon-
ing of a leptin receptor, OB-R. Cell 83, 1263–1271.
6 Yamamura K & Araki K (2008) Gene trap mutagenesis
in mice: new perspectives and tools in cancer research.
Cancer Sci 99, 1–6.
7 Imaizumi T, Araki K, Miura K, Araki M, Suzuki M,
Terasaki H & Yamamura K (1999) Mutant mice lack-
ing Crk-II caused by the gene trap insertional mutagen-
esis: Crk-II is not essential for embryonic development.
Biochem Biophys Res Commun 266, 569–574.
8 Miyata K, Oike Y, Hoshii T, Maekawa H, Ogawa H,
Suda T, Araki K & Yamamura K (2005) Increase of
smooth muscle cell migration and of intimal hyperplasia
in mice lacking the a ⁄ b hydrolase domain containing 2
gene. Biochem Biophys Res Commun 329, 296–304.
9 Semba K, Araki K, Li Z, Matsumoto K, Suzuki M, Nak-
agata N, Takagi K, Takeya M, Yoshinobu K, Araki M
et al. (2006) A novel murine gene, Sickle tail, linked to the
Danforth’s short tail locus, is required for normal develop-
ment of the intervertebral disc. Genetics 172, 445–456.
10 Mankouri HW & Hickson ID (2007) The RecQ heli-
case–topoisomerase III–Rmi1 complex: a DNA struc-
ture-specific ‘dissolvasome’? Trends Biochem Sci 32,
538–546.
11 Raynard S, Zhao W, Bussen W, Lu L, Ding YY,
Busygina V, Meetei AR & Sung P (2008) Functional
role of BLAP75 in BLM-topoisomerase IIIa-dependent
Holliday junction processing. J Biol Chem 283, 15701–
15708.
12 Chang M, Bellaoui M, Zhang C, Desai R, Morozov P,
Delgado-Cruzata L, Rothstein R, Freyer GA, Boone C
& Brown GW (2005) RMI1 ⁄ NCE4, a suppressor of
genome instability, encodes a member of the RecQ heli-
case ⁄ Topo III complex. EMBO J 24, 2024–2033.
13 Yin J, Sobeck A, Xu C, Meetei AR, Hoatlin M, Li L &
Wang W (2005) BLAP75, an essential component of
Bloom’s syndrome protein complexes that maintain
genome integrity. EMBO J 24, 1465–1476.
14 Hausman DB, Digirolamo M, Bartness TJ, Hausman
GJ & Martin RJ (2001) The biology of white adipocyte
proliferation. Obes Rev 2, 239–254.
A. Suwa et al. RMI1 deficiency prevents diet and genetic-induced obesity
FEBS Journal 277 (2010) 677–686 ª 2009 The Authors Journal compilation ª 2009 FEBS 685
15 Avram MM, Avram AS & James WD (2007) Subcuta-
neous fat in normal and diseased states: 3. Adipogene-
sis: from stem cell to fat cell. J Am Acad Dermatol 56,
472–492.
16 Abella A, Dubus P, Malumbres M, Rane SG, Kiyoka-
wa H, Sicard A, Vignon F, Langin D, Barbacid M &
Fajas L (2005) Cdk4 promotes adipogenesis through
PPARc activation. Cell Metab 2, 239–249.
17 Sakai T, Sakaue H, Nakamura T, Okada M, Matsuki
Y, Watanabe E, Hiramatsu R, Nakayama K, Nakay-
ama KI & Kasuga M (2007) Skp2 controls adipocyte
proliferation during the development of obesity. J Biol
Chem 282, 2038–2046.
18 Konishi M, Asaki T, Koike N, Miwa H, Miyake A &
Itoh N (2006) Role of Fgf10 in cell proliferation
in white adipose tissue. Mol Cell Endocrinol 249, 71–77.
19 Zhang J-W, Tang Q-Q, Vinson C & Lane MD (2004)
Dominant-negative C ⁄ EBP disrupts mitotic clonal
expansion and differentiation of 3T3-L1 preadipocytes.
Proc Natl Acad Sci USA 101, 43–47.
20 Asaki T, Konishi M, Miyake A, Kato S, Tomizawa M
& Itoh N (2004) Roles of fibroblast growth factor 10
(Fgf10) in adipogenesis in vivo. Mol Cell Endocrinol
218, 119–128.
21 Fajas L, Landsberg RL, Huss-Garcia Y, Sardet C, Lees
JA & Auwerx J (2002) E2Fs regulate adipocyte differen-
tiation. Dev Cell 3, 39–49.
22 Chester N, Kuo F, Kozak C, O’Hara CD & Leder P
(1998) Stage-specific apoptosis, developmental delay,
and embryonic lethality in mice homozygous for a tar-
geted disruption in the murine Bloom’s syndrome gene.
Genes Dev 12, 3382–3393.
23 Luo GSI, McDaniel LD, Nishijima I, Mills M, Yous-
soufian H, Vogel H, Schultz RA & Bradley A (2000)
Cancer predisposition caused by elevated mitotic recom-
bination in Bloom mice. Nat Genet 26, 424–429.
24 German J (1995) Bloom’s syndrome. Dermatol Clin 13,
7–18.
25 Wu L, Bachrati CZ, Ou J, Xu C, Yin J, Chang M,
Wang W, Li L, Brown GW & Hickson ID (2006)
BLAP75 ⁄ RMI1 promotes the BLM-dependent dissolu-
tion of homologous recombination intermediates. Proc
Natl Acad Sci USA 103, 4068–4073.
26 Christensen J, Cloos P, Toftegaard U, Klinkenberg D,
Bracken AP, Trinh E, Heeran M, Di Stefano L & Helin
K (2005) Characterization of E2F8, a novel E2F-like
cell-cycle regulated repressor of E2F-activated transcrip-
tion. Nucleic Acids Res 33 , 5458–5470.
27 Maiti B, Li J, de Bruin A, Gordon F, Timmers C,
Opavsky R, Patil K, Tuttle J, Cleghorn W & Leone G
(2005) Cloning and characterization of mouse E2F8,
a novel mammalian E2F family member capable of
blocking cellular proliferation. J Biol Chem 280, 18211–
18220.
28 Hagemann IS, Narzinski KD & Baranski TJ (2007)
E2F8 is a nonreceptor activator of heterotrimeric G
proteins. J Mol Signal 2, 1–11.
29 Porte D Jr, Baskin DG & Schwartz MW (2002) Leptin
and insulin action in the central nervous system. Nutr
Rev 60, 85–87.
30 Wilding JPH (2002) Neuropeptides and appetite con-
trol. Diabet Med 19, 619–627.
31 Araki K, Imaizumi T, Sekimoto T, Yoshinobu K,
Yoshimuta J, Akizuki M, Miura K, Araki M &
Yamamura K (1999) Exchangeable gene trap using
the Cre ⁄ mutated lox system. Cell Mol Biol 45,
737–750.
32 Ikemoto S, Takahashi M, Tsunoda N, Maruyama K,
Itakura H & Ezaki O (1996) High-fat diet-induced
hyperglycemia and obesity in mice: differential effects of
dietary oils. Metabolism 45, 1539–1546.
Supporting information
The following supplementary material is available:
Fig. S1. Distribution of RMI1 mRNA in adult mouse
tissues.
Table S1. Gene expression analysis in the hypothala-
mus of RMI1+ ⁄ + and RMI1+ ⁄ ) mice fed a normal
or high-fat diet for 14 weeks.
Table S2. Biochemical findings.
Table S3. Hematological findings and absolute organ
weights.
Table S4. Water field multiple T-maze test for lear-
nings and open field test for behavior.
Table S5. Histopathological findings.
Appendix S1. Primers for each target gene.
Appendix S2. Genomic DNA fragments obtained by
plasmid rescue.
This supplementary material can be found in the
online version of this article.
Please note: As a service to our authors and readers,
this journal provides supporting information supplied
by the authors. Such materials are peer-reviewed and
may be re-organized for online delivery, but are not
copy-edited or typeset. Technical support issues arising
from supporting information (other than missing files)
should be addressed to the authors.
RMI1 deficiency prevents diet and genetic-induced obesity A. Suwa et al.
686 FEBS Journal 277 (2010) 677–686 ª 2009 The Authors Journal compilation ª 2009 FEBS