Tài liệu Báo cáo khoa học: Loose interaction between glyceraldehyde-3-phosphate dehydrogenase and phosphoglycerate kinase revealed by fluorescence resonance energy transfer–fluorescence lifetime imaging microscopy in living cells doc
Bạn đang xem bản rút gọn của tài liệu. Xem và tải ngay bản đầy đủ của tài liệu tại đây (545.11 KB, 9 trang )
Loose interaction between glyceraldehyde-3-phosphate
dehydrogenase and phosphoglycerate kinase revealed by
fluorescence resonance energy transfer–fluorescence
lifetime imaging microscopy in living cells
Yosuke Tomokuni
1
, Kenji Goryo
1
, Ayako Katsura
1
, Satoru Torii
1
, Ken-ichi Yasumoto
1
,
Klaus Kemnitz
2
, Mamiko Takada
3
, Hiroshi Fukumura
3
and Kazuhiro Sogawa
1
1 Department of Biomolecular Sciences, Graduate School of Life Sciences, Tohoku University, Aoba-ku Sendai, Japan
2 EuroPhoton GmbH, Berlin, Germany
3 Department of Chemistry, Graduate School of Science, Tohoku University, Aoba-ku Sendai, Japan
Introduction
It has been demonstrated that consecutive enzymes in
a number of metabolic pathways may form readily dis-
sociable enzyme–enzyme complexes by which interme-
diary metabolites are directly transferred from one
enzyme to the next without being released into the
aqueous environment [1,2]. In the glycolytic and glu-
coneogenic pathways, pairs of enzymes – aldolase and
glyceraldehyde-3-phosphate dehydrogenase (GAPDH),
GAPDH and phosphoglycerate kinase (PGK), GAP-
DH and lactate dehydrogenase, and aldolase and fruc-
tose-1,6-bisphosphatase – are reported to form loose
complexes [1,2]. Of these enzyme pairs, GAPDH and
PGK constitute the sixth and seventh reactions in the
glycolytic pathway. GAPDH is a homotetramer with a
Keywords
FLIM; FRET; GAPDH; loose interaction; PGK
Correspondence
K. Sogawa, Department of Biomolecular
Sciences, Graduate School of Life Sciences,
Tohoku University, Aoba-ku Sendai
980-8578, Japan
Fax: +81 22 795 6594
Tel: +81 22 795 6590
E-mail:
(Received 14 April 2009, revised 7
December 2009, accepted 24 December
2009)
doi:10.1111/j.1742-4658.2010.07561.x
Loose interaction between the glycolytic enzymes glyceraldehyde-3-phos-
phate dehydrogenase (GAPDH) and phosphoglycerate kinase (PGK) was
visualized in living CHO-K1 cells by fluorescence resonance energy transfer
(FRET), using time-domain fluorescence lifetime imaging microscopy.
FRET between active tetrameric subunits of GAPDH linked to cerulean or
citrine was observed, and this FRET signal was significantly attenuated by
coexpression of PGK. Also, direct interaction between GAPDH–citrine
and PGK–cerulean was observed by FRET. The strength of FRET signals
between them was dependent on linkers that connect GAPDH to citrine
and PGK to cerulean. A coimmunoprecipitation assay using hemaggluti-
nin-tagged GAPDH and FLAG-tagged PGK coexpressed in CHO-K1 cells
supported the FRET observation. Taken together, these results demon-
strate that a complex of GAPDH and PGK is formed in the cytoplasm of
living cells.
Structured digital abstract
l
MINT-7386555: PGK (uniprotkb:P00558) physically interacts (MI:0915) with GAPDH (uni-
protkb:
P04406)byanti tag coimmunoprecipitation (MI:0007)
l
MINT-7386573: GAPDH (uniprotkb:P04406) and PGK (uniprotkb:P00558) bind (MI:0407)
by fluorescent resonance energy transfer (
MI:0055)
l
MINT-7386590: GAPDH (uniprotkb:P04406) and GAPDH (uniprotkb:P04406) bind
(
MI:0407)byfluorescent resonance energy transfer (MI:0055)
Abbreviations
DAPI, 4¢,6-diamidino-2-phenylindole; FLIM, fluorescence lifetime imaging microscopy; FRET, fluorescence resonance energy transfer;
GAPDH, glyceraldehyde-3-phosphate dehydrogenase; GFP, green fluorescent protein; HA, hemagglutinin; IRF, instrumental response
function; PGK, phosphoglycerate kinase; TRITC, tetramethylrhodamine isothiocyanate.
1310 FEBS Journal 277 (2010) 1310–1318 ª 2010 The Authors Journal compilation ª 2010 FEBS
subunit size of 34 000–38 000 Da, and PGK acts as a
monomer with a molecular mass of 44 000 Da. In
most bacteria, the genes encoding these two enzymes
form an operon, and in animals, the two enzymes,
together with some other glycolytic enzymes, are
upregulated by hypoxic stress [3,4].
The dynamic complex has been hard to demon-
strate, as enzyme–enzyme complexes are not stable
and are thus not isolatable. Several lines of evidence
for the presence of the GAPDH–PGK complex were
obtained by in vitro biochemical studies using concen-
trated, purified enzymes. Association of PGK with
GAPDH was demonstrated by utilizing gel penetra-
tion analysis or by using immobilized GAPDH on
CNBr-activated Sepharose [5–7]. Interaction between
the enzymes was observed by measuring changes in
the fluorescence intensity of fluorescein isothiocya-
nate-labeled PGK in the presence or absence of GAP-
DH [8]. Furthermore, Weber and Bernhard presented
kinetic evidence obtained using purified enzymes from
rabbit muscle for substrate channeling through the
complex of GAPDH and PGK [9]. However, it was
also reported that the complex was easily decomposed
by changes in experimental conditions, such as pH
shifts or increased salt concentrations. Several con-
flicting results were also reported that argued against
the existence of the complex and channeling of
metabolites [10,11]. Thus, the existence of the com-
plex has not been universally accepted. In addition to
the cytoplasmic compartment, GAPDH and PGK are
known to form a functional complex at synaptic vesi-
cles in neurons and sarcoplasmic membranes in mus-
cle cells for local ATP production that is tightly
coupled with their membrane transport function
[12,13].
Determination of fluorescence resonance energy
transfer (FRET) between two fluorescent proteins
using fluorescence lifetime imaging microscopy (FLIM)
is a technique for the observation of protein–protein
interactions [14,15]. This method can be applied to
interactions in loose complexes in living cells, and has
an advantage in that the FRET strength is solely
dependent upon the distance between and relative ori-
entation of two fluorophores, being independent of the
strength of protein–protein interactions. In the case of
very weak interactions as described in this article,
rapid association and dissociation of FRET pairs may
also reduce FRET efficiency. We applied this FRET–
FLIM technique to direct observation of the interac-
tion between GAPDH and PGK chimeric proteins
linked to cerulean [16] or citrine [17], a FRET pair, in
living cells.
Results and Discussion
Effect of PGK on the interaction between
subunits of GAPDH
Expression plasmids for GAPDH and PGK linked to
cerulean or citrine were introduced into CHO-K1 cells.
As shown in Figs 1A and S1A, transiently expressed
GAPDH–citrine (chimeric protein with N-terminal
GAPDH and C-terminal citrine) and citrine–GAPDH
(chimeric protein with N-terminal citrine and C-terminal
GAPDH) were localized in the cytoplasm. PGK–ceru-
lean (chimeric protein with N-terminal PGK and
C-terminal cerulean) and cerulean–PGK (chimeric pro-
tein with N-terminal cerulean and C-terminal PGK)
were present throughout the cell. These results agree
with the subcellular localization of endogeneous GAP-
DH and PGK in HeLa cells (Fig. 1A). These proteins
were resolved by size exclusion column chromatography
(Figs 1B,C and S1B,C). GAPDH–citrine and citrine–
GAPDH were eluted at the position corresponding to
tetramers, and no tetramers containing chimeric pro-
teins and endogenous GAPDH monomers were found,
suggesting that the interfaces needed for the formation
of tetramers are mutually incompatible between
human and Chinese hamster GAPDH (Figs 1B and
S1B). A similar result was obtained when cell extracts
containing GAPDH–cerulean (chimeric protein with
N-terminal GAPDH and C-terminal cerulean) or ceru-
lean–GAPDH (chimeric protein with N-terminal ceru-
lean and C-terminal GAPDH) were analyzed by
chromatography (Fig. S1). Chimeric proteins of PGK
and cerulean were eluted at the position corresponding
to monomers (Figs 1C and S1C). It is not clear why
endogenous PGK activity showed a broad peak.
The decay curve of cerulean–GAPDH was analyzed
by two-exponential fitting (Fig. 2). Lifetimes of ceru-
lean–GAPDH were calculated to be 1.41 and 3.59 ns,
with fraction ratios of 36.8% and 63.2%, respectively
(Table 1). This fluorescence decay was considerably
accelerated in the presence of citrine–GAPDH by
energy transfer (Fig. 2B). Short and long lifetimes, s
1
and s
2
, were reduced to 1.06 and 3.13 ns, respectively.
In order to examine the stability of the instrument, the
fluorescence of cerulean–GAPDH was repeatedly
measured. As shown in Fig. 2C, the second decay
curve completely overlapped with the first one. We
also repeatedly measured the donor fluorescence of
cells expressing cerulean–GAPDH and citrine–GAP-
DH after sequential measurements of donor and
acceptor fluorescence (Fig. 2C). Perfectly overlapped
decay curves for the first and second measurements
Y. Tomokuni et al. FRET imaging of interaction between GAPDH and PGK
FEBS Journal 277 (2010) 1310–1318 ª 2010 The Authors Journal compilation ª 2010 FEBS 1311
were obtained. These results indicate that the FLIM
apparatus used in this study had enough stability for
the FLIM measurements, and suggest that minimal
photodynamic reactions such as photobleaching
occurred in the live cells during measurements. Fluo-
rescence corresponding to a reduction in donor life-
times was observed in the decay curve of acceptors
(Fig. 2B). The FRET signal was decreased by the co-
expression of PGK (Fig. 2D), and corresponding to
this reduction, a fluorescence rise in the decay curve of
citrine–GAPDH was hardly observed (Fig. 2D). This
attenuated FRET signal suggests that the binding of
PGK resulted in a conformational change of GAPDH
tetramers to separate donors and acceptors. Represen-
tative fluorescence lifetime images, which were pro-
duced by single-exponential fitting, were shown in
Fig. 2E. Lifetimes of cerulean–GAPDH were similar
all over the cell except for the nucleus, in which ceru-
lean–GAPDH was not expressed and no lifetimes were
exhibited. The lifetimes in the cytoplasm were reduced
by the coexpression of citrine–GAPDH, but coexpres-
sion of PGK did not affect the lifetimes. Coexpression
of citrine–GAPDH and PGK weakly decreased the
lifetimes of cerulean–GAPDH in the cytoplasm, con-
firming the results shown in Fig. 2B,D. The lifetimes
analyzed by the two-exponential fitting are summarized
in Table 1. During FRET measurements, very weak
background signals (below 5% of donor fluorescence
intensity) due to autofluorescence of CHO-K1 cells
were observed (data not shown). Chi-square values of
the fitting were between 1.0 and 1.2, as shown in
Table 1. Using a typical decay result, the chi-square
value was plotted against the lifetime as shown in
10
40
50 60
20
30
40
50
0
Fraction no.
0
2
4
6
8
10
12
14
15 25 35 45
GAPDH activity / mU
Fraction no.
Fraction no.
Fraction no.
25 30 35
45 50 55
670 158 44 17 kDa
138 69 44 kDa
WB : anti-GFP
118
98
52
kDa
– GCGY CGYG PC CP
WB : anti-GFP
WB : anti-GAPDH
WB : anti-GFP
WB : anti-PGK
PGK activity / mU
Anti-GAPDH
Anti-PGK
GAPDH–citrine
PGK–cerulean
TRITC DAPI Merge
Citrine
Cerulean
DAPI Merge
DAPI Merge
A
B
C
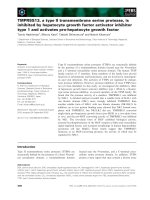
Fig. 1. Subcellular localization and enzymatic activities of GAPDH–
citrine and PGK–cerulean. (A) Expression of GAPDH–citrine and
PGK–cerulean. Localization of endogenous GAPDH and PGK in
HeLa cells was examined by using antibodies against GAPDH and
PGK, respectively, followed by incubation in TRITC-conjugated sec-
ondary antibody. Chimeric proteins, GAPDH–citrine and PGK–
cerulean, were transiently expressed in CHO-K1 cells by DNA
transfection, using the lipofection method. Forty hours after trans-
fection, fluorescence of cerulean and citrine moieties of the chime-
ric proteins was observed with an Olympus BX50 fluorescent
microscope with a filter set (Olympus U-MCFPHQ and U-MY-
FPHQ). Scale bars: 20 lm. The fluorescent color of 4¢,6-diamidino-
2-phenylindole (DAPI) in the cells expressing PGK–cerulean was
changed from blue to red on a computer. The results of western
blot (WB) analysis using whole cell extracts of cells transfected
with plasmids for GAPDH–cerulean (GC), GAPDH–citrine (GY), ceru-
lean–GAPDH (CG), citrine–GAPDH (YG), PGK–cerulean (PC) and
cerulean–PGK (CP) are shown. (B, C) Size exclusion chromatogra-
phy of whole cell extracts with expression of GAPDH–citrine (B)
and PGK–cerulean (C). Cell extracts (0.15 mL) of CHO-K1 cells
were applied to a column (Waters Superdex 200 for GAPDH and
Superdex 75 for PGK; 1 · 30 cm). Elution was performed at room
temperature at a flow rate of 0.4 mLÆmin
)1
with Hepes ⁄ NaOH buf-
fer (pH 7.9). Fractions of 0.4 mL were collected. Thyroglobulin
(670 kDa), c-globulin (158 kDa), serum albumin dimer (138 kDa),
serum albumin (69 kDa), ovalbumin (44 kDa) and myoglobin
(17 kDa) were used as size markers. Determination of enzyme
activity for GAPDH and PGK and immunoblot analysis were per-
formed as described in Experimental procedures. Filled circles
show the activity of cells transfected with plasmids for chimeric
proteins. Endogenous GAPDH and PGK activity from untransfected
cells are shown as dashed lines.
FRET imaging of interaction between GAPDH and PGK Y. Tomokuni et al.
1312 FEBS Journal 277 (2010) 1310–1318 ª 2010 The Authors Journal compilation ª 2010 FEBS
Fig. S2. The chi-square values used for Table 2 showed
minimal values of the curves, suggesting that the two-
exponential fitting of the decay curves was performed
properly.
Interaction between GAPDH and PGK
Changes in the FRET signals observed above suggest a
direct interaction between GAPDH and PGK. Direct
Q
P
R
O
N
N
N
N
4.0 nm
7.8 nm
7.2 nm
GAPDHCitrine
GAPDHCerulean
+
12 a.a.
12 a.a.
A
B
C
D
E
Intensity/a.u.
450–500 nm
IRF
CG (n = 6)
CG + YG (n = 7)
1
0.1
Intensity/a.u.
550–600 nm
IRF
YG (n = 7)
CG + YG (n = 7)
1
0.1
Intensity/a.u.
Time/ns
450–500 nm
IRF
CG + PGK (n = 6)
CG + YG + PGK
(n = 6)
0246810
Time/ns
0246810
Time/ns
0246810
Time/ns
0246810
Time/ns
0246810
Time/ns
0246810
1
0.1
Intensity/a.u.
550–600 nm
IRF
YG + PGK (n = 5)
CG + YG + PGK
(n = 7)
1
0.1
CG CG + YG CG + PGK CG + YG + PGK
2.0
2.5
3.0
3.5
4.0
(ns)
Intensity/a.u.
450–500 nm
IRF
CG (first)
CG (second)
1
0.1
Intensity/a.u.
450–500 nm
IRF
CG + YG (first)
CG + YG (second)
1
0.1
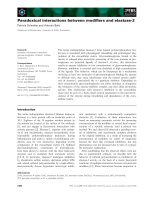
Fig. 2. FRET between cerulean–GAPDH
and citrine–GAPDH monomers constituting
hybrid tetramers. (A) Structure of
fluorescent chimeric GAPDH proteins and
tetrameric structure of GAPDH. The
structure of chimeric proteins is
schematically shown on the left. The linker
peptide connecting cerulean or citrine to
GAPDH is 12 amino acids long, with the
sequence SGLRSRAQASNS. The tetrameric
structure of GAPDH is schematically shown
on the right. The distances between the N-
terminal amino acids of subunits O and P,
subunits O and Q and subunits O and R are
shown (B–D). FLIM analysis of the
interaction between cerulean–GAPDH and
citrine–GAPDH in living CHO-K1 cells. CHO-
K1 cells were transfected with plasmids
encoding cerulean–GAPDH (CG) and citrine–
GAPDH (YG), together with a plasmid for
PGK (D) or with pCMV vector with no insert
(B). The fluorescence decay curves of
cerulean (blue) and citrine (green) represent
an average of fluorescence decay data
obtained from the cytoplasmic area of the
observed cells. The decay curve of
separately expressed cerulean–GAPDH and
citrine–GAPDH (black) in the presence or
absence of coexpressed PGK is also shown.
The shapes of the recorded IRF are shown
in red. Experiments were performed at least
three times, and representative results from
one experiment are shown. A typical result
of repeated measurements of cerulean–
GAPDH fluorescence is also shown in (C).
After sequential measurement of cerulean–
GAPDH and citrine–GAPDH, a second
measurement was performed on the same
cell, and decay curves obtained from the
first (shown in red) and second
measurements (shown in blue) are shown.
(E) FLIM images of cerulean–GAPDH in the
presence of citrine–GAPDH and ⁄ or PGK. A
lifetime map was made from time-
correlated single-photon-counting data by
fitting the data to a single exponential
decay. In the FLIM map, color corresponds
to the fluorescence lifetime indicated by a
false color scale. Scale bars: 20 lm.
Y. Tomokuni et al. FRET imaging of interaction between GAPDH and PGK
FEBS Journal 277 (2010) 1310–1318 ª 2010 The Authors Journal compilation ª 2010 FEBS 1313
interaction between the two enzymes was determined by
the simultaneous expression of GAPDH–citrine and
PGK–cerulean. We expressed three pairs of chimeric
proteins to determine FRET signals with different sizes
of linkers connecting GAPDH or PGK to fluorescent
proteins (Fig. 3). These proteins were relatively evenly
expressed, as shown in Fig. 3D. FRET signals were
observed between GAPDH–citrine and PGK–cerulean
only when fluorescent proteins and enzymes were con-
nected with linkers of five or 10 amino acids, and not
when they were linked by seven amino acids. In agree-
ment with this result, lifetimes of PGK–5aa–cerulean
and PGK–10aa–cerulean expressed in the cytoplasm,
but not in the nucleus, were reduced when acceptors,
GAPDH–5aa–citrine and GAPDH–10aa–citrine,
respectively, were coexpressed as shown in the FLIM
images (Fig. 3A,C) and in Table 2. On the other hand,
the lifetimes of PGK–7aa–cerulean and their intracellu-
lar distribution remained unchanged when GAPDH–
7aa–citrine was coexpressed (Fig. 3B and Table 2). This
finding indicates that induction of FRET does not sim-
ply depend on the length of linkers. In the linker con-
taining seven amino acids, a Pro-Pro sequence that is
not contained in other linkers is incorporated. This less
flexible structure may inhibit fluorophores to allow an
orientation and a position suitable for energy transfer.
In agreement with these data, coimmunoprecipitation
experiments in whole CHO-K1 cell extracts demon-
strated a specific interaction of GAPDH with PGK,
albeit at very low efficiency (Fig. 3E). Although we also
examined FRET signals using the other combinations of
GAPDH and PGK, GAPDH–citrine versus cerulean–
PGK, citrine–GAPDH versus cerulean–PGK, and
citrine–GAPDH versus PGK–cerulean, no FRET sig-
nals were obtained (data not shown).
Lifetimes of fluorescent proteins in living cells can
be changed without energy transfer to acceptor fluores-
cent proteins. Tramier et al. reported that lifetimes of
cyan fluorescent protein in living cells can be changed
under strong illumination by a mercury lamp [18]. It is
also possible for energy transfer to occur from donors
to endogenous acceptors such as flavins. In addition to
lifetime measurements of donors, analysis of the decay
curve of the acceptor may eliminate possible errors.
We analyzed fluorescent decay curves of the acceptor
and obtained, in almost all cases, a clear fluorescence
rise in the curve corresponding to the extent of reduc-
tion of donor lifetimes. A detailed analysis of fluores-
cence rise in the acceptor decay curve revealed that it
is included as a negative component with the same life-
time as that of the FRET component in the donor
curve (M. Takada et al., unpublished observation).
Besides glycolysis and gluconeogenesis, GAPDH and
PGK have different functions in the nucleus. PGK acts
Table 1. Fluorescence decay data for cerulean–GAPDH in the presence or absence of citrine–GAPDH and ⁄ or PGK expressed in living
CHO-K1 cells. a
1
and a
2
are the exponential coefficients for the s
1
and s
2
decay times, respectively. n, number of cells examined.
Protein combination a
1
(%) s
1
(ns) a
2
(%) s
2
(ns) n v
2
Cerulen–GAPDH 36.8 1.41 ± 0.21
a
63.2 3.59 ± 0.13
a
6 1.0–1.1
Cerulean–GAPDH Citrine–GAPDH 39.6 1.06 ± 0.09
a,b
60.4 3.13 ± 0.07
a,b
6 1.0–1.1
Cerulean–GAPDH PGK 39.9 1.43 ± 0.20 60.1 3.63 ± 0.19 6 1.0–1.2
Cerulean–GAPDH Citrine–GAPDH PGK 41.4 1.29 ± 0.05
b
58.6 3.44 ± 0.10
b
6 1.0–1.1
a
The differences between the two s
1
values and the two s
2
values were significant (P < 0.005 for s
1
and P < 0.001 for s
2
).
b
The
differences between the two s
1
values and the two s
2
values were significant (P < 0.001).
Table 2. Fluorescence decay data for PGK–cerulean in the presence or absence of GAPDH–citrine expressed in living CHO-K1 cells. a
1
and
a
2
are the exponential coefficients for the s
1
and s
2
decay times, respectively. Data are derived from the whole area (in the case of cell
samples without coexpression of GAPDH) or from the cytoplasmic area (in the case of cell samples with coexpression of GAPDH) of cells,
and are expressed as mean ± standard deviation. n, number of cells examined.
Protein combination a
1
(%) s
1
(ns) a
2
(%) s
2
(ns) n v
2
PGK–5aa–cerulean 37.1 1.39 ± 0.05
a
62.9 3.62 ± 0.05
a
6 1.0–1.2
PGK–5aa–cerulean GAPDH–5aa–citrine 42.2 1.19 ± 0.07
a
58.8 3.27 ± 0.14
a
6 0.8–1.0
PGK–7aa–cerulean 43.4 1.32 ± 0.05
c
56.6 3.46 ± 0.09
c
6 1.0–1.1
PGK–7aa–cerulean GAPDH–7aa–citrine 43.8 1.33 ± 0.05
c
56.2 3.39 ± 0.11
c
5 1.0–1.1
PGK–10aa–cerulean 31.2 1.37 ± 0.06
b
68.8 3.56 ± 0.06
b
6 0.9–1.1
PGK–10aa–cerulean GAPDH–10aa–citrine 41.1 1.24 ± 0.12
b
58.9 3.31 ± 0.11
b
7 0.9–1.0
a
The differences between the two s
1
values and the two s
2
values were significant (P < 0.001).
b
The differences between the two s
1
values and the two s
2
values were significant (P < 0.05 for s
1
and P < 0.001 for s
2
).
c
The differences between the two s
1
values and the
two s
2
values were not significant (P > 0.05).
FRET imaging of interaction between GAPDH and PGK Y. Tomokuni et al.
1314 FEBS Journal 277 (2010) 1310–1318 ª 2010 The Authors Journal compilation ª 2010 FEBS
WB : anti-GFP
P5C
P7C
P10C
G5Y
G7Y
G10Y
WB
Input
HA–GAPDH
FLAG–PGK
+
–
+
+
IP : anti-FLAG
Anti-HA
Anti-FLAG
Anti-HA
Anti-FLAG
Intensity / a.u.
Time/ns
450–500 nm
IRF
P5C
n = 6)
P5C + G5Y (
n = 6)
0246810
1
0.1
Intensity / a.u.
Time/ns
550–600 nm
IRF
G5Y (
n = 6)
P5C + G5Y (
n = 6)
0246810
1
0.1
Intensity / a.u.
Time/ns
450–500 nm
IRF
P7C
n = 6)
P7C + G7Y (
n = 5)
0246810
1
0.1
Intensity / a.u.
Time/ns
550–600 nm
IRF
G5Y (
n = 6)
P5C + G5Y (n = 5)
0246810
1
0.1
Intensity / a.u.
Time/ns
450–500 nm
IRF
P10C (
n = 5)
P10C + G10Y (
n = 7)
0246810
1
0.1
Intensity / a.u.
Time/ns
550–600 nm
IRF
G10Y (
n = 5)
P10C + G10Y (
n = 7)
0246810
1
0.1
PGK Cerulean
GAPDH Citrine
5 a.a.
A
B
C
DE
+
5 a.a.
P5C P5C + G5Y
3.0
2.0
2.5
3.5
4.0
(ns)
PGK Cerulean
GAPDH Citrine
7 a.a.
+
7 a.a.
PGK Cerulean
GAPDH Citrine
10 a.a.
+
10 a.a.
P10C P10C + G10Y
3.0
2.0
2.5
3.5
4.0
P7C P7C + G7Y
3.0
2.0
2.5
3.5
4.0
(ns)
(ns)
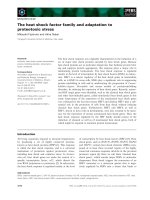
Fig. 3. Interaction between PGK–
cerulean and GAPDH–citrine. Chimeric
plasmids for PGK linked to cerulean and
GAPDH linked to citrine with different
lengths of linker peptides were
constructed and introduced into CHO-K1
cells: (A) five amino acids (TPVAT for
GAPDH; MPVAT for PGK); (B) seven
amino acids (TDPPVAT for GAPDH;
MDPPVAT for PGK); and (C) 10 amino
acids (TDPGAGPVAT for GAPDH;
MDPGAGPVAT for PGK). P5C, PGK–
5aa–cerulean; G5Y, GAPDH–5aa–citrine;
P7C, PGK–7aa–cerulean; G7Y, GAPDH–
7aa–citrine; P10C, PGK–10aa–cerulean;
G10Y, GAPDH–10aa–citrine. The
fluorescence decay curves of cerulean
(blue) and citrine (green) represent an
average of fluorescence decay data
obtained from the cytoplasmic area of
the observed cells. For comparison, the
decay curve of PGK–cerulean without
acceptor (left, black) and GAPDH–citrine
without donor (right, black) is also
shown. The shapes of the recorded IRF
are shown in red. Experiments were
separately performed at least three
times, and representative results from
one experiment are shown. FLIM
images of donors and donors
coexpressed with acceptors are shown
on the right. Lifetime maps were made
from time-correlated single-photon-
counting data by fitting data to a single
exponential decay. In the FLIM maps,
color corresponds to the fluorescence
lifetime indicated by a false color scale.
Scale bars: 20 lm. (D) Expression of
PGK and GAPDH chimeric proteins.
Expression plasmids were transfected
into CHO-K1 cells, and proteins were
subjected to SDS ⁄ PAGE, transferred to
nitrocellulose membranes, and probed
with antibody against GFP. (E)
Coimmunoprecipitation analysis of
GAPDH and PGK in cell extracts
obtained from CHO-K1 cells transfected
with expression plasmids for HA–
GAPDH and FLAG–PGK; 0.7% input is
shown.
Y. Tomokuni et al. FRET imaging of interaction between GAPDH and PGK
FEBS Journal 277 (2010) 1310–1318 ª 2010 The Authors Journal compilation ª 2010 FEBS 1315
as a primer recognition protein, a cofactor of DNA
polymerase a [19]. GAPDH has a uracil DNA glycosy-
lase activity [20] and has substantial involvement in
apoptosis in neural cells through interaction with p53
[21]. A tight association between GAPDH and PGK
would inhibit these functions, although convincing evi-
dence for the existence of independent entities in such
functions was not presented. Loose interaction between
the two enzymes enables interactions of an enzyme with
other proteins that are necessary for these functions.
The dynamic complex is difficult to demonstrate,
because of its inherent instability. Our FRET–FLIM
system may serve as a valuable tool for investigating
weak interactions in the complex in living cells.
Experimental procedures
Plasmid construction
Human full-length GAPDH cDNA was cloned from a
cDNA library of HepG2 cells. Human PGK cDNA
(pQE16–hPGK1) was kindly provided by K. Mizumoto
(Kitasato University), and pcerulean-N1, pcerulean-C1, pci-
trine-N1 and pcitrine-C1 were constructed by site-directed
mutagenesis, using corresponding plasmids for cyan fluores-
cent protein and yellow fluorescent protein as templates.
For the construction of pcerulean–hGAPDH or pcitrine–
hGAPDH, cDNA for GAPDH was amplified by
PCR, using the synthetic oligonucleotides 5¢-CGGAA
TTCCA TGGGG AAGGT GAAGG TCGG-3¢ and 5¢-
GGCGG ATCCT TACTC CTTGG AGGCC ATGTG GG-3¢
as primers. After digestion of the synthesized fragment by
EcoRI and BamHI, the fragment was inserted between the
EcoRI and BamHI sites of pcerulean-C1 or pcitrine-C1.
phGAPDH–7aa–citrine and phGAPDH–5aa–citrine were
similarly constructed using the primers 5¢-CGG
AA TTCCG ATGGG GAAGG TGAAG GTCGG-3¢ and
5¢-CGGAA TTCCG ATGGG GAAGG TGAAG GTCG
G-3¢, and 5¢-CGGAA TTCCG ATGGG GAAGG TGA
AG GTCGG-3¢ and 5¢-CGACC GGTGT CTCCT TGG
AG GCCAT GTGGG-3¢, respectively, and pcitrine-N1.
phPGK1–7aa–cerulean and phPGK1–5aa–cerulean were
constructed using the primers 5¢-CCGGA ATTCC
AATGT CGCTT TCTAA CAAGC T-3¢ and 5¢-GGCGG
ATCCA TAATA TTGCT GAGAG CATCC A-3¢, and 5¢-
CCGGA ATTCC AATGT CGCTT TCTAA CAAGC T-3¢
and 5¢-CGACC GGTAT AATAT TGCTG AGAGC AT-
CCA-3¢, respectively, and pQE16–hPGK1 as template
DNA. After digestion of the synthesized fragment by
EcoRI and BamHI, the resulting fragments were inserted
between the EcoRI and BamHI sites of pcerulean-N1.
pcerulean–hPGK1 was constructed using the primers 5¢-
CCGGA ATTCG ATGTC GCTTT CTAAC AAGCT-3¢ an d
5¢-GGCGG ATCCT TAAAT ATTGC TGAGA GCATC
C-3¢, a nd pcerulean-C1. For the construction of phGAPDH–
10aa–citrine, the synthetic oligonucleotides 5¢-GAT-
CC GGGCG CCGGA-3¢ and 5¢-CCGGT CCGGC GCCCG-
3¢ were inserted between the AgeIandBam
HI sites of
phGAPDH–7aa–citrine. phPGK1–10aa–cerulean was similarly
constructed using t he synthetic oligonucleotides 5¢-GAT-
CC GGGCG CCGGA-3¢ and 5¢-CCGGT CCGGC GCCCG-
3¢, and phPGK1–7aa–cerulean. pCMV–hGAPDH was
constructed by self-ligation of the blunt-ended AgeI–BspEI
fragment of pcerulean–hGAPDH. pCM V–hPGK1 was s imi-
larly constructed using pcitrine–hPGK1. p BOS–hemagglutinin
(HA)–hGAPDH and pBOS–FLAG–hPGK1 were constructed
by inserting t he blunt-ended EcoRI–BamHI fragments of
pcerulean–hGAPDH and pcerulean–hPGK1 into the EcoRV
site of pBOS–HA and pBOS–FLAG vectors, respectively. A ll
plasmid construc ts w ere ve rified by DNA sequencing.
Cell culture and DNA transfection
CHO-K1 cells were obtained from the Cell Resource Center
for Biomedical Research, Institute of Development, Aging
and Cancer, Tohoku University, and grown on a poly(d-
lysine)-coated glass-bottomed culture dish (35 mm; Mat-
TeK Corporation, Ashland, MA, USA) in phenol red-free
DMEM (Gibco, Frederick, MD, USA) supplemented with
10% fetal bovine serum, 1% nonessential amino acid solu-
tion (Gibco), 2 mml-glutamine (Sigma-Aldrich, St Louis,
MO, USA), and 40 lgÆmL
)1
kanamycin. DNA (0.5 lg)
consisting of equal amounts of each expression plasmid was
introduced into CHO-K1 cells by the lipofection method,
using FuGENE 6 transfection reagent (Roche, Basel, Swit-
zerland). Cells were incubated for 40 h after transfection
and observed with a FLIM microscope.
Immunofluorescence staining
HeLa cells were fixed with 3% formaldehyde and immu-
nostained using rabbit polyclonal antibody against GAP-
DH (diluted 1 : 50) (Trevigen, Gaithersburg, MD, USA)
or rabbit polyclonal antibody against PGK1 (diluted
1 : 50) (Abgent), followed by tetramethylrhodamine isothi-
ocyanate (TRITC)-conjugated secondary antibody (diluted
1 : 100) (Santa Cruz Biotechnology, Santa Cruz, CA,
USA).
Size exclusion chromatography and enzyme
assays
Whole cell extracts of cells transfected with plasmids for
GAPDH–citrine and PGK–cerulean were subjected to size
exclusion chromatography using Superdex 200 and Superdex
75, respectively (GE Healthcare, Little Chalfont, UK).
GAPDH and PGK activities were determined by the meth-
ods of Velick [22] and Yoshida [23], respectively.
FRET imaging of interaction between GAPDH and PGK Y. Tomokuni et al.
1316 FEBS Journal 277 (2010) 1310–1318 ª 2010 The Authors Journal compilation ª 2010 FEBS
Western blotting and immunoprecipitation
Whole cell extracts were prepared by mixing CHO-K1 cells
transfected with plasmids encoding chimeric fluorescent
proteins with 10 mm Hepes buffer (pH 7.9), containing
0.1 mm EDTA, 0.4 m NaCl, 1 mm dithiothreitol, 5%
glycerol, and protease inhibitor cocktail (Nacarai Tesque,
Kyoto, Japan). Proteins were resolved by 7.5–10%
SDS ⁄ PAGE, and transferred to a nitrocellulose membrane
(GE Healthcare). Rabbit polyclonal antibody against green
fluorescent protein (GFP) (Takara Bio, Otsu, Japan)
(diluted 1 : 1000), rabbit polyclonal antibody against GAP-
DH (diluted 1 : 1000) (Trevigen) and rabbit polyclonal anti-
body against PGK1 (diluted 1 : 500) (Abgent, San Diego,
CA, USA) were used as the first antibodies. The antibody
against GFP reacted with cerulean more strongly than with
citrine. Horseradish peroxidase-linked goat anti-(rabbit
IgG) (Vector Laboratories, Burlingame, CA, USA) was
used as the second antibody. The membrane was developed
with the ECL Plus detection system (GE Healthcare).
CHO-K1 cells were transfected with plasmids for HA-
tagged GAPDH and FLAG-tagged PGK, harvested, lysed,
and exposed to FLAG–affinity agarose beads (Sigma-
Aldrich) that had been pretreated with antibody against
FLAG. Proteins bound to washed beads were eluted,
boiled, and separated by SDS ⁄ PAGE. After electrophoresis,
the proteins were blotted onto a nitrocellulose membrane
and probed with antibody against HA.
FLIM measurements
FLIM measurements were performed as described previ-
ously [24]. The emission lifetimes of fluorescent cells were
measured on an inverted microscope (Zeiss: Axiovert 135,
·100 oil immersion objective with numerical aperture of
1.3) equipped with a disk anode microchannel plate photo-
multiplier (Europhoton, Berlin, Germany), which can detect
photons in a time-resolved and space-resolved fashion by
using a time-correlated single-photon-counting technique.
Spatial resolution can be obtained with a quadrant anode,
the details of which are given elsewhere [25,26]. The excita-
tion source was a 410 nm picosecond diode laser (full width
at half-maximum of 78 ps; LDH-P-C-400, PicoQuant,
Berlin, Germany), which illuminates a relatively large area
of approximately 100 lm in diameter, and was operated at
a repetition rate of 10 MHz. Average excitation power was
estimated to be 15 mWÆcm
)2
, which is equivalent to the
single-photon-counting level. The instrumental response
function (IRF) was recorded as reflected excitation light, as
shown in Figs 2 and 3. Fluorescence from live cell samples
incubated at 37 °C was sequentially collected at
475 ± 25 nm for cerulean and 575 ± 25 nm for citrine by
bandpass filters at a count rate below about 0.5 counts
(pixelÆs)
)1
. The acquisition time of the donor and acceptor
fluorescence was about 20 min, giving rise to peak values of
approximately 2000 photon counts. Fluorescence lifetime
data were analyzed using global analysis with multiexpo-
nential decays [27].
Statistical analysis
The statistical significance was determined using Student’s
t-test, and P-values < 0.05 were considered to be significant.
Acknowledgements
We thank K. Mizumoto (Kitasato University) for the
generous gift of human PGK1 cDNA. This work was
supported in part by a Grant-in-Aid for research from
the Ministry of Education, Culture, Sports, Science
and Technology of Japan. K. Kemnitz acknowledges
support from NMP4-2005-013880.
References
1 Srivastava DK & Bernhard SA (1986) Metabolite trans-
fer via enzyme–enzyme complexes. Science 234, 1081–
1086.
2 Srere PA (1987) Complexes of sequential metabolic
enzymes. Annu Rev Biochem 56, 89–124.
3 Eikmanns BJ (1992) Identification, sequence analysis,
and expression of a Corynebacterium glutamicum gene
cluster encoding the three glycolytic enzymes glyceralde-
hyde-3-phosphate dehydrogenase, 3-phosphoglycerate
kinase, and triosephosphate isomerase. J Bacteriol 174,
6076–6086.
4 Shih S-C & Claffey KP (1998) Hypoxia-mediated regu-
lation of gene expression in mammalian cells. Int J Exp
Pathol 79, 347–357.
5 Malhotra OP, Prabhakar P, Sen Gupta T & Kayastha
AM (1995) Phosphoglycerate-kinase–glyceraldehyde-
3-phosphate-dehydrogenase interaction. Molecular mass
studies. Eur J Biochem 227, 556–562.
6 Fokina KV, Dainyak MB, Nagradova NK & Muronetz
VI (1997) A study on the complexes between human
erythrocyte enzymes participating in the conversions of
1,3-diphosphoglycerate. Arch Biochem Biophys 345 ,
185–192.
7 Ashmarina LI, Muronetz VI & Nagradova NK (1985)
Yeast glyceraldehyde-3-phosphate dehydrogenase.
Evidence that subunit cooperativity in catalysis can be
controlled by the formation of a complex with phos-
phoglycerate kinase. Eur J Biochem 149, 67–72.
8 Sukhodolets MV, Muronetz VI & Nagradova NK
(1987) Interaction between D-glyceraldehyde-3-phos-
phate dehydrogenase and 3-phosphoglycerate kinase
labeled by fluorescein-5¢-isothiocyanate: evidence that
the dye participates in the interaction. Biochem Biophys
Res Commun 161, 187–195.
Y. Tomokuni et al. FRET imaging of interaction between GAPDH and PGK
FEBS Journal 277 (2010) 1310–1318 ª 2010 The Authors Journal compilation ª 2010 FEBS 1317
9 Weber JP & Bernhard SA (1982) Transfer of 1,3-di-
phosphoglycerate between glyceraldehyde-3-phosphate
dehydrogenase and 3-phosphoglycerate kinase via an
enzyme–substrate–enzyme complex. Biochemistry 21,
4189–4194.
10 Vas M & Batke J (1981) Evidence for absence of an
interaction between purified 3-phosphoglycerate kinase
and glyceraldehyde-3-phosphate dehydrogenase. Bio-
chim Biophys Acta 13, 193–198.
11 Vas M & Batke J (1990) Kinetic misinterpretation of a
coupled enzyme reaction can lead to the assumption of
an enzyme–enzyme interaction. The example of 3-phos-
pho-D-glycerate kinase and glyceraldehyde-3-phosphate
dehydrogenase couple. Eur J Biochem 191, 679–683.
12 Ikemoto A, Bole DG & Ueda T (2003) Glycolysis and
glutamate accumulation into synaptic vesicles. Role of
glyceraldehyde phosphate dehydrogenase and 3-phos-
phoglycerate kinase. J Biol Chem 278, 5929–5940.
13 Singh P, Salih M, Leddy JJ & Tuana BS (2004) The
muscle-specific calmodulin-dependent protein kinase
assembles with the glycolytic enzyme complex at the
sarcoplasmic reticulum and modulates the activity of
glyceraldehyde-3-phosphate dehydrogenase in a
Ca2+ ⁄ calmodulin-dependent manner. J Biol Chem 279,
35176–35184.
14 Wallrabe H & Periasamy A (2005) Imaging protein
molecules using FRET and FLIM microscopy. Curr
Opin Biotechnol 16, 19–27.
15 Becker W, Bergmann A, Hink MA, Konig K, Benndorf
K & Biskup C (2004) Fluorescence lifetime imaging by
time-correlated single-photon counting. Microsc Res
Tech 63, 58–66.
16 Rizzo MA, Springer GH, Granada B & Piston DW
(2004) An improved cyan fluorescent protein variant
useful for FRET. Nat Biotech 22, 445–449.
17 Heikal AA, Hess ST, Baird GS, Tsien RY & Webb WW
(2000) Molecular spectroscopy and dynamics of intrinsi-
cally fluorescent proteins: coral red (dsRed) and yellow
(Citrine). Proc Natl Acad Sci USA 97, 11996–12001.
18 Tramier M, Zahid M, Mevel J-C, Masse M-J &
Coppey-Moisan M (2006) Sensitivity of CFP ⁄ YFP
and GFP ⁄ mCherry pairs to donor photobleaching on
FRET determination by fluorescence lifetime imaging
microscopy in living cells. Microsc Res Tech 69,
933–939.
19 Jindal HK & Vishwanatha JK (1990) Functional iden-
tity of a primer recognition protein as phosphoglycerate
kinase. J Biol Chem 265, 6540–6543.
20 Siegler KM, Mauro DJ, Seal G, Wurzer J, deRiel JK &
Sirover MA (1991) Isolation and characterization of the
human uracil DNA glycosylase gene. Proc Natl Acad
Sci USA 88, 8460–8464.
21 Berry MD & Boulton AA (2000) Glyceraldehyde-3-
phosphate dehydrogenase and apoptosis. J Neurosci Res
60, 150–154.
22 Velick SF (1955) Glyceraldehyde-3-phosphate dehydro-
genase from muscle. Methods Enzymol 1, 401–406.
23 Yoshida A (1975) Human phosphoglycerate kinase.
Methods Enzymol 42, 541–547.
24 Kinoshita K, Goryo K, Takada M, Tomokuni Y,
Aso T, Okuda H, Shuin T, Fukumura H & Sogawa K
(2007) Ternary complex formation of pVHL, elongin B
and elongin C visualized in living cells by a FRET–
FLIM technique. FEBS J 274, 5567–5575.
25 Kemnitz K, Pfeifer L, Paul R & Coppey-Moisan M
(1997) Novel detectors for fluorescence lifetime
imaging on the picoscecond time scale. J Fluoresc 7,
93–98.
26 Kemnitz K, Pfeifer L & Ainbund MR (1997) Detector
for multichannel spectroscopy and fluorescence lifetime
imaging on the picosecond timescale. Nucl Instrum
Methods Phys Res A 387, 86–87.
27 Beechem JM (1989) A second generation global analysis
program for the recovery of complex inhomogeneous
fluorescence decay kinetics. Chem Phys Lipids 50, 237–
251.
Supporting information
The following supplementary material is available:
Fig. S1. Subcellular localization and enzymatic activi-
ties of citrine–GAPDH and cerulean–PGK.
Fig. S2. Error analysis of two-exponential fitting for
decay curves.
This supplementary material can be found in the
online version of this article.
Please note: As a service to our authors and readers,
this journal provides supporting information supplied
by the authors. Such materials are peer-reviewed and
may be re-organized for online delivery, but are not
copy-edited or typeset. Technical support issues arising
from supporting information (other than missing files)
should be addressed to the authors.
FRET imaging of interaction between GAPDH and PGK Y. Tomokuni et al.
1318 FEBS Journal 277 (2010) 1310–1318 ª 2010 The Authors Journal compilation ª 2010 FEBS