Tài liệu Báo cáo khoa học: Pronounced adipogenesis and increased insulin sensitivity caused by overproduction of prostaglandin D2 in vivo pptx
Bạn đang xem bản rút gọn của tài liệu. Xem và tải ngay bản đầy đủ của tài liệu tại đây (462.1 KB, 10 trang )
Pronounced adipogenesis and increased insulin sensitivity
caused by overproduction of prostaglandin D
2
in vivo
Yasushi Fujitani
1,
*, Kosuke Aritake
1
, Yoshihide Kanaoka
1,2
, Tsuyoshi Goto
3
, Nobuyuki Takahashi
3
,
Ko Fujimori
1,4
and Teruo Kawada
3
1 Department of Molecular Behavioral Biology, Osaka Bioscience Institute, Japan
2 Department of Medicine, Harvard Medical School, Division of Rheumatology, Immunology, and Allergy, Brigham and Women’s Hospital,
Boston, MA, USA
3 Laboratory of Molecular Function of Food, Division of Food Science and Biotechnology, Graduate School of Agriculture, Kyoto University,
Japan
4 Laboratory of Biodefense and Regulation, Osaka University of Pharmaceutical Sciences, Japan
Introduction
The amount of adipose tissue in the body is an impor-
tant factor in the maintenance of energy balance,
through its ability to store and release fat, and is
altered in various physiological or pathological condi-
tions [1]. The increased adipose tissue mass associated
with obesity results from an increase in the number
Keywords
adipocytes; H-PGDS; obesity; PGD
2
;
transgenic mouse
Correspondence
K. Fujimori, Laboratory of Biodefense and
Regulation, Osaka University of
Pharmaceutical Sciences, 4-20-1 Nasahara,
Takatsuki, Osaka 569-1094, Japan
Fax: +81 726 690 1055
Tel: +81 726 690 1055
E-mail:
*Present address
Pharmaceutical Research Division, Takeda
Pharmaceutical Co. Ltd., Osaka, Japan
(Received 28 October 2009, revised 22
December 2009, accepted 4 January
2010)
doi:10.1111/j.1742-4658.2010.07565.x
Lipocalin-type prostaglandin (PG) D synthase is expressed in adipose
tissues and involved in the regulation of glucose tolerance and atherosclero-
sis in type 2 diabetes. However, the physiological roles of PGD
2
in adipo-
genesis in vivo are not clear, as lipocalin-type prostaglandin D synthase can
also act as a transporter for lipophilic molecules, such as retinoids. We gen-
erated transgenic (TG) mice overexpressing human hematopoietic PGDS
(H-PGDS) and investigated the in vivo functions of PGD
2
in adipogenesis.
PGD
2
production in white adipose tissue of H-PGDS TG mice was
increased approximately seven-fold as compared with that in wild-type
(WT) mice. With a high-fat diet, H-PGDS TG mice gained more body
weight than WT mice. Serum leptin and insulin levels were increased in
H-PGDS TG mice, and the triglyceride level was decreased by about 50%
as compared with WT mice. Furthermore, in the white adipose tissue of
H-PGDS TG mice, transcription levels of peroxisome proliferator-activated
receptor c, fatty acid binding protein 4 and lipoprotein lipase were
increased approximately two-fold to five-fold as compared with those of
WT mice. Finally, H-PGDS TG mice showed clear hypoglycemia after
insulin clamp. These results indicate that TG mice overexpressing H-PGDS
abundantly produced PGD
2
in adipose tissues, resulting in pronounced adi-
pogenesis and increased insulin sensitivity. The present study provides the
first evidence that PGD
2
participates in the differentiation of adipocytes
and in insulin sensitivity in vivo, and the H-PGDS TG mice could consti-
tute a novel model mouse for diabetes studies.
Abbreviations
15d-PGJ
2
, 15-deoxy-D
12,14
prostaglandin J
2
; ACC, acetyl-CoA carboxylase; aP2, fatty acid-binding protein 4, adipocyte; BAT, brown adipose
tissue; CMV, cytomegalovirus; CT, computed tomography; DEX, dexamethasone; GST, glutathione S-transferase; HF, high-fat; H-PGDS,
hematopoietic prostaglandin D synthase; IBMX, 3-isobutyl-1-methylxanthine; L-PGDS, lipocalin-type prostaglandin D synthase; LPL,
lipoprotein lipase; PG, prostaglandin; PGDS, prostaglandin D synthase; PPAR, peroxisome proliferator-activated receptor; SCD, stearoyl-CoA
desaturase; SEM, standard error of the mean; TG, transgenic; WAT, white adipose tissue.
1410 FEBS Journal 277 (2010) 1410–1419 ª 2010 The Authors Journal compilation ª 2010 FEBS
and size of adipocytes. A major role of adipocytes is
to store large amounts of triglycerides during periods
of energy excess and to mobilize these depots during
periods of nutritional deprivation. The number of
adipocytes is thought to increase as a result of differ-
entiation of adipocytes. Moreover, adipocytes are
highly specialized cells that secrete various adipocyto-
kines, whose release largely reflects the amounts of
stored triglyceride. Insights in the molecular mecha-
nisms underlying adipogenesis may lead to the devel-
opment of strategies for reducing the prevalence of
obesity.
Adipogenesis is a complex process accompanied by
various changes in hormone sensitivity and gene expres-
sion caused by many stimuli, including lipid mediators.
Prostaglandins (PGs) are involved in the regulation of
adipocyte differentiation. In vitro studies have shown
that PGD
2
enhances adipocyte differentiation [2], but
that PGE
2
and PGF
2a
suppress adipogenesis [3–5].
PGD synthase (PGDS) consists of two types of pro-
tein [6]. One is lipocalin-type PGDS (L-PGDS), and the
other is hematopoietic PGDS (H-PGDS). H-PGDS was
originally purified from rat spleen as a cytosolic, gluta-
thione-requiring enzyme [7,8], responsible for the bio-
synthesis of PGD
2
in antigen-presenting cells [9], mast
cells [10,11], megakaryocytes [12,13], and type 2 helper
T-lymphocytes [14]. There have been extensive biochem-
ical and genetic analyses of H-PGDS [15], and H-PGDS
was crystallized with its specific inhibitor at 1.7 A
˚
reso-
lution by X-ray diffraction analysis [16]. H-PGDS was
shown to be a member of the sigma-class glutathione
S-transferase (GST) family, and is also called GSTS1
[17]. On the other hand, L-PGDS has been purified
from rat brain [18], and is expressed in brain, heart, and
male genital organs, as well as in adipocytes and omen-
tal adipose tissues [19–22]. The different types of PGDS
have no significant homology at the amino acid level,
and have different tertiary structures for catalysis
[15,23,24]. Of particular note is that L-PGDS is a
bifunctional protein, having enzymatic activity with
regard to both PGD
2
production and transportation of
lipophilic molecules, such as retinoids [25], biliverdin,
bilirubin [26], gangliosides [27], and amyloid b-peptides
[28], with high affinities (K
d
= 20–2000 nm). We previ-
ously reported that knockdown of L-PGDS inhibited
adipocyte differentiation of 3T3-L1 cells in vitro,
thereby suggesting that L-PGDS is involved in the regu-
lation of adipocyte differentiation [2]. L-PGDS knock-
out mice became glucose-intolerant and insulin-
resistant, and showed increased fat deposition in the
aorta after receiving a high-fat (HF) diet [29]. Adipo-
cytes of the L-PGDS knockout mice were significantly
larger than those of wild-type (WT) mice [29]. Another
recent study demonstrated that L-PGDS knockout mice
did not have any significant glucose or insulin tolerance,
but had increased body weight and increased atheroscle-
rotic lesions in the aorta [30]. Thus, the role of L-PGDS
in adipogenesis and diabetes-related phenotypes is not
clear. Moreover, because of the dual functions of
L-PGDS, whether PGD
2
regulates the differentiation of
adipocytes in vivo remains to be elucidated.
In the present study, we have generated transgenic
(TG) mice, which produce abundant PGD
2
by overex-
pression of human H-PGDS, and used them to investi-
gate the physiological significance of PGD
2
in
adipogenesis in vivo. The H-PGDS TG mice showed
obesity, pronounced adipogenesis, and increased insu-
lin sensitivity when on the HF diet.
Results
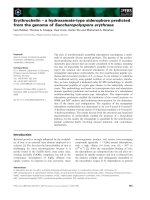
Generation of H-PGDS TG mice
Human H-PGDS cDNA under the regulatory control
of the chicken b-actin promoter and cytomegalovirus
(CMV) enhancer (Fig. 1A) was microinjected into the
nuclei of fertilized eggs from FVB mice. We established
three lines of H-PGDS TG mice, termed S41, S55, and
S66. Northern blot analysis for estimation of mRNA
expression of the transgene revealed higher expression
in S41 and S55 mice and lower expression in S66 mice in
the liver, white adipose tissue (WAT), and brown adi-
pose tissue (BAT), although H-PGDS was not expressed
in each tissue of WT mice (Fig. 1B). The expression of
human H-PGDS in hepatocytes and adipocytes of the
H-PGDS TG mice (S55) was confirmed by immunohis-
tochemistry, using a specific antibody against human
H-PGDS (Fig. 1C). Liver homogenates from WT and
TG mice were used for PGDS activity assays. As shown
in Fig. 1D, the tissue homogenates of TG mice showed
higher levels of PGD
2
production than those of WT
mice (approximately 18-fold, 25-fold and five-fold in
S41, S55 and S66 mice, respectively). These results indi-
cate that the H-PGDS TG mice overexpress human
H-PGDS transcripts, proteins and activities in various
tissues. In further experiments, we decided to use S41
and S55 mice as TG mice, because these mice showed
more abundant mRNA expression and enzymatic
activity of human H-PGDS.
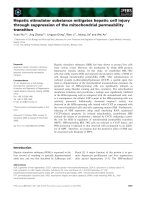
HF diet study
In order to examine the effects of PGDS overexpres-
sion on adipogenesis, WT and TG mice were fed a
normal or HF diet for 6 weeks after delactation
(Fig. 2A). TG mice showed normal growth and no
Y. Fujitani et al. Roles of prostaglandin D
2
in adipogenesis in vivo
FEBS Journal 277 (2010) 1410–1419 ª 2010 The Authors Journal compilation ª 2010 FEBS 1411
significant differences in spontaneous locomotor activ-
ity, rectal temperature and amount of food intake
under either normal or HF diet conditions in compari-
son with WT mice (data not shown). The body weights
of WT and TG mice were almost the same at the start
of this experiment (21.2 ± 0.3 g, 20.5 ± 0.7 g and
20.2 ± 0.5 g for WT, S41 and S55 mice, respectively).
The body weights of both WT and TG mice increased
in a similar manner under normal diet conditions
(Fig. 2B). In contrast, under HF diet conditions, the
body weights of both S41 and S55 mice increased
more, with statistically significant differences from WT
mice (Fig. 2B). Next, we measured tissue weights of
the liver, WATs (epididymal and perirenal fat) and
BAT under HF diet condition. WAT weights of TG
mice were significantly increased, by 20–30%, as com-
pared with those of WT mice. The BAT mass of TG
mice was larger than that of WT mice. On the other
hand, liver weights showed no difference between WT
and TG mice, under either normal or HF diet condi-
tions (Fig. 2C). These results indicate that the overex-
pression of H-PGDS causes the increase in adipose
tissue mass under HF diet conditions.
Body distribution of adipose tissues as
determined by computed tomography (C T) analysis
To further assess the effect of H-PGDS overexpression
on the increase in adipose tissues, the weights of
subcutaneous and visceral adipose tissues, as well as of
muscle, of WT and TG (S55) mice were analyzed with a
micro-CT scanner under HF diet conditions. Visceral
and subcutaneous adipose tissue weights of TG mice
were significantly increased after 1 week of the HF diet
in comparison with those of WT mice (Fig. 2D). The
weights of visceral and subcutaneous adipose tissues of
TG mice were approximately 1.5-fold and 1.4-fold,
respectively, of those of WT mice after 6 weeks of the
HF diet (Fig. 2D). In contrast, the weight of muscle
with organ, but without fats, showed no significant dif-
ference between WT and TG mice (Fig. 2D). These
results confirm that both subcutaneous and visceral adi-
pose tissues were increased in TG mice by the HF diet.
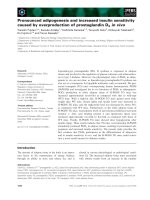
mRNA expression of adipogenic genes in WAT of
TG mice
We measured the amounts of PGD
2
in WAT after
6 weeks of the HF diet. WAT of TG (S55) mice con-
tained significantly more PGD
2
(approximately seven-
fold) than that of WT mice (Fig. 3A). To examine the
effects of the increased PGD
2
level on peroxisome pro-
liferator-activated receptor (PPAR) c activation, we
performed quantitative RT-PCR to measure the
mRNA expression levels of adipogenic genes, including
several PPARc-target genes, the transcription of
which is enhanced in adipogenesis [31,32]. The expres-
sion levels of PPARc, fatty acid-binding protein 4,
Human H-PGDS
cDNA
Chicken β-actin
enhancer
Liver WAT BAT
β-globin
PolyA
SalI
NotI
WT
S41
S55
S66
WT
S41
S55
S66
WT
S41
S55
S66
5
10
WT
WT
Liver WAT
0
5
PGDS activity
(nmol·min
–1
·mg
–1
protein)
S55
S55
WT
S41
S55
S66
promoter
IntronCMV
promoter
A
B
CD
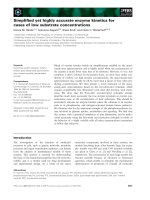
Fig. 1. Generation of human H-PGDS TG
mice. (A) Schematic representation of
human H-PGDS transfer vector. The
SalI–NotI fragment was microinjected into
fertilized eggs of FVB mice. (B) Northern
blot analysis of transgene expression in the
liver, WAT, and BAT. Ten micrograms of
total RNA was subjected to agarose gel
electrophoresis, blotted onto a nylon mem-
brane, and hybridized with the
32
P-labeled
full-length cDNA for human H-PGDS. (C)
Immunohistochemical analysis of transgene
expression in the liver and WAT. Paraffin
sections of liver and WAT from WT and TG
mice (S55) were stained with antibody
against human H-PGDS. Bars: 100 lm.
(D) PGDS activity in liver of WT and S41,
S55 and S66 TG mice.
Roles of prostaglandin D
2
in adipogenesis in vivo Y. Fujitani et al.
1412 FEBS Journal 277 (2010) 1410–1419 ª 2010 The Authors Journal compilation ª 2010 FEBS
adipocyte (aP2), lipoprotein lipase (LPL), stearoyl-
CoA desaturase (SCD), CD36 and acetyl-CoA carbox-
ylase (ACC) in WAT of TG mice were significantly
upregulated by approximately 2.5-fold, three-fold, five-
fold, 8.6-fold, 1.2-fold and 22-fold, respectively, in
comparison with those in WT mice (Fig. 3B). These
results indicate that mRNA expression of PPARc tar-
get genes is increased in WAT of TG mice, suggesting
that PPARc might be activated more in WAT of TG
mice than in WAT of WT mice.
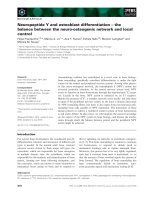
Serum levels of triglyceride, glucose, leptin and
insulin, and insulin sensitivity, in TG mice
After 6 weeks of normal or HF diet, serum levels of
triglyceride, glucose, leptin and insulin were deter-
mined (Fig. 4A). Under both dietary conditions,
triglyceride levels in TG (S55) mice were lower than
those in WT mice by about 50%, whereas glucose
levels were unchanged. Interestingly, serum leptin lev-
els were markedly increased in TG mice by approxi-
mately 1.7-fold and 3.3-fold after the normal and HF
diet, respectively, in comparison with WT mice. Fur-
thermore, insulin levels in TG mice were also
increased as compared with those in WT mice by
approximately 2.6-fold and two-fold after the normal
and HF diet, respectively. We next examined poten-
tial alterations of insulin sensitivity in TG mice. TG
mice fed the HF diet for 12 weeks showed clear
hypoglycemia after insulin loading as compared with
WT mice (Fig. 4B). The same results were obtained
in TG mice fed a normal diet. These results clearly
WT TG WT TG
Increased body weight (g)
**
**
*
*
**
*
1
1·5
**
WT (n = 18)
S41 (n = 8)
S55 (n = 8)
*
*
Normal diet HF diet
Normal diet HF diet
10
15
10
15
6420 6420
Duration (week)
*
Duration (week)
0
0·5
Tissue weight (g)
Liver
BAT
Epididymal
fat
Perirenal
fat
*
*
*
0
5
0
5
Increased weight (g)
Visceral fat
0123456
**
**
**
**
**
**
0
1
2
3
4
5
Duration
(
week
)
**
0123456
**
**
**
**
**
Subcutaneous fat
0
1
2
3
4
5
0123456
Muscle (with organs)
0
1
2
3
4
5
A
B
C
D
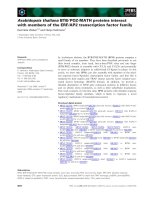
Fig. 2. Body weight increase in mice when
on the normal and HF diets. (A) After delac-
tation, WT and H-PGDS TG (S55) mice were
fed either the normal or the HF diet for
6 weeks. A representative male mouse
from each group is shown. (B) Body weight
was monitored every week for 6 weeks.
Closed circles (n = 61), squares (n = 22) and
triangles (n = 36) indicate WT, S41 and S55
mice, respectively. Values are expressed as
means ± SEMs. *P < 0.05, **P < 0.01 as
compared with WT mice. (C) Tissue weights
of epididymal and perirenal fat, BAT, and liver.
Values are expressed as means ± SEMs.
*P < 0.05, **P < 0.01 as compared with
WT mice. (D) Changes in the weights of
visceral and subcutaneous fat and muscle
with organ, but without fat, of WT and
H-PGDS TG mice (n = 6). Continuous
dissections of mouse fat and bone in the
whole body were quantified by use of a
micro-CT scanner and
LATHETA software
(Aloka). Open and closed circles correspond
to WT and H-PGDS TG mice, respectively.
**P < 0.01 as compared with WT mice.
Y. Fujitani et al. Roles of prostaglandin D
2
in adipogenesis in vivo
FEBS Journal 277 (2010) 1410–1419 ª 2010 The Authors Journal compilation ª 2010 FEBS 1413
Relative mRNA level
(/β-actin mRNA level)
Relative mRNA level
(/β-actin mRNA level)
0
0.2
0.4
0.4
0.8
PPARγ
0
10
20
30
0
**
**
*
aP2 LPL
WT TG WT TG WT TG
SCD
CD36 ACC
0
1
2
3
*
PGD
2
(ng·g
–1
tissue)
WT TG
4
40
8
0.5
**
**
0
0
WT TG WT TG WT TG
10
20
30
2
4
6
0
0.2
0.3
0.4
0.1
**
AB
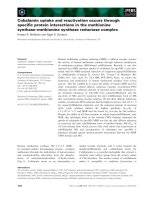
Fig. 3. PGD
2
production and expression of
adipogenic genes. (A) Predominant produc-
tion of PGD
2
in TG mice. PGD
2
levels in
WAT of WT and TG mice after the HF diet
were measured by enzyme immunoassay.
(B) Transcription levels of adipogenic genes
(encoding PPARc, aP2, LPL, SCD, CD36,
and ACC) in WAT. After being fed the HF
diet for 6 weeks, mice were killed, and total
RNA was isolated from WAT. Expression
levels of the target genes were normalized
to those of the b-actin mRNA level as an
internal control, and calculated as fold inten-
sity. Values are expressed as means ±
SEMs (n = 4–6). *P < 0.05, **P < 0.01 as
compared with WT mice.
Glucose level (% of change)
Time after in
j
ection
(
min
)
0
50
100
150
0 30 60 90 120
0
50
100
150
0306090120
Insulin (0.75 U kg
–1
) Insulin (3.0 U kg
–1
)
*
*
*
InsulinTriglyceride Glucose Leptin
10
20
30
40
50
0
40
80
120
Concentration (mg·dL
–1
)
0
40
80
120
0
0.5
1.0
1.5
0
*
**
*
*
**
**
WT TG WT TG WT TG WT TG WT TG WT TG WT TG WT TG
Normal HFNormal HFNormal HFNormal HF
A
B
Fig. 4. Serum markers and insulin sensitiv-
ity test. (A) After being fed a normal or HF
diet for 6 weeks, mice were killed and blood
was collected. Values are expressed as the
means ± SEMs (n = 4–6). *P < 0.05,
**P < 0.01 as compared with WT mice.
(B) WT (open circles) and TG (closed circles)
mice were injected with 0.75 UÆ kg
)1
and
3.0 UÆkg
)1
of insulin after being fed a nor-
mal or HF diet, respectively. The y-axis indi-
cates the percentage change in blood
glucose level as compared with the value
before injection (100% at t = 0). Values are
expressed as the means ± SEMs (n = 6–7).
*P < 0.05 as compared with WT mice.
Roles of prostaglandin D
2
in adipogenesis in vivo Y. Fujitani et al.
1414 FEBS Journal 277 (2010) 1410–1419 ª 2010 The Authors Journal compilation ª 2010 FEBS
indicate that overexpression of H-PGDS increases
insulin sensitivity in vivo.
Adipocyte differentiation ex vivo
Finally, we examined whether the overexpression of H-
PGDS also promotes ex vivo differentiation of adipo-
cytes. Preadipocytes prepared from WATs of WT or
TG (S55) mice were differentiated with 1 lm dexa-
methasone (DEX), 0.5 mm 3-isobutyl-1-methylxanthine
(IBMX), and insulin (10 lgÆmL
)1
). Ten days after
induction of differentiation, the differentiated adipo-
cytes prepared from WAT of TG mice accumulated
apparently greater amounts of lipid droplets than those
of WT mice (Fig. 5A). Intracellular triglyceride con-
tents in TG mouse-derived adipocytes were signifi-
cantly larger than in WT mouse-derived cells (Fig. 5B).
Moreover, the mRNA expression level of LPL in TG
mouse-derived adipocytes was increased by approxi-
mately two-fold as compared with WT mouse-derived
cells (Fig. 5C). Therefore, these results suggest that the
overproduction of PGD
2
promotes adipocyte differen-
tiation, thereby regulating adipogenesis.
Discussion
In this study, we generated H-PGDS TG mice over-
producing PGD
2
, and showed that PGD
2
acts as an
activator in adipogenesis in vivo. We used H-PGDS
TG mice to elucidate the functions of PGD
2
in adipo-
genesis in vivo, because L-PGDS is a bifunctional pro-
tein, both producing PGD
2
and acting as a carrier
protein for small lipophilic molecules [23], even though
L-PGDS, but not H-PGDS, was detected in adipocytes
[2,19]. Investigations using L-PGDS knockout mice
have demonstrated that L-PGDS is involved in the
regulation of glucose tolerance and atherosclerosis in
type 2 diabetes [29,33], and showed induction of obes-
ity [30]. However, it is not known which functions of
L-PGDS are associated with these phenotypes.
15-Deoxy-D
12,14
PGJ
2
(15d-PGJ
2
), which is one of
the metabolites of PGD
2
, has been identified as a
ligand for PPARc that can activate the differentiation
of adipose cells [34,35]. However, the concentrations of
15d-PGJ
2
used for activation of PPARc in most stud-
ies are much higher (2.5–100 lm) than those of conven-
tional PGs (picomolar range). Moreover, Bell-Parikh
et al. [36] demonstrated that 15d-PGJ
2
was present at a
low level that is insufficient for activation of adipocyte
differentiation. Thus, the contribution of 15d-PGJ
2
to
in vivo adipogenesis remains to be clarified.
H-PGDS TG mice gained more body weight than
WT mice when on the HF diet (Fig. 2A,B,D), and the
WAT weight of TG mice was larger than that of WT
mice (Fig. 2C); this was accompanied by upregulation
of the expression of adipogenic genes in WAT
(Fig. 3B), suggesting pronounced differentiation of
adipocytes and subsequent obesity in H-PGDS TG
mice. Furthermore, we observed a drastic increase in
PGD
2
levels in WAT of H-PGDS TG mice (Fig. 3A),
whereas PGE
2
and PGF
2a
levels were not significantly
altered in WAT in TG mice as compared with those in
WT mice (data not shown); these results are consistent
with the previous result showing that, even if PGD
2
production was decreased, the biosynthesis of other
PGs was not significantly affected [16].
The phenotypes seen in H-PGDS TG mice are con-
sistent with the findings that thiazolidinediones,
PPARc agonists, enhance adipocyte differentiation and
increase body weight, but act as antidiabetic drugs to
improve insulin sensitivity [37]. Indeed, the overexpres-
sion of H-PGDS improved insulin resistance (TG mice
showed clear hypoglycemia in response to insulin
clamp, as shown in Fig. 4B). Thus, PGD
2
and ⁄ or
PGD
2
metabolites might be involved in the regulation
of adipogenesis through PPARc in vivo. Further stud-
ies to investigate the precise mechanism, including the
Triglyceride (mg·well
–1
)
LPL mRNA level
(/β-actin mRNA level)
WT TG
30
0.3
*
*
WT TG
0
10
20
0
0.1
0.2
WT TG
A
BC
Fig. 5. Adipocyte differentiation ex vivo. (A) Primary cultured adipo-
cytes from WAT of WT and H-PGDS TG mice were cultured in the
presence of DEX, IBMX and insulin for 7 days, and stained for lipid
droplet accumulation with Oil Red O. (B) Triglyceride levels in pri-
mary cultured adipocytes. Values are expressed as means ± SEMs
(n = 4). **P < 0.01 as compared with WT mice. (C) The transcrip-
tion level of the LPL gene in WAT was normalized to that of b-actin
as a control, and calculated as fold intensity. Values are expressed
as the means ± SEMs (n = 4–6). *P < 0.05 as compared with WT
mice.
Y. Fujitani et al. Roles of prostaglandin D
2
in adipogenesis in vivo
FEBS Journal 277 (2010) 1410–1419 ª 2010 The Authors Journal compilation ª 2010 FEBS 1415
changes oin uptake of fatty acids and the number of
adipocytes, are needed. In addition, we need to eluci-
date the effects of GST activity in H-PGDS TG mice,
because H-PGDS also has GST activity [38].
In contrast to their increased insulin sensitivity, TG
mice showed higher insulin concentrations in blood,
whereas the basal glucose level was not different from
that of WT mice (Fig. 4A). In the H-PGDS TG mice,
apart from the improvement in peripheral insulin resis-
tance through the activation of PPARc in WAT, it is
possible that PGD
2
stimulates pancreatic islets to
increase insulin secretion. Indeed, serum insulin levels
were increased after treatment with thiazolidinediones
in diabetic mice through regulation of insulin produc-
tion in pancreatic islet cells [39–41]. Thus, the
increased insulin level seen in H-PGDS TG mice when
on the HF diet might be due to effects of PGD
2
on
pancreatic islet cells. The precise mechanism needs to
be elucidated in further investigations that include
analysis of pancreatic islet cells.
The H-PGDS TG mouse is a novel obesity model
with which to investigate the mechanism of adipogene-
sis. As is the case for obese people with overnutrition
and energy imbalance, as is common in advanced
countries, H-PGDS TG mice become obese after the
HF diet but not after the normal diet. This phenotype
is distinct from that seen in the well-known obesity
model mice, such as db ⁄ db and ob ⁄ ob mice, which are
deficient in the leptin receptor and leptin genes, respec-
tively [42].
In summary, H-PGDS TG mice produced substan-
tial amounts of PGD
2
as compared with WT mice,
and showed obesity, pronounced adipogenesis, and
increased insulin sensitivity when on the HF diet.
Thus, we show, for the first time, that PGD
2
is
involved in the activation of adipogenesis and regula-
tion of insulin sensitivity in vivo. Further characteriza-
tion of the role of PGD
2
in adipocyte differentiation
and function is an important goal, with possible thera-
peutic implications for the treatment of metabolic dis-
orders, such as diabetes and obesity. Moreover, the
TG mouse expressing PGDS is a useful model for the
study of obesity.
Experimental procedures
Generation of H-PGDS TG mice
The coding region of human H-PGDS was cloned into the
downstream sites of the chicken b-actin promoter and the
CMV enhancer of the pCAGGS expression vector [43]. A
3.6 kb SalI–NotI fragment from pCAGGS containing the
H-PGDS expression cassette was microinjected into
pronuclei of fertilized eggs of FVB mice (Taconic, Hudson,
NY, USA). Transgene-positive founder mice were identified
by Southern blot analysis of genomic DNA isolated from
the tail. Each founder was further bred with FVB mice,
and transgene-positive male and female mice were used and
compared with WT littermates. Mice were maintained
under specific pathogen-free conditions in isolated cages
with a 12 h light ⁄ 12 h dark photoperiod in a humidity-con-
trolled and temperature-controlled room (55% at 24 °C).
Water and food were available ad libitum. The protocols
used for all animal experiments in this study were approved
by the Animal Research Committee of Osaka Bioscience
Institute.
HF diet
Immediately after delactation, mice were fed a normal chow
diet (Oriental Yeast, Tokyo, Japan) or an HF diet contain-
ing casein (20%; w ⁄ w), a-cornstarch (30.2%), sucrose
(10%), lard (25%), corn oil (5%), minerals (3.5%), vita-
mins (1%), cellulose powder (5%), and d ⁄ l-methionine
(0.3%). For 6 weeks after delactation, body weight was
monitored every week.
CT analysis
After mice were anesthetized with intravenous sodium
pentobarbital (Nembutal; 50 mg Ækg
)1
; Abbott Laboratories,
North Chicago, IL, USA), CT analysis was performed with
a micro-CT scanner (LaTheta LCT-100; Aloka, Tokyo,
Japan). Data were analyzed using latheta software (Alo-
ka). The fat and muscle weights were determined from an
image at the level of the umbilicus. Subcutaneous fat was
defined as the extraperitoneal fat between skin and muscle.
The intraperitoneal part with the same density as the sub-
cutaneous fat layer was defined as visceral fat. The visceral
and subcutaneous fat weights were determined by auto-
matic planimetry. All experiments were performed at least
three times.
Immunohistochemical analysis
Paraffin-embedded sections were treated with 0.3% (v ⁄ v)
hydrogen peroxide in methanol for 30 min to block endo-
genous peroxidase, and then 0.02 m glycine for 10 min.
Sections were incubated with rabbit polyclonal antibody
against human H-PGDS overnight at 4 °C. After washing,
the sections were incubated with the biotinylated goat anti-
(rabbit IgG) for 30 min (Vector Laboratories, Burlingame,
CA, USA), and this was followed by staining with the
avidin–biotin–peroxidase complex system (Vectastain ABC
Kit; Vector Laboratories). Immunohistochemical signals
were visualized with peroxidase, using 3¢,3¢-diamino-
benzidine hydrochloride cromogen (Sigma, St Louis, MO,
USA).
Roles of prostaglandin D
2
in adipogenesis in vivo Y. Fujitani et al.
1416 FEBS Journal 277 (2010) 1410–1419 ª 2010 The Authors Journal compilation ª 2010 FEBS
Measurement of serum levels of leptin, insulin,
triglyceride, and glucose
Blood was collected from the abdominal aorta. Triglyceride
and glucose levels were determined by using Triglyceride
Test Wako (Wako Pure Chemical, Osaka, Japan) and
Antsense II (Bayer Medical, Tokyo, Japan), respectively.
Plasma leptin and insulin levels were measured by using
ELISA kits (Morinaga Institute of Biological Science,
Yokohama, Japan), according to the manufacturer’s
instructions.
RNA analysis
Preparation of total RNA and synthesis of first-strand
cDNAs were performed as described previously [44]. North-
ern blot analysis was performed as described previously
[45].
Expression levels of PPAR c , aP2 and LPL genes were
quantified by using the LightCycler system (Roche Diag-
nostics, Mannheim, Germany) with LightCycler FastStart
DNA Master SYBR Green I (Roche Diagnostics) and the
following PCR primer sets: 5¢-GGAGATCTCCAGTGA
TATCGACCA-3¢ and 5¢-ACGGCTTCTACGGATCGAA
ACT-3¢ for PPARc ,5¢-AAGACAGCTCCTCCTCGAAGG
TT-3¢ and 5¢-TGACCAAATCCCCATTTACGC-3¢ for aP2,
5¢-ATCCATGGATGGACGGTAACG-3¢ and 5¢-CTGGA
TCCCAATACTTCGACCA-3¢ for LPL, 5¢-TGGGTTGG
CTGCTTGTG-3¢ and 5¢-GCGTGGGCAGGATGAAG-3¢
for SCD, 5¢-GATGTGGAACCCATAACTGGATTCAC-3¢
and 5¢-GGTCCCAGTCTCATTTAGCCACAGTA-3¢ for
CD36, 5¢-GCGTCGGGTAGATCCAGTT-3¢ and 5¢-CTC
AGTGGGGCTTAGCTCTG-3¢ for ACC, and 5¢-AACAC
CCCAGCCATGTACGTAG-3¢ and 5¢-TGTCAAAGAAA
GGGTGTAAAACGC-3¢ for b-actin. Expression levels of
the target genes were normalized to that of b-actin.
Insulin sensitivity test
Mice were fed a normal or HF diet for 12 weeks after
delactation. Basal blood was collected from the tail vein
(t = 0 min) and immediately measured for glucose, using
an Antsense II. Porcine insulin was injected subcutaneously,
and blood was collected at 30, 60, 90 and 120 min after
injection.
Measurement of PGDS activity and PGD
2
content
PGDS activity was measured as described previously
[16,46]. The PGs in tissues were extracted with ethyl ace-
tate, which was evaporated under nitrogen, and the samples
were then separated by HPLC (Gilson, Middleton, WI,
USA), as described previously [47]. The amounts of PGD
2
in tissues were determined by using the PGD
2
-MOX EIA
Kit (Cayman Chemical, Ann Arbor, MI, USA), as
described previously [16,46].
Preparation of primary cultured adipose cells and
induction of adipogenic differentiation
Primary culture of adipose cells was performed as described
previously [48], from epididymal adipose tissues collected
from six WT and six TG mice (8–10 weeks of age). Cells
were seeded on six-well tissue culture plates (type I colla-
gen-precoated; AGC Techno Glass, Chiba, Japan) at a den-
sity of 2 · 10
5
cells per well, and incubated in the growth
medium at 37 °C under a humidified atmosphere of 95%
air and 5% CO
2
. After confluence had been reached, the
growth medium was replaced with the differentiation med-
ium containing insulin (10 lgÆ mL
)1
; Sigma), 1 lm DEX
(Sigma) and 0.5 mm IBMX (Sigma) for 2 days as described
previously [2]. The cells were then cultured in the growth
medium containing insulin (5 lgÆmL
)1
) and 200 lm ascor-
bic acid for 7 days. Lipid accumulation was observed by
microscopy with Oil-Red O staining [2]. Triglyceride con-
tents in the cells were measured by the Wako triglyceride
test, according to the manufacturer’s instruction.
Statistics
The data are presented as means ± standard errors of the
mean (SEMs), and were statistically analyzed by means of
the unpaired t-test or the Welch t-test when variances were
heterogeneous. P-values < 0.05 considered to be significant.
Acknowledgements
We acknowledge Y. Urade (Osaka Bioscience Institute,
Osaka, Japan) for valuable discussions. This work was
supported in part by a Grant-in-Aid for Scientific
Research from the Ministry of Education, Culture,
Sports, Science and Technology of Japan (to K. Fuji-
mori and K. Aritake), and Research for Promoting
Technological Seeds from Japan Science and Technol-
ogy Agency, the Suzuken Memorial Foundation, the
Sumitomo Foundation, the Gushinkai Foundation
(to K. Fujimori), and the Takeda Science Foundation
(to K. Fujimori and Y. Fujitani).
References
1 Spiegelman BM & Flier JS (2001) Obesity and the regu-
lation of energy balance. Cell 104, 531–543.
2 Fujimori K, Aritake K & Urade Y (2007) A novel path-
way to enhance adipocyte differentiation of 3T3-L1 cells
by up-regulation of lipocalin-type prostaglandin D
synthase mediated by liver X receptor-activated sterol
Y. Fujitani et al. Roles of prostaglandin D
2
in adipogenesis in vivo
FEBS Journal 277 (2010) 1410–1419 ª 2010 The Authors Journal compilation ª 2010 FEBS 1417
regulatory element-binding protein-1c. J Biol Chem 282,
18458–18466.
3 Casimir DA, Miller CW & Ntambi JM (1996) Prea-
dipocyte differentiation blocked by prostaglandin stimu-
lation of prostanoid FP2 receptor in murine 3T3-L1
cells. Differentiation 60, 203–210.
4 Miller CW, Casimir DA & Ntambi JM (1996) The mecha-
nism of inhibition of 3T3-L1 preadipocyte differentiation
by prostaglandin F2alpha. Endocrinology 137, 5641–
5650.
5 Tsuboi H, Sugimoto Y, Kainoh T & Ichikawa A (2004)
Prostanoid EP4 receptor is involved in suppression of
3T3-L1 adipocyte differentiation. Biochem Biophys Res
Commun 322, 1066–1072.
6 Urade Y & Hayaishi O (2000) Prostaglandin D syn-
thase: structure and function. Vitam Horm 58, 89–120.
7 Christ-Hazelhof E & Nugteren DH (1979) Purification
and characterisation of prostaglandin endoperoxide D-
isomerase, a cytoplasmic, glutathione-requiring enzyme.
Biochim Biophys Acta 572, 43–51.
8 Urade Y, Fujimoto N, Ujihara M & Hayaishi O (1987)
Biochemical and immunological characterization of rat
spleen prostaglandin D synthetase. J Biol Chem 262,
3820–3825.
9 Murakami M, Matsumoto R, Urade Y, Austen KF &
Arm JP (1995) c-kit ligand mediates increased expres-
sion of cytosolic phospholipase A2, prostaglandin endo-
peroxide synthase-1, and hematopoietic prostaglandin
D2 synthase and increased IgE-dependent prostaglandin
D2 generation in immature mouse mast cells. J Biol
Chem 270, 3239–3246.
10 Urade Y, Ujihara M, Horiguchi Y, Igarashi M, Nagata
A, Ikai K & Hayaishi O (1990) Mast cells contain
spleen-type prostaglandin D synthetase. J Biol Chem
265, 371–375.
11 Urade Y, Ujihara M, Horiguchi Y, Ikai K & Hayaishi
O (1989) The major source of endogenous prostaglan-
din D2 production is likely antigen-presenting cells.
Localization of glutathione-requiring prostaglandin D
synthetase in histiocytes, dendritic, and Kupffer cells in
various rat tissues. J Immunol 143, 2982–2989.
12 Fujimori K, Kanaoka Y, Sakaguchi Y & Urade Y
(2000) Transcriptional activation of the human hemato-
poietic prostaglandin D synthase gene in megakaryo-
blastic cells. Roles of the Oct-1 element in the 5¢-
flanking region and the AP-2 element in the untrans-
lated exon 1. J Biol Chem 275, 40511–40516.
13 Mahmud I, Ueda N, Yamaguchi H, Yamashita R,
Yamamoto S, Kanaoka Y, Urade Y & Hayaishi O
(1997) Prostaglandin D synthase in human mega-
karyoblastic cells. J Biol Chem 272, 28263–28266.
14 Tanaka K, Ogawa K, Sugamura K, Nakamura M,
Takano S & Nagata K (2000) Cutting edge: differential
production of prostaglandin D2 by human helper T cell
subsets. J Immunol 164, 2277–2280.
15 Kanaoka Y & Urade Y (2003) Hematopoietic prosta-
glandin D synthase. Prostaglandins Leukot Essent Fatty
Acids 69, 163–167.
16 Aritake K, Kado Y, Inoue T, Miyano M & Urade Y
(2006) Structural and functional characterization of
HQL-79, an orally selective inhibitor of human hemato-
poietic prostaglandin D synthase. J Biol Chem 281,
15277–15286.
17 Hayes JD, Flanagan JU & Jowsey IR (2005) Glutathione
transferases. Annu Rev Pharmacol Toxicol 45, 51–88.
18 Urade Y, Fujimoto N & Hayaishi O (1985) Purification
and characterization of rat brain prostaglandin D
synthetase. J Biol Chem 260, 12410–12415.
19 Jowsey IR, Murdock PR, Moore GB, Murphy GJ,
Smith SA & Hayes JD (2003) Prostaglandin D2 syn-
thase enzymes and PPARgamma are co-expressed in
mouse 3T3-L1 adipocytes and human tissues. Prosta-
glandins Other Lipid Mediat 70, 267–284.
20 Quinkler M, Bujalska IJ, Tomlinson JW, Smith DM &
Stewart PM (2006) Depot-specific prostaglandin synthe-
sis in human adipose tissue: a novel possible mechanism
of adipogenesis. Gene 380, 137–143.
21 Urade Y & Hayaishi O (2000) Biochemical, structural,
genetic, physiological, and pathophysiological features
of lipocalin-type prostaglandin D synthase. Biochim
Biophys Acta 1482, 259–271.
22 Xie Y, Kang X, Ackerman WE, Belury MA, Koster C,
Rovin BH, Landon MB & Kniss DA (2006) Differenti-
ation-dependent regulation of the cyclooxygenase
cascade during adipogenesis suggests a complex role for
prostaglandins. Diabetes Obes Metab 8, 83–93.
23 Urade Y & Aritake K (2007) Multifunctional Properties
of Lipocalin-type Prostaglandin D Synthase. Research
Signpost, Kerala.
24 Urade Y & Eguchi N (2002) Lipocalin-type and hema-
topoietic prostaglandin D synthases as a novel example
of functional convergence. Prostaglandins Other Lipid
Mediat 68–69, 375–382.
25 Tanaka T, Urade Y, Kimura H, Eguchi N, Nishikawa
A & Hayaishi O (1997) Lipocalin-type prostaglandin D
synthase (beta-trace) is a newly recognized type of reti-
noid transporter. J Biol Chem 272, 15789–15795.
26 Beuckmann CT, Aoyagi M, Okazaki I, Hiroike T, Toh
H, Hayaishi O & Urade Y (1999) Binding of biliverdin,
bilirubin, and thyroid hormones to lipocalin-type pros-
taglandin D synthase. Biochemistry 38 , 8006–8013.
27 Mohri I, Taniike M, Okazaki I, Kagitani-Shimono K,
Aritake K, Kanekiyo T, Yagi T, Takikita S, Kim HS,
Urade Y et al. (2006) Lipocalin-type prostaglandin D
synthase is up-regulated in oligodendrocytes in lyso-
somal storage diseases and binds gangliosides. J Neuro-
chem 97, 641–651.
28 Kanekiyo T, Ban T, Aritake K, Huang ZL, Qu WM,
Okazaki I, Mohri I, Murayama S, Ozono K, Taniike M
et al. (2007) Lipocalin-type prostaglandin D
Roles of prostaglandin D
2
in adipogenesis in vivo Y. Fujitani et al.
1418 FEBS Journal 277 (2010) 1410–1419 ª 2010 The Authors Journal compilation ª 2010 FEBS
synthase ⁄ beta-trace is a major amyloid beta-chaperone
in human cerebrospinal fluid. Proc Natl Acad Sci USA
104, 6412–6417.
29 Ragolia L, Palaia T, Hall CE, Maesaka JK, Eguchi N &
Urade Y (2005) Accelerated glucose intolerance,
nephropathy, and atherosclerosis in prostaglandin D2
synthase knock-out mice. J Biol Chem 280, 29946–
29955.
30 Tanaka R, Miwa Y, Mou K, Tomikawa M, Eguchi N,
Urade Y, Takahashi-Yanaga F, Morimoto S, Wake N
& Sasaguri T (2009) Knockout of the l-pgds gene aggra-
vates obesity and atherosclerosis in mice. Biochem
Biophys Res Commun 378, 851–856.
31 Kang S, Bajnok L, Longo KA, Petersen RK, Hansen
JB, Kristiansen K & MacDougald OA (2005) Effects of
Wnt signaling on brown adipocyte differentiation and
metabolism mediated by PGC-1alpha. Mol Cell Biol 25,
1272–1282.
32 Rosen ED (2005) The transcriptional basis of adipocyte
development. Prostaglandins Leukot Essent Fatty Acids
73, 31–34.
33 Ragolia L, Hall CE & Palaia T (2008) Lipocalin-type
prostaglandin D(2) synthase stimulates glucose trans-
port via enhanced GLUT4 translocation. Prostaglandins
Other Lipid Mediat 87, 34–41.
34 Forman BM, Tontonoz P, Chen J, Brun RP,
Spiegelman BM & Evans RM (1995) 15-Deoxy-
delta12,14-prostaglandin J2 is a ligand for the adipocyte
determination factor PPAR gamma. Cell 83, 803–812.
35 Kliewer SA, Lenhard JM, Willson TM, Patel I, Morris
DC & Lehmann JM (1995) A prostaglandin J2 metabolite
binds peroxisome proliferator-activated receptor gamma
and promotes adipocyte differentiation. Cell 83, 813–819.
36 Bell-Parikh LC, Ide T, Lawson JA, McNamara P,
Reilly M & FitzGerald GA (2003) Biosynthesis of 15-
deoxy-delta12,14-PGJ2 and the ligation of PPAR-
gamma. J Clin Invest 112, 945–955.
37 Yamauchi T, Kamon J, Waki H, Murakami K,
Motojima K, Komeda K, Ide T, Kubota N, Terauchi
Y, Tobe K et al. (2001) The mechanisms by which both
heterozygous peroxisome proliferator-activated receptor
gamma (PPARgamma) deficiency and PPARgamma
agonist improve insulin resistance. J Biol Chem 276,
41245–41254.
38 Jowsey IR, Thomson AM, Flanagan JU, Murdock PR,
Moore GB, Meyer DJ, Murphy GJ, Smith SA & Hayes
JD (2001) Mammalian class Sigma glutathione S-trans-
ferases: catalytic properties and tissue-specific expression
of human and rat GSH-dependent prostaglandin D2
synthases. Biochem J 359, 507–516.
39 Evans-Molina C, Robbins RD, Kono T, Tersey SA,
Vestermark GL, Nunemaker CS, Garmey JC, Deering
TG, Keller SR, Maier B et al. (2009) Peroxisome prolif-
erator-activated receptor gamma activation restores islet
function in diabetic mice through reduction of endo-
plasmic reticulum stress and maintenance of euchroma-
tin structure. Mol Cell Biol 29, 2053–2067.
40 Wajchenberg BL (2007) Beta-cell failure in diabetes and
preservation by clinical treatment. Endocr Rev 28, 187–
218.
41 Yildirim S, Bolkent S & Sundler F (2008) The role of
rosiglitazone treatment in the modulation of islet hor-
mones and hormone-like peptides: a combined in situ
hybridization and immunohistochemical study. J Mol
Histol 39, 635–642.
42 Speakman J, Hambly C, Mitchell S & Krol E (2008)
The contribution of animal models to the study of
obesity. Lab Anim 42, 413–432.
43 Niwa H, Yamamura K & Miyazaki J (1991) Efficient
selection for high-expression transfectants with a novel
eukaryotic vector. Gene
108, 193–199.
44 Fujimori K, Kadoyama K & Urade Y (2005) Protein
kinase C activates human lipocalin-type prostaglandin
D synthase gene expression through de-repression of
Notch-Hes signaling and enhancement of AP-2 beta
function in brain-derived TE671 cells. J Biol Chem 280,
18452–18461.
45 Kanaoka Y, Fujimori K, Kikuno R, Sakaguchi Y,
Urade Y & Hayaishi O (2000) Structure and chromo-
somal localization of human and mouse genes for
hematopoietic prostaglandin D synthase. Conservation
of the ancestral genomic structure of sigma-class gluta-
thione S-transferase. Eur J Biochem 267, 3315–3322.
46 Fujitani Y, Kanaoka Y, Aritake K, Uodome N,
Okazaki-Hatake K & Urade Y (2002) Pronounced
eosinophilic lung inflammation and Th2 cytokine release
in human lipocalin-type prostaglandin D synthase trans-
genic mice. J Immunol 168, 443–449.
47 Pinzar E, Kanaoka Y, Inui T, Eguchi N, Urade Y &
Hayaishi O (2000) Prostaglandin D synthase gene is
involved in the regulation of non-rapid eye movement
sleep. Proc Natl Acad Sci USA 97, 4903–4907.
48 Ohyama M, Matsuda K, Torii S, Matsui T, Yano H,
Kawada T & Ishihara T (1998) The interaction between
vitamin A and thiazolidinedione on bovine adipocyte
differentiation in primary culture. J Anim Sci 76, 61–65.
Y. Fujitani et al. Roles of prostaglandin D
2
in adipogenesis in vivo
FEBS Journal 277 (2010) 1410–1419 ª 2010 The Authors Journal compilation ª 2010 FEBS 1419