Tài liệu CALIFORNIA’S CONTAMINATED GROUNDWATER-Is the State Minding the Store? doc
Bạn đang xem bản rút gọn của tài liệu. Xem và tải ngay bản đầy đủ của tài liệu tại đây (3.27 MB, 107 trang )
CALIFORNIA’S
CONTAMINATED
GROUNDWATER
Is the State Minding the Store?
Written by
Alex N. Helperin
David S. Beckman
Dvora Inwood
Contributors
Valerie Ledwith
Wendy Blankenburg
Project Director
David S. Beckman
Natural Resources Defense Council
April 2001
ACKNOWLEDGMENTS
This report was prepared by NRDC’s Urban Program in our Los Angeles office. NRDC wishes
to thank Environment Now and the Sidney Stern Memorial Trust for their generous support,
as well as our members—more than 400,000 nationwide—without whom our efforts to protect
natural resources would not be possible. We are especialy grateful to our Los Angeles members
and supporters. The authors would like to acknowledge the important contributions made by
our colleagues Hal Candee, Barry Nelson, Erik Olson, and Gina Solomon.
The authors would also like to thank the many scientists, advocates, and professionals who
shared their experiences and expertise with us, especially, Tyler Dillavou, Carl Hauge (Chief
Hydrogeologist with the Division of Water Resources), Julia Huff (U.S. Geological Survey,
Water Resources Division), Elizabeth Janes (U.S. EPA Groundwater Office), Anthony Meeks
(Department of Health Services), Rick Rhoda (Department of Health Services, Drinking Water
and Environmental Division), Nancy Richard (State Water Resources Control Board), David
Storm (Department of Health Services), Anthony Saracino (hydrogeologist), Saracino-Kirby,
Inc., Terry Tamminem (Executive Director, Environment Now), and Marguerite Young (Clean
Water Action). In addition, we are grateful for the insightful peer reviews provided by Brendan
Dooher (Lawrence Livermore National Laboratories), Professor Harrison Dunning (School of
Law, University of CA, Davis), Terry Flemming (U.S. EPA, Region IX), James Goodrich (water
resources and environmental consultant), and Kevin Graves (Senior Water Resource Control
Engineer, State Water Resources Control Board). Of course, specialists in this area have reached
different conclusions about the most effective approach to groundwater management and
their kind participation here should not be taken as an endorsement of our approach.
ABOUT NRDC
The Natural Resources Defense Council (NRDC) is a national nonprofit environmental
organization dedicated to protecting the world’s natural resources and ensuring a safe and
healthy environment for all people. With more than 400,000 members and a staff of lawyers,
scientists, and other environmental specialists, NRDC combines the power of law, the power
of science, and the power of people in defense of the environment. NRDC, which has offices
in New York City, Washington, DC, San Francisco, and Los Angeles, has been actively
involved in protecting our water resources for many years.
Copy Editor
Dana Foley
Production Supervisor
Emily Cousins
NRDC President
John Adams
ISBN 1-893340-27-9
Copyright ©2001 by the Natural Resources Defense Council, Inc.
For additional copies of this report, please send $7.50, plus $1.50 shipping and handling, to:
NRDC Publications Department, 40 West 20th Street, New York, NY 10011. California
residents must add 7.25% sales tax. Please make checks payable to NRDC in U.S. dollars only.
To view this report online, or to obtain more information online about NRDC’s work, visit our
site on the World Wide Web at www.nrdc.org.
This report is printed on paper with 100% postconsumer content, processed chlorine-free.
Production
Bonnie Greenfield
NRDC Director of Communications
Alan Metrick
NRDC Executive Director
Frances Beinecke
ii
Natural Resources Defense Council
Executive Summary v
Chapter 1 1
An Introduction to Groundwater
Chapter 2 7
The Big Picture: Statewide Information on California’s Groundwater Basins
Chapter 3 27
Down and Dirty: California’s Contaminated Aquifers
Chapter 4 65
A Patchwork Picture: Groundwater Assessment in California
Chapter 5 73
Improving Groundwater Assessment in California
Glossary 85
Endnotes 87
Figures
Figure 1: How Groundwater Occurs 1
Figure 2: Groundwater Extraction 2
Figure 3: Types of Wells 3
Figure 4: The Hydrologic Cycle 5
Figure 5: Drinking Water Sources That Exceed MCL 17
Figure 6: Drinking Water Sources and Superfund Sites 21
Figure 7: State and Federal Cleanup Sites 22
Figure 8: State Cleanup Sites by County 23
Figure 9: Total Federal and State Cleanup Sites by County 24
Figure 10: Groundwater Impacts at DTSC Cleanup Sites 25
Figure 11: Salinity in California Groundwater 30
Figure 12: Salinity in Ventura County Groundwater 31
Figure 13: Salinity in Kern County Groundwater 32
Figure 14: Organic Compound Detections in Drinking Water Sources 36
iii
CONTENTS
Figure 15: Leaking Underground Fuel Tank Sites in California 38
Figure 16: MTBE: The Dirty Dozen 40
Figure 17: Nitrogen in California Groundwater 43
Figure 18: Nitrogen in San Bernardino Groundwater 44
Figure 19: Counties with Significant Pesticide Detections 46
Figure 20: The Pesticide DCBP in Drinking Water Sources 48
Figure 21: Average Arsenic Concentrations in Groundwater 51
by County (1990–2000)
Figure 22: Chromium Levels in Drinking Water Sources 53
Figure 23: LUFT Sites and Public Wells 56
Figure 24: LUFT Sites Located Within One-Half Mile of Public 57
Drinking Water Wells
Figure 25: Radon in Drinking Water Sources 60
Figure 26: Wells Taken Out of Service 1984–2000 71
Tables
Table 1: Groundwater Monitoring Agencies 8
Table 2: Major Findings of the 305(b) Report (2000) 13
Table 3: Top Six Causes and Sources of Contamination: 14
A Decade of 305(b) Report Groundwater Data
Table 4: Contaminants Detected Above Maximum Contaminant Levels 18
Table 5: Organic Chemicals Detected in California Groundwater 34
in the mid-1980s
Table 6: Reported MTBE Detections in Drinking Water Sources 41
(as of January 3, 2001)
Table 7: Leaking Tank Sites by County 58
Table 8: Types of Protection Afforded by Various Federal and State Laws 74
iv
Natural Resources Defense Council
B
eneath the surface of the earth lies a vast body of water. It does not exist in a
large underground lake or a flowing underground stream but rather as tiny
droplets of water, interspersed among the grains of soil and rock that we com-
monly picture when imagining the world underground. Nevertheless, the aggre-
gate volume of those tiny water droplets is greater than the volume of all the lakes
and rivers of the world combined. In fact, the volume of groundwater is estimated
to be more than 30 times the combined volume of all fresh-water lakes in the world
and more than 3,000 times the combined volume of all the world’s streams.
1
In
California alone, current supplies of usable groundwater are estimated at about
250 million acre-feet
2
—six times the volume of all of the state’s surface water
reservoirs combined.
3
For more than 100 years, groundwater has provided a substantial and essential
resource for California’s agriculture, its industries, and its cities. It was not long after
statehood in 1850 that California’s residents began building pumps to extract this
plentiful resource from the subsurface. The scarcity and seasonal availability of
surface water, especially in the southern half of the state, have caused Californians to
turn time and time again to the state’s groundwater supply.
Indisputably, the availability—and, more importantly, the deficiency—of all forms
of freshwater have substantially influenced California’s history and development.
In fact, water is widely considered the single most significant natural resource
affecting the growth of the state.
4
Given the arid climate that pervades most of the
southern half of the state
5
and the limited supply of running water, legendary
political and economic battles occurred over access to the waters of the Mono Basin,
the San Joaquin River, the Owens Valley, the Colorado River, and the Sacramento-
San Joaquin Bay Delta.
6
Yet despite their importance, these surface water bodies are only part of the water
picture in California. Between 25 and 40 percent of California’s water supply in an
average year comes not from surface streams or reservoirs but rather from beneath
the ground. That figure can be as high as two thirds in critically dry years.
7
In fact,
California uses more groundwater than does any other state.
8
Californians extract an
average of 14.5 billion gallons of groundwater every day—nearly twice as much as
Texas, the second-ranked state.
9
Fifty percent of California’s population—some 16 million people—depends on
groundwater for its drinking water supplies.
10
But of course, groundwater is used
for much more than just drinking water. California also leads the nation in the
number of agricultural irrigation wells, with more than 71,000.
11
In the Lower
Sacramento River Valley alone, approximately 750,000 acres of prime agricultural
land are irrigated, at least in part, by groundwater.
12
Indeed, many areas of the state
rely exclusively on groundwater for their water supplies.
13
In the lower Sacramento
Valley, for example, approximately one million people rely on groundwater to
supply all of their water needs.
14
For all of these reasons, the California Department of Water Resources has con-
cluded that water from California’s groundwater basins “has been the most important
single resource contributing to the present development of the state’s economy.”
15
v
EXECUTIVE SUMMARY
Yet despite the importance of this resource, until relatively recently groundwater
never received a degree of attention or protection commensurate with its value to
society. Part of that failure may be due to ignorance. Until recently, groundwater
was believed to be both naturally pristine and immune from contamination by
surface activities.
We now understand that the quality of the water stored underground in aquifers
(the geological formations that hold groundwater) is fragile. Groundwater resources
can be effectively diminished if they become contaminated to such a degree that
the water remaining in the aquifers is rendered unusable—or requires expensive
treatment in order to be made usable. Technological advances continue to make
treatment a more viable option and may eventually permit the use of once-abandoned
groundwater reserves, as we learn to remove more types of contaminants and at
lower costs. However, at least for the foreseeable future, true groundwater remedia-
tion is generally a time-consuming and costly process.
Yet without remediation, most forms of contamination will persist and may even
worsen. Unlike an aquifer suffering from depletion, which may rebound naturally
during the next wet season without human intervention, a contaminated aquifer
may remain contaminated (depending on the nature of the contaminants) for
hundreds, or even thousands, of years. Furthermore, contaminants will inevitably
spread—albeit very slowly—within any given groundwater basin. Finally, some lag
time inevitably exists between the contamination of water and the discovery of that
contamination, often with some further delay before the use of the contaminated
water is terminated. Thus, contamination not only results in a reduction in the
amount of immediately usable water, but may also result in human exposure to
hazardous levels of contaminants.
For these reasons, the contamination of our groundwater resources is a serious,
long-term threat to the viability of the resource in California, a state that relies on its
groundwater for many purposes. Understanding the full extent of the problem, and
generating reliable information on trends that can inform policy and resource allo-
cation decisions, are the best, and indeed, most basic, approaches to safeguarding
this natural resource. Surprisingly, the information that is available about the quality
of groundwater in California, as well as water quality trends, is extremely limited—
and often unreliable. Perhaps not so surprisingly, existing information, including
some of the most reliable data available, paints a picture of widespread groundwater
contamination in California.
WHAT DO EXISTING STATEWIDE DATA TELL US?
The primary state assessment mechanism for determining the condition of the state’s
groundwater resources is a report produced by the State Water Resources Control
Board, and updated every two years, known as the “305(b) Report.”
16
The most
recent edition suggests that more than one third of the areal extent of groundwater
in the state (a two-dimensional measurement of the surface area of the land under
which groundwater basins are located) is contaminated to such a degree that it
vi
Natural Resources Defense Council
cannot safely be used for all of the purposes the state has designated as appropriate
and desirable. According to the year 2000 update of the 305(b) Report, each of the
five most prevalent and harmful classes of contaminants independently contributes to
the impairment of more than 15 percent of the groundwater assessed in the state, as
measured by surface area.
17
Furthermore, the causes of this contamination are many
and varied. Several major sources and activities continue to contribute to ground-
water pollution, including septic systems, landfills, leaking underground storage
tanks, and agricultural operations.
While existing data paint a picture of a significantly degraded natural resource,
the incomplete and often fundamentally unreliable nature of this information is an
equally significant problem. NRDC’s investigation revealed that the 305(b) Report,
for example, although ostensibly the most comprehensive and thorough analysis of
the state’s groundwater basins, is so seriously flawed that its groundwater data is of
questionable value. The problems in the 305(b) Report’s groundwater information
range from data-collection inaccuracies to a lack of substantiation for basic assump-
tions.
18
Indeed, within a few days after NRDC provided the State Water Resources
Control Board, the agency responsible for the 305(b) Report, with an advance copy
of this NRDC study, the Board announced that even it did not consider much of its
own groundwater data to be reliable.
19
Although the Board has been publishing
the same or similar data for nearly ten years without caveat, on March 22, 2001
senior Board staff wrote to NRDC and the federal Environmental Protection Agency
and declared that the “State Water Resources Control Board (SWRCB) staff is
retracting all groundwater assessment information from the SWRCB’s year 2000
Clean Water Act (CWA) Section 305(b) report.” This unprecedented action by the
primary state agency charged with water quality control is indicative of the
challenge facing California in attempting to understand the full extent of statewide
groundwater contamination.
There are other agencies involved in collecting information about the quality of
California’s groundwater resources, but that is as much a part of the problem as a
solution. Multiple agencies manage often competing monitoring and assessment
systems, none of which is adequate on its own as a means of effectively assessing
and protecting groundwater quality throughout California. Notwithstanding the
good intentions of many state agencies, a failure to reform a highly fragmented and
inefficient monitoring and assessment approach leaves California unprepared to
assess and protect adequately this critical natural resource in the twenty-first century.
FINDINGS AND RECOMMENDATIONS
In order to characterize the condition of California’s groundwater resources and the
effectiveness of the groundwater monitoring and assessment system employed by
responsible state agencies, NRDC searched for and reviewed available data on the
condition of the resource and the sources of the most prevalent contaminants found
within it; we also assessed the means by which this information is gathered. The
data upon which NRDC relied came primarily from a variety of government
vii
California’s Contaminated Groundwater
agencies, at both the state and federal level. NRDC used that data, other information,
and its own professional judgment, to derive a list of five significant and repre-
sentative groundwater contaminants and their sources. We then analyzed each one
in greater detail, based on the most comprehensive and reliable data available with
respect to those specific contaminants and sources. Based on that research, NRDC
found that:
Available information suggests significant contamination of California’s groundwater
basins. Specifically:
According to questionable State Water Resources Control Board data, more than
one third of the areal extent of groundwater assessed in California is so polluted that
it cannot fully support at least one of its intended uses, and at least 40 percent is
either impaired by pollution or threatened with impairment;
Groundwater contaminants include both naturally occurring substances, such as
some metals, and anthropogenic ones, such as pesticides. Salinity, organic com-
pounds, pesticides, nutrients, and metals are among the most significant types of
contaminants that threaten or impair groundwater basins in California;
Large numbers of drinking water wells regularly exceed drinking water standards
(with thousands of exceedances last year alone), necessitating various means of
treatment prior to the delivery of water to users;
Groundwater contaminants have been detected at levels that exceed applicable
federal or state standards throughout many regions of California. Likewise, a variety
of contaminants, reflecting a range of human activities and natural causes, threaten
or impair groundwater basins in California.
There are several significant sources of that contamination:
Leaking underground storage tanks, natural sources, agriculture, land disposal,
septage, and industrial point sources are leading causes of groundwater contamination.
There is no comprehensive groundwater monitoring program in California—and available
information is often of dubious quality. Specifically:
The status of California’s groundwater resources is monitored by an array of
different agencies (both state and federal) with little, if any, coordination among them;
The format in which the information about groundwater quality is presented can
be deceptive, in that agencies assess the quality of the water relative to certain
standards (which may or may not be appropriate), rather than relative to its natural
state or to previous measurements, thus obscuring the degree to which the water’s
composition has been altered and providing no data trends;
Much of the general data, such as information generated by the State Water
Resources Control Board about the scope of the state’s groundwater impairment
problem, is simply incomplete and/or unreliable, making it difficult to know for
sure the condition of one of California’s most important natural resources;
Agencies that do collect reliable data, such as the Department of Health Services,
the Department of Pesticide Regulation, and the U.S. Geological Survey, do not
viii
Natural Resources Defense Council
survey the groundwater basins throughout the state in a comprehensive manner from
which conclusions might be drawn regarding the status of the resource as a whole.
Based on the findings of this study, NRDC concludes that there are a number
of reforms and improvements that need to be made at the state level in order for
California to improve its stewardship of the quality and usability of its ground-
water resources.
In particular, NRDC makes the following recommendations:
The state agencies responsible for protecting and managing California’s ground-
water resources (particularly the State Water Resources Control Board, the Depart-
ment of Health Services, and the Department of Water Resources) should improve the
scope and quality of their information by instituting a more systematic and ongoing
monitoring program and by standardizing the formatting of the data gathered;
A single agency should be responsible for compiling all of the information and for
making that information readily accessible to the general public;
The significant inadequacies and errors contained in the 305(b) Report should be
remedied through a complete reformation of this critical statewide groundwater
assessment;
The agency or agencies responsible for protecting California’s groundwater
resources and the health of California’s residents should develop a better under-
standing of the actual contaminants that are affecting the groundwater and the
sources from which they come;
The Legislature should ensure that adequate funding is provided to support these
programs;
The Legislature should ensure adequate implementation and enforcement of
prevention programs to prevent further contamination of groundwater resources;
The agency or agencies responsible for remediation of contamination within
groundwater basins should ensure timely remediation of already contaminated sites;
The Legislature should institute “polluter pays” provisions for groundwater
contamination to compensate the individuals or agencies conducting remedial
activities. However, it should clearly provide that remediation is not to be contingent
upon identification of the responsible parties and that collection of compensation is
not to be a prerequisite to remedial action.
ix
California’s Contaminated Groundwater
TO
GROUNDWATER
G
roundwater is, as its name suggests, water that is located beneath the surface of
the ground. In fact, despite the earth’s appearance as a solid mass of soil and
rock, so much of the earth’s subsurface is filled with water that, at any given time,
groundwater is the largest single source of freshwater available for human use—
domestic use, drinking water, agriculture, and industrial uses.
1
Hydrogeologists divide the subsurface into two categories—the unsaturated (or
“vadose”) zone and the saturated zone
2
(see Figure 1). The vadose zone is filled with
air, water, and other gases, but the water adheres to the surfaces of the sediment
grains and cannot be easily extracted.
3
Farther down, in the saturated zone, lies true “groundwater.” Contrary to
popular myth, groundwater does not occur in underground rivers and lakes but
is stored in the millions of tiny spaces within permeable soil and rock formations
called “aquifers.”
4
These aquifers can be divided into two types based on their
composition: either porous sediments or fractured hard rock.
5
The vast majority
1
CHAPTER 1
FIGURE 1
How Groundwater Occurs
Source: Groundwater, U.S. Geological Survey General Interest Publication, Reston, Virginia, 1999 revision.
of California’s developed aquifers are of the first type and are composed of uncon-
solidated sand and gravel.
6
The groundwater resides in the spaces (known as “pore
spaces”) between the grains of these sediments.
7
Major aquifers of this sort exist in
the Central Valley, San Francisco Bay area, the Salinas River Valley, many Southern
California areas, and parts of the desert.
8
The second type of aquifer, fractured hard
rock, occurs in mountainous areas around the state and often beneath the unconsoli-
dated sand and gravel aquifers.
The saturated zone is so named because groundwater fills in all of the spaces (or
pores) in the aquifers. In a simple, “unconfined” aquifer, the top of the saturated
zone is known as the “water table” (see Figure 1). If a well is drilled down into the
saturated zone, water from the sediments surrounding the well will seep into the
empty space created by the drilling of the well until the well fills with water
approximately to the level of the water table. If that water is then pumped out of the
well, more water will move from the pore spaces in the aquifer into the well,
replacing the water that was removed.
9
In this manner, groundwater can be pumped
to the surface for human use (see Figure 2).
Not all aquifers are so simple, though. California’s aquifers frequently contain
layers of clay and silt mixed in with the sand and gravel. Although these clay and
silt layers are also saturated with water, the spaces between the grains of these
materials are too small to allow water to pass through easily.
10
These deposits
2
Natural Resources Defense Council
FIGURE 2
Groundwater Extraction
Wells naturally fill to the level of the water table. This well receives groundwater from both the
porous sur ficial deposits and the fractured bedrock (hardrock). The fractures in hardrock are in
reality no more than 1-millimeter wide. They are exaggerated here for illustrative purposes.
Storage capacity of hardrock is much less than the storage capacity of the surficial deposits.
Source: USEPA, Seminar Publication: Wellhead Protection: A Guide for Small Communities, (1993) EPA/625/R-93/002.]
therefore impede the movement of the groundwater, forming local confining units in
the aquifers, known as “aquitards.”
11
The groundwater beneath an aquitard is
pressurized, and the aquifer is referred to as “confined” or “artesian.”
12
If the
artesian pressure in these aquifers is high enough, when wells penetrate the
confining layers, the groundwater will rise to the surface of the ground and flow
freely out of the well head
13
(see Figure 3).
THE INTERCONNECTION BETWEEN SURFACE WATER AND GROUNDWATER
Aquifers provide a theoretically sustainable source of water because the removal of
water from an aquifer is not a one-way street. Groundwater is replenished by surface
water that percolates down through the ground’s surface.
22
This process is referred to
as groundwater “recharge.”
23
Groundwater also escapes from other parts of the aquifer
back to the ground’s surface, through a process known as “discharge.” A spring is a
good example of natural discharge. Under natural conditions, groundwater basins
are in a state of dynamic equilibrium, with the amount of water entering through
recharge areas equaling the amount that is discharged.
24
However, human activity
can result in “artificial” recharge and discharge as well, thus altering that balance.
The movement of water through the subsurface is governed by the same forces
that govern surface water, but groundwater moves much more slowly. Under most
circumstances, groundwater moves less than 1,000 feet per year.
25
3
California’s Contaminated Groundwater
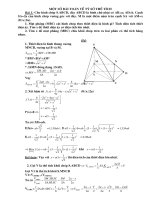
FIGURE 3
Types of Wells
Wells A, B, and C are artesian because they perforate the confined aquifer. Groundwater rises
to the level of the potentiometric surface, resulting in flowing wells in the cases of wells B and
C. For well A, however, the potentiometric surface is below the ground surface, and water does
not flow from the wellhead. Wells D and E do not reach the confined aquifer, and water levels
reflect the level of the water table.
Source: Department of Water Resources, “Water Facts, Number 6,” Ground Water (June 1993), p. 3
Recharge and Discharge
The water that recharges groundwater basins begins as precipitation, in the
form of rainfall and snow melt. Because precipitation is greater at higher
elevations and because most of California’s groundwater basins are in relatively
arid valleys, most natural recharge comes from streams flowing into and/or
across valleys.
26
However, only a fraction of the precipitation that falls makes its way into
groundwater basins. Some of the water evaporates before it can enter the subsurface,
and some flows to surface water bodies, such as lakes or the ocean. Even the portion
that does enter the subsurface can still evaporate from the unsaturated zone or be
taken up by plants and transpired.
27
Finally, some water is held in the unsaturated
zone by molecular attraction to the soil and will not reach the aquifer. Thus, only
the “excess” water, which is not taken up by the soil, plants, or evaporation, makes
its way through the vadose zone to the water table.
28
The precipitation that falls
4
Natural Resources Defense Council
HISTORY OF GROUNDWATER PUMPING
Ever since ancient times, people have dug wells in order to access groundwater.
Stories throughout the Bible (both Old and New Testaments) refer to wells,
14
and
the City of Jerusalem could not have maintained its population without underground
water systems and wells.
15
In California, while individual residents may have relied on wells long before
statehood, it was not until the latter half of the 19th century that use of ground-
water became noteworthy. Due to the artesian pressure that existed in many of
California’s coastal aquifers, farmers in the coastal basins were able to dig flowing
artesian wells, in which the groundwater would fill to the ground sur face and pour
out of the earth. This abundant water supply allowed agriculture to grow swiftly in
these fertile valleys. As early as 1850, California farmers produced enough wheat
to support the entire state, thus ending any wheat imports. This agricultural boom
truly developed on the backs of groundwater wells. “By 1865, there were close to
500 wells in the [Santa Clara] Valley as settlers switched from dr yland farming to
irrigated agriculture.”
16
In the 1870s, when the demands of irrigated agriculture
began to exceed surface water supplies, similar groundwater development began in
the Los Angeles area. By 1880, such developments had occurred in the Antelope
Valley and the Central Valley as well.
As groundwater extraction increased, the natural pressure in the aquifers
diminished. By 1891, most of the wells in the Antelope Valley had stopped flowing.
Soon after 1900, the situation was the same in the Central Valley.
17
In Southern
California, ar tesian wells still numbered 2,500 in 1900, but by 1930, only 22 were
left.
18
It became necessary to actively extract the groundwater collecting in the
lower levels of the wells. Pumps were installed in the Central Valley at the beginning
of the 20th century and in the Antelope Valley by 1915.
19
Groundwater pumping increased dramatically in the San Joaquin Valley, and the
number of wells increased almost 20-fold from 1906 (600) to 1920 (11,000).
20
The
invention of the deep-well turbine pump around 1930 allowed for withdrawals from
even greater depths and encouraged further development of groundwater resources
for irrigation.
21
directly onto the valley floors in most of the southern half of California never gets
that far down.
29
Human activity provides additional recharge mechanisms. Crop irrigation, for
example, can lead to groundwater recharge, as it generally involves the application
of more water than the crops can use, applied at a pace too fast for the excess to
evaporate.
30
Humans have also employed methods of intentional “artificial”
recharge, such as spreading water over recessed areas of land to allow it to infiltrate,
or injecting it directly into an aquifer.
31
Both of these methods can use local water
that is diverted from its course or imported water that is brought in specifically for
these purposes. In addition to these methods, the phrase “in lieu recharge” is often
used to refer to the use of surface water for irrigation in lieu of groundwater, as that
substitution accelerates recharge and suspends extractions.
32
Discharges also occur both naturally and by “artificial” means. Natural discharges
occur continuously.
33
Water escapes from a basin at a low point, where it enters the
ocean, a lake, or a stream, or where it emerges in a seep or spring.
34
Pump wells, on
the other hand, are a form of artificial discharge.
The Hydrologic Cycle
The process of recharge and discharge as well as the evaporation and precipitation
of water above the water table form a complete “hydrologic cycle” (see Figure 4).
It is clear from this cycle that groundwater and surface water are not two separate
resources but rather a single, integrated resource, continuously being exchanged
between the atmosphere, the ground surface, and the subsurface.
35
Due to the
5
California’s Contaminated Groundwater
FIGURE 4
The Hydrologic Cycle
Water naturally moves between the atmosphere, the ground surface, and the subsurface, by
the processes indicated.
Source: Department of Water Resources, "Water Facts, Number 6," Ground Water, (June 1993), p. 1.
interconnection among these various bodies of water, a change in one realm will
frequently affect the others.
36
This fundamental principle has been recognized in
legal proceedings and is memorialized in a 1991 ruling in a federal lawsuit, entitled
NRDC v. Duvall.
37
It is impossible to understand, protect, or efficiently manage our
groundwater resources without understanding the complete hydrologic system and
the dynamics that affect it.
38
6
Natural Resources Defense Council
THE BIG PICTURE:
STATEWIDE INFORMATION
ON
CALIFORNIA’S
GROUNDWATER BASINS
T
he research conducted by NRDC revealed a number of interesting facts. First
and perhaps most significantly, it revealed that there is no easy access to compre-
hensive and reliable data on the status of California’s groundwater resources. The data
that do exist are compiled and maintained by an array of state and federal govern-
ment agencies. Due in part to their differing charges, each of these agencies main-
tains data reflecting a different aspect of groundwater quality. The data are often also
in different formats, making them difficult to compile. Finally, some of the most
ostensibly comprehensive data proved to be the least reliable.
Second, to the extent that NRDC was able to obtain (or generate) summary
data about the status of California’s groundwater resources, those data revealed
an apparent abundance of contamination, some naturally occurring and some
anthropogenic. Five groups of contaminants studied in detail by NRDC—salinity,
organic compounds, nitrates, pesticides, and metals—are notable causes of impair-
ment (or threatened impairment) in many places in California. Third, seven
sources of contaminants—agriculture, industry, landfills, leaking underground
storage tanks, natural sources, resource extraction, and septic systems—represent
a range of known contributors of contaminants that can threaten and impair ground-
water. These five contaminants and seven sources are discussed in greater detail in
Chapter 3.
We begin by explaining the universe of agencies from which the data were
acquired and by providing an overview of the implications of those data.
WHO ASSESSES THE GROUNDWATER?
California’s surface water monitoring and public information program has been
improving steadily over the last several years. For example, Assembly Bill 411 (the
Right-To-Know Bill) created a regular monitoring program from April to October
at all major beaches and imposed requirements for conspicuous warning signs
whenever the beachwater fails to meet state water quality standards. Similarly,
7
CHAPTER 2
Assembly Bill 982, signed by Governor Davis in 1999, requires the State Water
Resources Control Board to assess its surface water monitoring program in a report
to the Legislature and propose improvements to remedy flaws in that system.
California’s groundwater, however, does not receive any systematic, statewide
attention or monitoring. Several government agencies compile incomplete reports on
groundwater basins and potential groundwater contaminants. Each agency approaches
the subject from a distinct perspective, based on its individual mandate, and no single
agency provides a comprehensive, reliable, qualitative analysis of the resource as a
whole. Furthermore, it is difficult, if not impossible, to combine the various sources of
data because each agency collects different information and organizes and encodes
its information in a different fashion. While nearly a dozen state and federal agencies
have at least an indirect relationship to groundwater regulation, few focus on it
directly. Table 1 summarizes the major agencies involved in groundwater quality
management and their respective focuses, as discussed in more detail below. It also
identifies some of the limitations of each agency’s data—inadequacies significant
enough to be of concern not only to specialists in the field but to state policy-makers
as well. These problems and limitations are discussed fully in Chapter 4.
8
Natural Resources Defense Council
TABLE 1
Groundwater Monitoring Agencies
Approximate
time period
Agency Focus of study of agency data Limitations
U.S. Geological Survey Individual studies and Since 1900 Only systematic with respect to individual,
randomly acquired data. geographically limited studies.
U.S. Environmental Protection Specific contaminated sites Since 1980 Limited to sites over which EPA may have
Agency (EPA) proposed for federal oversight jurisdiction under CERCLA, limited data on
of cleanup and funding from groundwater.
the Superfund.
a
Data received from the states Since 1975 No systematic monitoring and only
under the 305(b) Report sporadic data.
program.
b
California State Water Groundwater quality as a Since 1975 No systematic monitoring and only
Resources Control Board; whole—condition of the sporadic data.
Regional Water Quality Control resource.
Boards
California Depar tment of Drinking Water sources and Since 1984 Only monitors active sources of drinking
Health Services potential threats thereto, under water; only highlights results above the state
the Safe Drinking Water Act.
c
drinking water standard.
California Depar tment of Pesticide use and presence Since 1988 Only tests for certain legal pesticides and
Pesticide Regulation in the environment. their active ingredients.
California Depar tment of Specific contaminated sites Since 1982 Limited to sites over which DTSC may have
Toxic Substances Control proposed for State oversight of jurisdiction; limited data on groundwater.
(DTSC) cleanup process and funding.
All of the above Only look at specific constituents.
a
The “Superfund” Program is under the Comprehensive Environmental Response, Compensation, and Liability Act (“CERCLA”), 42 U.S.C. §§ 9601-9675.
b
The “305(b) Report” program is mandated by section 305(b) of the Federal Water Pollution Control Act (the Clean Water Act). 33 U.S.C. § 1315(b).
c
The California Safe Drinking Water Act is codified at Cal. Health & Safety Code, Div. 104, Part 12, Chap. 4, §§ 116275-750. The federal Safe Drinking Water
Act is codified at 42 U.S.C. §§ 300f–300j-11.
Federal Agencies
U.S. Geological Survey:
At the federal level, the U.S. Geological Survey (USGS) began
a project in 1991 to assess the status and trends of water quality in selected aquifers
(and surface water bodies) across the country. The “National Water-Quality Assess-
ment Program” includes three major studies in California: in the Santa Ana Basin,
the Central Valley’s San Joaquin-Tulare Basins, and the Sacramento River Basin.
1
The
USGS has reached some broad conclusions on the basis of this program: for example,
in the Santa Ana Basin, the agency found that the groundwater quality in the basin
becomes progressively poorer as water moves along hydraulic flow-paths,
2
suggest-
ing the presence of contaminating activities all along that route. The USGS also
maintains an extensive database of all the sample results it receives, whether from its
own studies or elsewhere. That database contains information on approximately
70,000 sites across California.
3
Environmental Protection Agency:
The U.S. Environmental Protection Agency (EPA)
maintains multiple databases of contaminated parcels of land. These sites are
generally brought to EPA’s attention in conjunction with a request for federal
funding to help clean up the contamination.
4
EPA’s main database, known as the
Comprehensive Environmental Response, Compensation, and Liability Information
System (CERCLIS), identifies almost 800 sites in California, including about 100 that
have already been approved for funding under the Superfund program and placed
on the National Priorities List.
5
CERCLIS does not provide any simple means of
determining the types of contaminants at the various sites, but it does present an
overview of contamination sites. This database is described further on Page 20.
State Agencies
California Department of Health Services:
At the state level, the Department of Health
Services’ (DHS) Drinking Water Program, within the Department’s Division of
Drinking Water & Environmental Management, maintains a database of water
quality test results from all Public Water Systems (see Glossary), as required by
California’s Safe Drinking Water Act.
6
According to DHS, approximately 1,920
such systems, covering up to 16,000 active drinking water sources, currently report
their test results to the Department on a regular basis.
7
The Drinking Water Program
has no authority over private wells, however, which total almost one million.
8
It also
does not collect information on wells that have been removed from the drinking
water system. Analyses of current information collected by the department under
the California Safe Drinking Water Act are presented in greater detail beginning on
Page 16.
9
The Department’s Drinking Water Program also runs the state’s “Drinking
Water Source Assessment and Protection” program, which is mandated by the
federal “Source Water Assessment Program.”
10
The state program involves three
essential steps: (1) identifying the areas around drinking water sources through
which contaminants might reach the drinking water supply; (2) inventorying
ongoing activities that could lead to the release of contaminants within the
California’s ground-
water, however,
does not receive any
systematic, state-
wide attention
or monitoring.
9
California’s Contaminated Groundwater
delineated areas, known as “possible contaminating activities,” or “PCAs”; and (3)
for each drinking water source, determining “the PCAs to which the . . . source is
most vulnerable.”
11
Department of Pesticide Regulation and Department of Toxic Substances Control:
Other statewide agencies that provide limited monitoring of groundwater basins
include the Department of Pesticide Regulation (DPR) and the Department of Toxic
Substances Control (DTSC). DTSC runs a “site remediation program” and maintains
a database of sites where hazardous materials have been released to the subsurface,
similar to the federal CERCLIS database. DPR maintains a fairly comprehensive
database of pesticide
12
use and performs tests to assess the level of pesticides in
surface water and groundwater. These surveys only cover the presence of certain
legal pesticides in California’s groundwater
13
and are reviewed in the following
chapter, in the section on pesticides.
State Water Resources Control Board:
The State Water Resources Control Board (State
Water Board), more than any other single agency, has been designated as the agency
responsible for collecting systematic data on the condition of California’s water
resources—both surface and ground. Every two years, the State Water Board
compiles information on the quality of the state’s various bodies of water in an
update to a report known as the “305(b) Report,” named after section 305(b) of the
federal Clean Water Act, which mandates its production.
14
The information for the
report comes to the State Water Board from its nine regional subdivisions (the
Regional Water Boards).
There are significant concerns regarding the comprehensiveness and the accuracy
of the recent updates to the 305(b) Report, as discussed further in this chapter and in
Chapter 4. These concerns are magnified in light of the fact that the 305(b) Report is
the only regular assessment designed to compile statewide information about the
condition of California’s groundwater resources as a whole.
Department of Water Resources:
Another state agency with responsibilities related to
groundwater is the Department of Water Resources (DWR). The California Legisla-
ture made DWR its own agency in 1956 (it had been a Division of the Department of
Public Works) and empowered it to manage the state’s water supply. With a staff of
2,700 and a $1 billion annual budget, DWR focuses mostly on surface water issues
such as flood control, dam safety, the Sacramento-San Joaquin River Delta restora-
tion, the state’s water budget, and operating the Nation’s largest water distribution
system, known as the “State Water Project.”
15
However, the agency also provides
some technical, administrative, and financial support to local agencies for the moni-
toring, mapping, replenishment, and use of both surface and groundwater.
16
DWR
also maps the state’s groundwater basins and is responsible for well reports that are
filed when a well is drilled. However, the agency has no statutory authority to
protect groundwater quality, and its role with respect to such issues as monitoring
and protection is quite limited.
17
10
Natural Resources Defense Council
GLOBAL INFORMATION ON THE STATE OF THE RESOURCE
“All of [California’s] groundwater basins are contaminated to some degree.”
22
Some types of contamination can be remedied, and contaminated water can be
treated to remove the dangerous contaminants before delivery to its end-users; but
these are not easy tasks. “Once a ground water supply is polluted, it is difficult and
expensive to clean up.”
23
The total cost to clean all of California’s groundwater
would run into the billions of dollars.
24
As a result, rather than expend these
enormous resources, many communities have simply stopped using their wells
11
California’s Contaminated Groundwater
WHAT COUNTS AS CONTAMINATION?
Water occurs in nature in vastly different levels of purity,
18
with innumerable
different constituents potentially suspended or dissolved within it. Water is also
used for many different purposes, and, depending on the uses demanded of it,
certain constituents may be present in water to varying degrees without diminishing
the water’s usefulness for those purposes. Some specific constituents are even
beneficial for certain uses.
However, many constituents—including many found in California’s groundwater
basins—can severely limit the uses that can be made of water. These constituents
may occur naturally, or they may be the result of human activities (anthropogenic).
Human activities have changed the concentrations of constituents in many water
bodies and have added new constituents not found in nature, often resulting in new
limitations on the uses of the water and/or exacerbating existing limitations. It is
the presence of contaminants
19
at levels that restrict the uses of water (or that
threaten to do so) that is the focus of this report. Accordingly, this report uses the
word “contamination” to refer to the presence of impurities in water at a level
exceeding an official standard that was developed to protect public health or to safe-
guard some other use(s) of the water. (We do not limit our definition to anthropogenic
sources of contamination because groundwater basins can and should be managed
to protect human health against even naturally occurring forms of contamination.)
This report does not make subjective assessments as to when contamination is
present. Rather, we rely on formal determinations to assess when the concentration
of contaminants is severe enough to limit the uses of water. These determinations
include those made in official documents issued by the State Water Resources
Control Board (305(b) Report) and the Department of Toxic Substances Control
(official cleanup site lists), as well as formal state and federal health standards
such as those issued by the Department of Health Services, the Office of Environ-
mental Health Hazard Assessment, and the U.S. Environmental Protection Agency.
As to the specific uses that are the focus of this report, unquestionably human
life cannot be sustained without water to drink and food to eat, and, in fact, the
vast majority of California’s groundwater use is either for drinking water or agri-
culture.
20
Thus, this report, like the State Water Board, recognizes that direct
consumption and food production are the most critical uses of groundwater for
humans.
21
When water is contaminated to the point of being unusable for these
purposes, absent often costly treatment, it results in the loss of an essential
resource. Accordingly, agencies such as the ones listed above have developed
specific numerical water quality standards (maximum constituent-concentration
levels) to protect these uses of the water.
completely, in favor of other, imported sources of water.
25
In the San Francisco Bay
area, for example, “municipal, domestic, industrial, and agricultural supply wells
have been taken out of service due to the presence of pollution.”
26
For the reasons explained above, our analysis of the contamination of California’s
groundwater begins with the three main types of data available on groundwater
quality: reports from the State Water Board, survey data from the Department of
Health Services, and information from EPA’s and DTSC’s remediation programs
regarding individual contaminated sites.
State Water Board 305(b) Report
The Clean Water Act requires the states to articulate the intended uses of every
navigable water body within their jurisdictions.
27
In California, the uses designated
for each water body are called “beneficial uses,” and they are assigned to ground-
water bodies as well as to surface water bodies.
28
California’s 305(b) Report
29
assesses the health of the state’s groundwater bodies relative to the beneficial
uses that the state has assigned for them. The report uses EPA’s classification of
waters as: (1) not supporting their designated beneficial uses, (2) partially supporting
their beneficial uses, (3) fully supporting their beneficial uses but “threatened” for at
least one use, or (4) fully supporting their beneficial uses.
30
While, as discussed
below, the 305(b) Report contains significant flaws that directly affect its conclusions,
the report has represented the official view of the State Water Resources Control
Board on the status of California’s groundwater basins. As such it is worth reviewing
conclusions that have been published biannually by the Board with little change
since the mid-1990s.
Summary of Findings.
Overall Contamination. California’s “Year 2000” update to the
305(b) Report
31
concludes that more than a third of the groundwater assessed is so
polluted that it cannot fully support at least one of the beneficial uses for which it
was designated.
32
The 305(b) Report also lists many other groundwater basins as
“Fully Supporting All Assessed Uses but Threatened for at Least One Use.” The
status of these additional waters is complicated. Many of them could be in the
process of becoming contaminated. The fact that they are listed as supporting most
uses does not mean that there are no contaminants in the water. Including these
“threatened” waters, over 40 percent of the assessed groundwater in California—
nearly one-half—are listed as impaired or threatened.
33
Contaminants of Concern. The 305(b) Report categorizes impaired water bodies
based on the causes of their impairment—i.e., the individual contaminants or groups
of contaminants that are causing the impairment. The report states, for example, that
more than 26,000 square miles of groundwater basins are impaired by salinity, and
23,500 square miles are impaired by priority organics, which are mostly volatile
organic compounds (VOCs). These numbers may also include some water bodies
that are categorized as “threatened” rather than “impaired.”
34
Sources of Impairment. The 305(b) Report also categorizes impaired water bodies
based on the sources of their impairment—i.e., the types of activities, land uses, etc.
12
Natural Resources Defense Council
from which the offending contaminants originated. Sources of water pollution are
often categorized as either point sources or non-point sources.
35
Point sources are
sources with discernible, discrete conveyance points from which the pollutants are
discharged. They include underground storage tanks, injection wells, and discharges
from industrial and sewage treatment facilities where the discharge comes from the
mouth of a pipe or other conduit.
36
Non-point sources release pollutants from more
diffuse areas and include such activities as the application of chemicals to agri-
cultural and urban landscapes, drainage from mining operations, timber harvesting,
and sea water intrusion. In 1994, the University of California’s Division of Agri-
culture and Natural Resources concluded that non-point sources of contamination
posed the greatest threat to California’s groundwater.
37
The source categorization in the 305(b) Report identifies activities, industries,
facilities, and land uses that have contributed contaminants. Leaking underground
storage tanks (LUSTs) are listed as the most pervasive source of groundwater impair-
ment, contributing to the degradation of almost 20,000 square miles of groundwater
basins in California. Natural sources, agriculture (primarily concentrated animal
feeding operations), land disposal, septage, and industrial point sources are each
listed as contributing to the impairment of more than 15,000 square miles of ground-
water. (Groundwater basins may be contaminated by more than one source, so these
numbers are not necessarily additive.) Agriculture, natural sources, land disposal,
13
California’s Contaminated Groundwater
TABLE 2
Major Findings of the 305(b) Report (2000)
MOST COMMON CAUSES OF IMPAIRMENT
The table below shows the numbers for every contaminant
group listed in the year 2000 update to the 305(b) Report as
causing impairment in more than 10,000 square miles of
groundwater basins, or more than 10 percent of the total areal
extent of waters assessed.
Cause of impairment Areal extent of Areal extent of
groundwater groundwater
impaired by such impaired as a
contaminants percent of the
(in square miles)
a
total area assessed
(62,652 mi
2
)
Salinity/TDS/chlorides 26,000 41.5 %
Priority Organics 23,500 37.5 %
Nutrients 16,000 25.5 %
Non-Priority Organics 16,000 25.5 %
Pesticides 11,300 18 %
Metals 10,700 17 %
a
Some of these areas inevitably overlap, as many ground water basins
are impaired by multiple pollutants. Consequently, these numbers are
not additive.
MOST PERVASIVE SOURCES OF CONTAMINATION
The table below shows the numbers for every source of
contamination listed in the year 2000 update to the 305(b)
Report as contributing to the impairment of more than 10,000
square miles of groundwater basins, or more than 10 percent
of the total areal extent of waters assessed.
Source of Impairment Total areal extent
b
As a percentage
of groundwater of the total
impaired by each assessed
source (square miles) (62,652 sq. mi.)
Leaking Underground 19,985 31.9%
Storage Tanks
Natural Sources 18,939 30.2%
Agriculture 18,313 29.2%
Concentrated Animal
Feeding Operations
c
(12,176) (19.4%)
Land Disposal 16,402 26.2%
Septage 15,447 24.7%
Industrial Point Sources 15,218 24.3%
Resource Extraction 8,297 13.2%
b
Some of these areas inevitably overlap, as many ground water basins
are impaired by contaminants from multiple sources. Consequently,
these numbers are not additive.
c
Concentrated Animal Feeding Operations are a subset of the
“Agriculture” category.
Source: California State Water Resources Control Board 305(b) report on
water quality, (2000), pages 369–370, Tables 12A and 12B.
and septage are also listed as the most pervasive “major” contributors. The major
findings in the 305(b) Report are set forth in Table 2.
Here Today, Gone Tomorrow: The Withdrawal of the 305(b) Report Groundwater Data.
After analyzing the 305(b) Report, including the regional data on which it is based,
NRDC has concluded that the State Water Board’s groundwater assessment is
seriously flawed in a manner that directly affects its conclusions, as discussed fully
in Chapter 4. By way of summary, problems with the 305(b) Report include the age
of the data, the quality and accuracy of collection methods, an apparent assumption
that entire groundwater basins were contaminated when evidence of some ground-
water contamination was found within a given basin, the failure to collect informa-
tion on all basins within the State, and the fact that contamination is portrayed two-
dimensionally, without regard to depth (i.e., without regard to volume). The
combination of suspected inaccuracies and incomplete statewide coverage makes it
difficult to say with certainty whether the true extent of contamination is greater
than or less than the results generated by a simple assessment of published data.
14
Natural Resources Defense Council
TABLE 3
Top Six Causes and Sources of Contamination: A Decade of 305(b) Report Groundwater Data
This table shows the areal extent of groundwater impairment in square miles from each of the top 6 causes and sources of
contamination.
1992 levels 1994 levels 1996 levels 1998 levels 2000 levels
Areal extent of groundwater
94,500 90,433 65,354 63,581 62,652
“assessed” (in square miles)
Source
major mod/min
a
major mod/min major mod/min major mod/min
Leaking Underground
897 379 231 126 24,858 126 19,859 126 19,859
Storage Tanks
Natural not
3,391 839 6,937 12,167 6,937 11,522 6,937 12,002
listed
Septage 1,596
1,100 305 11,502 8,943 6,522 8,914 6,533 8,914
or 3,186
Land Disposal 759
132 129 481 4,431 54 5,130 5,087 11,315
or 1,362
Agriculture 8,370 7,947 527
b
11,279 10,955
b
6,399 10,476 6,399 11,914
Industrial Point Sources 526 428 113 715 19,383 715 14,503 715 14,503
Cause/Contaminant
major mod/min major mod/min major mod/min major mod/min
Organics (priority) 910 625 287 335 22,821 335 20,821 757 22,743
Organics (nonpriority) 281 182 122 388 20,303 388 15,303 388 15,602
Salinity/TDS 4,667 3,335 1,021 11,500 12,720 11,620 12,519 11,620 14,403
Pesticides 1,909 685 12 7,500 8,489 7,500 3,489 7,500 3,829
Nitrates/Nutrients 2,238 705 391
c
10,800 10,097 5,920 10,097 5,920 10,094
Metals 242 + 53 20 151 4,531 6,251 4,531 5,726 4,531 6,206
a
Mod/min = moderate or minor.
b
Dairies (which are presumably a subset of agriculture) were also listed, independently, at 1087 and 20 (for 1994) and 4460 and 6017 (for 1996).
c
These numbers are listed as being for nitrates. Nutrients are listed independently at 165 and 23 for 1994.
Source: California State Water Resources Control Board 305(b) report on water quality, (1992–2000).
15
California’s Contaminated Groundwater
DISAPPEARING DATA
On March 22, 2001,
following receipt of an
advance draft of this
NRDC report, the State
Water Resources
Control Board wrote a
letter to the Natural
Resources Defense
Council, the United
States Environmental
Protection Agency, and
the California Environ-
mental Protection
Agency. In the letter,
the Board took the
unprecedented step of
withdrawing all of the
groundwater data in the
305(b) Report.