Tài liệu The Applicability of Remote Sensing in the Field of Air Pollution docx
Bạn đang xem bản rút gọn của tài liệu. Xem và tải ngay bản đầy đủ của tài liệu tại đây (5.29 MB, 54 trang )
The Applicability of Remote Sensing in
the Field of Air Pollution
P. Veefkind+, R.F. van Oss+, H. Eskes+,
A. Borowiak*, F. Dentner* and J. Wilson*
+
Royal Netherlands Meteorological Institute KNMI
* European Commission, Directorate-General Joint Research Centre, Institute for Environment and
Sustainability
Institute for Environment and Sustainability
2007
EUR 22542 EN
The mission of the Institute for Environment and Sustainability is to provide scientific and technical
support to the European Union’s policies for protecting the environment and the EU Strategy for
Sustainable Development.
European Commission
Directorate-General Joint Research Centre
Institute for Environment and Sustainability
Contact information
Address: T.P. 441, 21020 Ispra (VA), Italy
E-mail:
Tel.: +39 0332 789956
Fax: +39 0332 785236
Legal Notice
Neither the European Commission nor any person acting on behalf of
the Commission is responsible for the use which might be made of this
publication.
A great deal of additional information on the European Union is available on the Internet.
It can be accessed through the Europa server
EUR 22542 EN
ISSN : 1018-5593
Luxembourg: Office for Official Publications of the European Communities
© European Communities, 2007
Reproduction is authorised provided the source is acknowledged
Printed in Italy
7
Abstract
This report prepared by KNMI and JRC is the final result of a study on the applicability of remote sensing in the
field of air pollution requested by the DG Environment. The objectives of this study were to:
• Have an assessment of presently available scientific information on the feasibility of utilising remote
sensing techniques in the implementation of existing legislation, and describe opportunities for realistic
streamlining of monitoring in air quality and emissions, based on greater use of remote sensing.
• Have recommendations for the next policy cycle on the use of remote sensing through development of
appropriate provisions and new concepts, including, if appropriate, new environmental objectives, more
suited to the use of remote sensing.
• Have guidance on how to effectively engage with GMES and other initiatives in the air policy field projects
Satellite remote sensing of the troposphere is a rapidly developing field. Today several satellite sensors are in
orbit that measure trace gases and aerosol properties relevant to air quality. Satellite remote sensing data have the
following unique properties:
• Near-simultaneous view over a large area;
• Global coverage;
• Good spatial resolution.
The properties of satellite data are highly complementary to ground-based in-situ networks, which provide
detailed measurements at specific locations with a high temporal resolution.
Although satellite data have distinct benefits, the interpretation is often less straightforward as compared to
traditional in-situ measurements.
Maps of air pollution measured from space are widespread in the scientific community as well as in the media,
and have had a strong impact on the general public and the policy makers. The next step is to make use of
satellite data in a quantitative way. Applications based solely on satellite data are foreseen, however an
integrated approach using satellite data, ground-based data and models combined with data assimilation, will
make the best use of the satellite remote-sensing potential, as well as of the synergy with ground-based
observations.
8
Executive Summary
This report prepared by KNMI and JRC is the final result of a study on the applicability of remote sensing in the
field of air pollution requested by the DG Environment. The objectives of this study were to:
• Have an assessment of presently available scientific information on the feasibility of utilising remote
sensing techniques in the implementation of existing legislation, and describe opportunities for realistic
streamlining of monitoring in air quality and emissions, based on greater use of remote sensing.
• Have recommendations for the next policy cycle on the use of remote sensing through development of
appropriate provisions and new concepts, including, if appropriate, new environmental objectives, more
suited to the use of remote sensing.
• Have guidance on how to effectively engage with GMES and other initiatives in the air policy field projects
Satellite remote sensing of the troposphere is a rapidly developing field. Today several satellite sensors are in
orbit that measure trace gases and aerosol properties relevant to air quality. Satellite remote sensing data have the
following unique properties:
• Near-simultaneous view over a large area;
• Global coverage;
• Good spatial resolution.
The properties of satellite data are highly complementary to ground-based in-situ networks, which provide
detailed measurements at specific locations with a high temporal resolution.
Although satellite data have distinct benefits, the interpretation is often less straightforward as compared to
traditional in-situ measurements.
Maps of air pollution measured from space are widespread in the scientific community as well as in the media,
and have had a strong impact on the general public and the policy makers. The next step is to make use of
satellite data in a quantitative way. Applications based solely on satellite data are foreseen, however an
integrated approach using satellite data, ground-based data and models combined with data assimilation, will
make the best use of the satellite remote-sensing potential, as well as of the synergy with ground-based
observations.
The following examples of using satellite remote sensing as a stand-alone tool are foreseen:
• Impact of satellite data maps on policy makers;
• Information to the general public;
• Hazard warning;
• Planning of Ground-Based Measurement Sites;
• Spatial distribution of emissions;
• Trends in emissions;
• Monitoring of remote locations;
• Monitoring of long-range transport.
The combination of satellite observations, ground-based networks and models, e.g. with data assimilation has the
following benefits for air quality:
• Air quality forecasts;
• Improved characterisation of surface-level air pollution;
• Improvement of emission inventories and incidental releases;
• Monitoring of import/export of air pollution;
• Verification of models.
As in data assimilation used in numerical weather prediction systems, chemical data assimilation will take a
large effort to implement. However, it should not be forgotten that it took more than a decade for satellite data to
9
obtain a prominent role in numerical weather forecasts. Chemical data assimilation will benefit from this
experience, but still will take years to develop fully.
Current air quality legislation is connected strongly to what could be monitored reliably at ground level when the
legislation came into existence. The characteristics of satellite remote sensing are fundamentally different from
what is measured from the ground. To fully exploit the remote sensing potential, the legislation has to be
modified to enable the use of satellite data with its unique characteristics.
The study has made the following specific recommendations:
R_1.
Establish a long-term (distributed) data archive and distribution center for satellite air quality data sets.
This center should ensure harmonization of formats, units, nomenclature, etc, and should have sophisticated
web services and should be part of GMES.
R_2.
Support the further development of retrieval developments to improve the accuracy of the satellite
observations.
New developments are for example the combination data from two or more sensors in the retrieval process,
and radiance assimilation in models.
R_3.
Support satellite mission to ensure long-term data continuity.
Currently no air quality monitoring sensors are planned until the 2020 timeframe. This situation should be
avoided by supporting missions targeted on measuring air quality from ESA/EU (GMES Sentinels) for the
period 2010-2020, and for the long-term ESA/EUMETSAT missions.
R_4.
Promote the use of satellite data, e.g. by organizing workshops where new users are trained in using
remote sensing data.
A wider user community will optimize the use of satellite remote sensing potential and a such fits in the
GMES philosophy.
R_5.
Investigate the possibility to establish a (distributed) chemical data assimilation center, with a strong
link to ECMWF.
Such a system could be part of GMES.
R_6.
Support the implementation of an integrated system of satellite and ground-based air quality
measurements in combination with models and data optimization, as described in the IGACO report.
R_7.
Initiate projects for the further development of chemical data assimilation, in which the satellite,
ground-based, and model communities are involved.
A part from investing in chemical data assimilation systems, an important objective of these studies will be
to improve the connections between the different research communities. These projects could be part of FP7
and ESA/EUMETSAT research programs.
R_8.
Investigate how legislation may benefit from making use of the potentials of air pollution observations
from satellites.
10
EXECUTIVE SUMMARY ........................................................................................................................... 9
1 INTRODUCTION .................................................................................................................................... 12
1.1 BACKGROUND .......................................................................................................................................... 12
1.2 OBJECTIVES ............................................................................................................................................. 12
2 AIR POLLUTION LEGISLATION ....................................................................................................... 13
2.1
2.2
2.3
2.4
CONVENTION ON LONG-RANGE TRANS-BOUNDARY AIR POLLUTION ...................................................... 13
EU AIR QUALITY DIRECTIVES 96/62/EC AND ITS DAUGHTER DIRECTIVES AND AMENDMENTS................ 13
EU NATIONAL EMISSION CEILINGS DIRECTIVE ........................................................................................ 16
FUTURE DIRECTIONS IN AIR QUALITY POLICY......................................................................................... 16
3 SATELLITE OBSERVATIONS OF AIR POLLUTION ..................................................................... 18
3.1 SATELLITE MEASUREMENT METHODS ..................................................................................................... 18
3.1.1 Orbits................................................................................................................................................ 18
3.1.2 Viewing............................................................................................................................................. 19
3.1.3 Spectral properties and constituents ................................................................................................ 19
3.1.4 Retrieval: principles ......................................................................................................................... 20
3.1.5 Retrieval: Differential Optical Absorption Spectroscopy (DOAS)................................................... 22
3.1.6 Retrieval: tropospheric NO2 (example) ............................................................................................ 23
3.1.7 Summary of properties of air quality satellite measurement............................................................ 23
3.2 CURRENT AND PLANNED SATELLITE INSTRUMENTS ................................................................................. 24
3.2.1 UV-Visible spectrometers................................................................................................................. 25
3.2.2 Aerosol instruments.......................................................................................................................... 25
3.2.3 Infrared instruments ......................................................................................................................... 25
3.2.4 Future missions ................................................................................................................................ 25
3.3 EXAMPLES OF SATELLITE OBSERVATIONS OF AIR POLLUTION ................................................................ 30
3.3.1 Tropospheric Ozone ......................................................................................................................... 30
3.3.2 Tropospheric Nitrogen Dioxide........................................................................................................ 31
3.3.3 Tropospheric Carbon Monoxide ...................................................................................................... 35
3.3.4 Tropospheric Sulfur Dioxide ............................................................................................................ 36
3.3.5 Tropospheric Aerosols ..................................................................................................................... 37
3.3.6 Tropospheric Formaldehyde ............................................................................................................ 41
4 APPLYING SATELLITE REMOTE SENSING FOR AIR QUALITY MONITORING ................. 43
4.1 GENERAL CONSIDERATIONS .................................................................................................................... 43
4.2 USING SATELLITE REMOTE SENSING AS A STAND-ALONE TOOL .............................................................. 43
4.3 INTEGRATION OF SATELLITE REMOTE SENSING, GROUND BASED NETWORKS, AND MODELS ..................... 44
5 CONCLUSIONS AND RECOMMENDATIONS .................................................................................. 47
5.1 SUMMARY AND CONCLUSIONS ................................................................................................................. 47
5.2 RECOMMENDATIONS ................................................................................................................................ 48
6 REFERENCES.......................................................................................................................................... 51
APPENDIX A: LIST OF ORGANIZATIONS.......................................................................................... 53
APPENDIX B: LIST OF RELEVANT PROJECTS ................................................................................ 54
APPENDIX C: LIST OF RELEVANT SATELLITE INSTRUMENTS ................................................ 55
11
1
Introduction
1.1
Background
The vast majority of measurements in the field of air quality in Europe are ground point observations. However,
in order to make assessments throughout the territory, as requested by the air quality directives, modeling is
often employed, which relies heavily on emission inventories and meteorological modeling. The latter has been
facilitated and improved by remote sensing via satellites. In the last decade information from remote sensing that
is directly linked to air pollution has increasingly been provided. In addition, a number of research projects and
large international initiatives, such as the Global Monitoring of Environment and Security (GMES), are
exploring the potential of spatial data and information provided by remote sensing. Potentials definitely exist in
using remote sensing information for the validation of emission inventories and for a better understanding of the
atmospheric processes controlling air pollution episodes. In addition, remote sensing can complement ground
monitoring data when performing assessments of air pollution levels. In future, its role should however develop
in the manner similar to the steps already taken in meteorology, when fusion of ground based monitoring and
satellite data will provide the “chemical weather” reports and forecasts.
Over the last decade, the capabilities of satellite instruments for remote sensing of the lower troposphere have
strongly increased. New spaceborne radiometers make it possible to determine aerosol parameters on spatial
scales of a few kilometers, whereas the new generation of spectrometers can detect NO2 and other trace gases on
urban scales. The data from these instruments provide a new exciting view on global air quality. While satellite
observations have the advantage of global coverage and homogeneous quality, they also have disadvantages such
as their limited spatial and temporal resolution. To benefit the most from the spaceborne observations, the air
quality community might have to combine the satellite data with information from ground based sensors and
models.
On request of the European Commission’s DG Environment the Institute for Environment and Sustainability of
the Joint Research Centre is exploring the possibilities of how the use of remote sensing can facilitate
streamlining of existing monitoring systems today and in the near future.
1.2
Objectives
The Joint Research Centre has requested KNMI to perform a study on the applicability of remote sensing in the
field of air pollution. The objectives of this study are:
• Have an assessment of presently available scientific information on the feasibility to rely on remote sensing
techniques in the implementation of existing legislation, and describe opportunities for realistic streamlining
of monitoring in air quality and emissions, based on greater use of remote sensing.
• Have recommendations for the next policy cycle on the use of remote sensing through development of
appropriate provisions and new concepts, including, if appropriate, new environmental objectives, more
suited to the use of remote sensing.
• Have guidance on how to engage effectively with GMES and other initiatives in the air policy field projects.
This scientific review is the result of this study.
This report contains the following chapters:
Chapter 2 gives a review of the current and near future European legislation on air quality.
Chapter 3 gives a review of the current capabilities of satellites for monitoring the lower troposphere.
Chapter 4 gives an overview of the applicability of satellite data for air quality monitoring.
Chapter 5 contains the conclusions and recommendations.
12
2
Air Pollution Legislation
This section describes the existing and proposed European legislation on air pollution.
2.1
Convention on Long-Range Trans-boundary Air Pollution
The United Nations Economic Commission for Europe (UN/ECE) Convention on Long-Range Trans-boundary
Air Pollution (CLRTAP, www.unece.org/env/lrtap/) was the first international treaty to address air pollution. In
1972, the UN Conference on the Human Environment established a set of principles, including that States
(countries, as opposed to U.S. states) have “the responsibility to ensure that activities within their jurisdiction or
control do not cause damage to the environment of other States or of areas beyond the limits of national
jurisdiction”. Referring to this principle, LRTAP was negotiated to address transboundary air pollution primarily
among States in Europe, the former Soviet Union, and North America. Asia, the Middle East, northern Africa,
and central America as well as the entire Southern Hemisphere are not currently included in LRTAP.
Following the LRTAP convention the EC has introduced controls on emissions of sulphur, nitrous oxides (NOx),
volatile organic compounds (VOCs), heavy metals, persistent organic pollutants (POPs). The most recent
Protocol (Gothenburg, 1999) introduces a multi-pollutant, multi-effect approach to reduce emissions of sulphur,
NOx, VOCs and ammonia (NH3), in order to abate acidification of lakes and soils, eutrophication, ground-level
ozone, and to reduce the release in the atmosphere of toxic pollutants (heavy metals) and Persistent Organic
Pollutants (POP).
It is stated in the Convention that monitoring of the concentrations of air pollutants is necessary in order to
achieve the objectives. The Cooperative Programme for Monitoring and Evaluation of the long-range transport
of air pollutants in Europe (EMEP) provides this information. Parties to the Convention monitor AQ at regional
sites across Europe and submit data to EMEP. EMEP has three centres that coordinate these activities of which
NILU is one. There are two large databases; the measurement database and the emission database. The
AIRBASE database of the ETC/ACC forms the reference data set for the European ground-based observation
network. In addition to measurements, EMEP maintains and develops an atmospheric dispersion model. The
model calculates averages over a grid with a resolution of 50 km x 50 km. EMEP network density depends on
the species measured, for NO2 there are close to 100 sites, for VOC the number of measurement sites is less than
10. The required laboratory accuracy is 10 to 25%. At present 24 ECE countries participate in the EMEP
programme.
2.2
EU air quality directives 96/62/EC and its Daughter Directives and Amendments
The EC has introduced a series of Directives to control levels of certain pollutants and to monitor their
concentrations in the air ( In 1996, the Environment
Council adopted Framework Directive 96/62/EC on ambient air quality assessment and management. This
Directive covers the revision of previously existing legislation and the introduction of new air quality standards
for previously unregulated air pollutants. The list of atmospheric pollutants to be considered includes sulphur
dioxide, nitrogen dioxide, particulate matter, lead and ozone, benzene, carbon monoxide, poly-aromatic
hydrocarbons (PAH), cadmium, arsenic, nickel and mercury.
The general aim of this Directive is to define the basic principles of a common strategy to:
• define and establish objectives for ambient air quality in the Community designed to avoid, prevent or reduce
harmful effects on human health and the environment as a whole;
• assess the ambient air quality in Member States on the basis of common methods and criteria;
• obtain adequate information on ambient air quality and ensure that it is made available to the public, inter alia
by means of alert thresholds;
• maintain ambient air quality where it is good and improve it in other cases.
13
Meanwhile so-called Daughter Directives (Directive 1999/30/EC on SO2, NOx, PM10, Pb, Directive 2002/3/EC
on ozone, Directive 2000/69/EC on benzene and CO, Directive 2004/107/EC on As, Cd, Hg, Ni PAH’s), are
covering the list of atmospheric pollutants of the Framework Directive. In addition to the limit values given in
14
Table 2-1, other pollutants are required to be monitored regularly, in order to gain background information on
long-range transport or atmospheric processes. Such a list of “ozone precursors” (among others Fomaldehyde) is
mentioned in the Ozone Daughter Directive.
15
Table 2-1. Overview of the current (2006) and planned legislation in the Framework Directive 96/62/EC on
ambient air quality assessment and management and its Daughter Directives.
Substance
Sulfur dioxide
SO2:
Targeting
humans
Standard
24-hour average exceedance not
permitted on more than 3 days a
year.
hourly average; exceedance not
permitted for more than 24 hours a
year.
hourly average; observed during
three successive hours in an area of
at least 100 km2.
annual average and winter average
(1 October through 31 March)
annual average
Level
125 µg/m3
Status
limit value
350 µg/m3
limit value
500 µg/m3
alert threshold
20 µg/m3
limit value
40 µg/m3
200 µg/m3
400 µg/m3
nature
hourly average; exceedance not
permitted for more than 18 hours a
year.
hourly average; observed during
three successive hours in an area of
at least 100 km2.
annual average
limit value; with effect
from 2010 (in force since
2001)
limit value; with effect
from 2010 (in force since
2001)
alert threshold
30 µg/m3
limit value
humans
annual average
40 µg/m3
limit value
humans
50 µg/m3
limit value
humans
daily average exceedance not
permitted on more than 35 days a
year.
annual average
0.5 µg/m3
limit value
humans
annual average
5 µg/m3
humans
Maximum daily 8-hours mean
10 mg/m3
limit value; with effect
from 2005
limit value
humans
highest progressive daily 8-hour
average exceedance not permitted on
more than 25 days a year.
hourly average
hourly average;
AOT40
120 µg/m3
target value > 2010
180 µg/m3
240 µg/m3
208 000
µg/m3*h
6 ng/m3
information threshold
Alert threshold
Target value > 2010
humans
humans
nature
Nitrogen
dioxide (NO2)
humans
humans
humans
Nitrogen
oxides
(NO/NO2)
Particulate
matter (PM10)
Lead (Pb)
Benzene
Carbon
monoxide (CO)
Ozone (O3)
humans
humans
vegetation
Arsenic
Cadmium
Benzo(a)pyrene
humans
environment
humans
environment
humans
environment
5 ng/m3
1 ng/m3
16
Target value in PM10
fraction
Target value in PM10
fraction
Target value in PM10
fraction
2.3
EU National Emission Ceilings directive
According to the European Community directive 2001/81/EC (NEC directive), the member states have to reduce
by 2010 their emissions of certain atmospheric pollutants under national emission ceilings. The emission ceilings
are fixed for four pollutants (ammonia (NH3), nitrogen oxides (NOx), sulfur dioxide (SO2) and volatile organic
compounds (VOCs)) for each member state as well as for the European Union as a whole. The main objective of
the directive is to improve the protection of the environment and human health against risks of adverse effects
from eutrophication, acidification and ground level ozone.
The member states are obliged to report annually on their emissions and on emission projections up to 2010. In
addition, in 2002 and 2006 they have to establish a national program detailing the measures to be taken in order
to reach the ceiling.
In Table 2-2 and Table 2-3 list the emission ceilings to be attained for the individual member states and EU as a
whole.
Table 2-2. National emission ceilings for SO2, NOx, VOC and NH3, to be attained by 2010.
Member State
Austria
Belgium
Denmark
Finland
France
Germany
Greece
Ireland
Italy
Luxemburg
Netherlands
Portugal
Spain
Sweden
UK
EC 15
SO2
Kilotonnes
39
99
55
110
375
520
523
42
475
4
50
160
746
67
585
3850
NOx
Kilotonnes
103
176
127
170
810
1051
344
65
990
11
260
250
847
148
1167
6519
VOC
Kilotonnes
159
139
85
130
1050
995
261
55
1159
9
185
180
662
241
1200
6510
NH3
Kilotonnes
66
74
69
31
780
550
73
116
419
7
128
90
353
57
297
3110
Table 2-3. Emission ceilings for SO2, NOx, VOCs for the European Union to be attained by 2010.
EC 15
2.4
SO2
Kilotonnes
3634
NOx
Kilotonnes
5923
VOC
Kilotonnes
5581
Future Directions in Air Quality Policy
Within the European Communities Environmental Action Programme (6th EAP) the European Commission’s
Directorate General Environment (DG ENV) was requested to draft a “Thematic Strategy on Air Pollution”. It’s
objectives are to attain “levels of air quality that do not give rise to significant negative impacts on, and risks to
human health and the environment”. The Commission has examined current legislation and analyzed future
emissions and impacts on health and the environment. It showed that impacts will persist even with the effective
implementation of current legislation. Accordingly the Thematic Strategy on Air Pollution has been proposed
(COM (2005) 446), establishing interim objectives, proposing appropriate measures, recommending to
modernize current legislation, focusing on most serious pollutants and putting more emphasis on integration into
other policies and programmes.
A legislative proposal has been attached to the Strategy, combining the Framework Directive, First, Second and
Third Daughter Directive (see section 2.2). The proposal simplifies, clarifies, repeals obsolete provisions and
17
introduces new provisions on fine particulates. Monitoring and reporting of air quality data shall be modernized
and more emphasis on the spatial dimension shall be put. Additionally a cap for PM2.5 of 25 µg/m3 is proposed to
minimize human exposure to fine particulates.
The full text of the Thematic Strategy on Air Pollution can be found at
/>The proposal for a “Directive of the European Parliament and of the Council on Ambient Air Quality and
Cleaner Air for Europe” COM (2005) 447 is available at
/>
18
3
Satellite Observations of Air Pollution
3.1
Satellite Measurement Methods
3.1.1 Orbits
Remote sensing instruments on board earth orbiting satellites are able to measure atmospheric constituents on a
global scale. The spatial and temporal sampling and coverage of the measurement depend on the orbit of the
satellite and the viewing and scanning properties of the instrument. Most satellite instruments have been placed
on board polar orbiting platforms. These platforms circle the earth at a high of about 700 km over the poles in
about 100 minutes. With each orbit they cover a track on earth whose width depends on the viewing properties
of the instrument. This so-called swath width ranges from less than 100 to almost 3000 km. Most polar orbiting
satellites are sun-synchronous, which means that they cross the equator at a fixed local time. After each orbit the
earth has rotated such that the satellite instrument samples a different part of the earth. For wide swaths (>2000
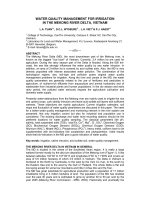
km) the instrument covers the full earth in one day, as shown in Figure 3-1.
Figure 3-1. Example of the measurements from a Sun synchronous orbit. The left image shows a single orbit of
OMI data plotted as false colour RGB for orbit 9061 of 29 March 2006. The image on the right
shows how all the orbits for this day cover the whole globe. Image courtesy of Ruud Dirksen,
KNMI.
Other orbits are:
• Geostationary (GEO): mostly used for weather satellites. The satellites is positioned above the equator at
such a high altitude (40.000 km) that they have the same rotational period as the earth. Therefore they always
see the same part of the earth, about 1/3 of the total surface. From these orbits the satellite instrument can
observe variations on short (5 min – hours) time variability, which is not possible for polar satellites.
• Non-sun-synchronous low earth orbits (LEO): orbiting at about the same altitude as polar satellites, but not
above the poles. These orbits can sample the same location more than once within a day.
A satellite track on the earth is subdivided into ground pixels. For each groundpixel a measurement is performed,
e.g. a trace gas column or surface albedo. Groundpixels for atmospheric measurements vary in size from 0.5 to
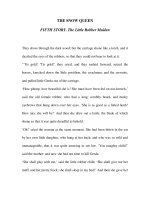
1000 km. Figure 3-2 shows an example of the ground pixel resolution of the OMI instrument.
19
Figure 3-2. OMI ground pixels for a part of an orbit covering Europe. Note that the ground pixel size varies
over the swath, with the best spatial resolution in the middle of the swath.
3.1.2 Viewing
Most satellite instruments that are looking down at earth (nadir viewing) provide the total column of a trace gas,
i.e. the integrated concentration from surface to the top of the atmosphere (about 60-100 km, depending on the
profile). For some species, mainly ozone, it is possible to derive height resolved information from nadir
observations. In the UV region the fact that ozone absorbs very strongly and the fact that this absorption varies
orders of magnitudes in a relatively small spectral region, makes it possible to retrieve ozone profile information.
In principle it is possible to derive a tropospheric column from nadir UV data, but this is very challenging on
measurement accuracy and correct physical modelling of radiation transport. Also in the infrared region it is
possible to derive some profile information through the dependence of the ozone emission and absorption on
pressure and temperature. In principle, this method can also be applied to other trace gases such as carbon
monoxide.
Satellite instruments that view the atmosphere sideways (limb viewing) do deliver profile information of several
trace gases. This can be done by measuring scattered sunlight, or through occultation of solar, lunar or stellar
light through the atmosphere. The first method is more difficult for retrieval since radiation transport modelling
required for the retrieval has to take the sphericity of the atmosphere into account. Occultation techniques are
more straightforward and deliver a higher accuracy, but the spatial coverage of the measurements is limited since
it is dependent on the position of the extraterrestrial light source. Limb viewing delivers profiles in the
stratosphere only. The troposphere cannot be probed from limb due to the long light path through the atmosphere
and the high spatial variability of the troposphere, especially the clouds.
3.1.3 Spectral properties and constituents
The constituents that a satellite instrument can measure depend on its spectral coverage and resolution.
It is important to note that not all constituents that fall under EU regulation can be measured by satellites.
Satellite instruments use spectral regions in the UV, Visible, Infrared, to microwave, i.e. from 250 nm to 10cm
wavelengths. Satellite instruments measure radiation whose properties have been affected by the atmosphere or
the surface (land, water, ice). To be able to measure a certain atmospheric constituent the instrument has to
measure in the spectral range in which it absorbs, emits or scatters radiation. The extent of the effect of its
presence on the radiation spectrum, together with the resolution and signal-to-noise of the instrument, determine
the accuracy of the measurement.
In the UV, Visible, and near-infrared satellite instruments measure reflected sunlight. A number of atmospheric
gases show absorption features in this spectral range and thus their concentration can in principle be inferred, or
retrieved. Aerosols can be measured though their contribution to scattering of solar radiation in the atmosphere.
20
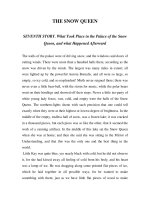
Certain aerosols also significantly absorb solar radiation (dust, soot). Figure 3-3 shows the absorption by
atmospheric ozone as a function of wavelength. The magnitude of the absorption in the UV region is such that
all solar radiation in this spectral region is blocked by the ozone in the stratosphere: the ozone layer. At
somewhat larger wavelengths the spectral variations of the absorption allow an accurate retrieval of ozone from
spectrally resolved satellite measurements of the earth radiance.
Figure 3-3. Ozone absorption cross section in the UV from 260 to 340 nm. Note that a logarithmic scale is used,
thus the absorption by ozone decrease by 4 orders of magnitude in this wavelength range.
In the Infrared satellite instrument measure the thermal radiation from the surface and the atmosphere. Trace
gases can be discerned through their absorption and emission. In the microwave region satellite instruments can
measure emission lines of molecules and thus retrieve amounts.
3.1.4 Retrieval: principles
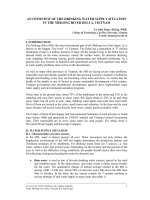
Figure 3-4 shows the reflectance of the earth atmosphere as viewed from space in the wavelength region where
ozone exhibits prominent absorption features (cf Figure 3-3). The reflectance is obtained by dividing the earth
radiance through the solar irradiance that enters the atmosphere: the reflectance thus depends on the optical
properties of the earth-atmosphere-surface system, the solar input is divided out.
21
Figure 3-4. OMI reflectance spectrum for a cloud-free scene over De Bilt, The Netherlands, on 2 April 2005.
Note that a logarithmic scale is used for the reflectance. Image by Robert Voors, KNMI.
How can this reflectance spectrum be used to derive the amount of ozone in the atmosphere? Clearly, more
ozone gives deeper absorption, but there are, besides ozone, other parameters that also determine the reflectance
spectrum. Evidently a model is needed that can be used to compute the reflectance given the properties of the
atmosphere, the surface and the viewing conditions: a forward model, in this case a radiative transfer model. The
following properties are needed to compute the reflectance:
Atmosphere
• Temperature profile
• Pressure profile
• Profiles of all trace gases that absorb in the spectral region of interest
• Profiles of all relevant aerosol properties (absorption and scattering coefficients) that absorb and/or
scatter in the spectral region of interest
• Profiles of scattering coefficients of cloud droplets and/or ice particles for the spectral region of interest
• Air mass factor
Surface
• Surface reflection functions relating incoming radiance to reflected radiance; in general this depends on
incident and outgoing angles.
Viewing conditions
• Viewing angles: polar angle with respect to nadir and azimuth angle with respect to e.g. local North
• Solar angles: polar angle with respect to zenith and azimuth angle with respect to e.g. local North
(Note that these four angles vary with position along the line-of –sight due to the curvature of the
atmosphere)
In general the viewing conditions are very well known, but for the atmospheric and surface properties
assumptions have to be made. Temperature and pressure can be obtained from climatologies or from
meteorological models. The spectral region for retrieval is often chosen such that the trace gas to be retrieved
shows the dominant absorption and the effect of other trace gases can be relatively easy corrected for. Aerosols
pose a significant problem for most retrievals. Their properties are very variable in time and space and their
22
properties for a given scene are often not well known. In most cases the bulk of the aerosols reside in the lowest
layers and their effect on the radiance mimics the surface reflectance: part of the radiance is absorbed, part is
scattered back. Fitting the surface reflectance as one of the unknowns in the retrieval then accounts for aerosols
to some degree. Aerosol presence in higher layers, like desert dust outbreaks or biomass burning often lead to
error in the retrieval if not accounted for.
Apart from the forward model, an inversion method has to be applied to derive the unknown parameter (e.g.
ozone profile or column) from the measured reflectance. The unknown parameters are adjusted until the
modelled and measured reflectance agree within the bounds of the measurement error. The straightforward way
of doing this is to minimize the (squared-sum) difference between the two spectra, weighted with the
measurement errors: least-squares fitting. In case the forward model is linear in the fitted parameters the
minimum is easily found by inverting the matrix corresponding to the forward model. Since the forward model is
usually non-linear, some search method has to be applied to find the minimum. For mildly non-linear models,
the minimum can be found by linearizing the model around some initial estimate and iteratively applying the
matrix inversion and re-computing the forward matrix for the new set of fit parameters: the Gauss-Newton
method. The linearized model constitutes the matrix of derivatives of all measurements with respect to all fit
parameters: the Jacobian.
A more robust search method that can be applied to non-linear models is the Levenberg-Marquardt method.
Often in retrieval applications, the retrieval problem is underdetermined: more fit parameters are attempted than
there is information in the measurement. This is often the case for profile retrievals. A profile retrieval assigns a
set of concentrations at various altitudes or pressures as the set of fit parameters. The measurement contains only
limited information on the vertical profile and therefore a priori information is needed to stabilize the retrieval.
The optimal estimation method [Rodgers, 2000] is the most popular for such profile retrievals.
3.1.5 Retrieval: Differential Optical Absorption Spectroscopy (DOAS)
Differential Optical Absorption Spectroscopy (DOAS) is a special type of retrieval that can be used to retrieve
trace gas total columns from earthshine spectra with sufficient spectral resolution to distinguish multiple
absorption structures of the trace gas. Figure 3-5 shows a spectral window from which ozone total column can be
retrieved by DOAS. The DOAS method is to infer from the spectrum a single measured quantity which relates in
a simple (sometimes linear) manner to the total column. This quantity is the slant column density and can be
interpreted as the column density of the trace gas, not along the vertical direction, but along the average light
path of the solar light through the atmosphere. It is derived by fitting the reflectance with the absorption crosssections and a lower order polynomial to account for slowly varying parameters that govern the reflectance.
Figure 3-5. Example of a DOAS fit of ozone in the fit window selected for OMI [Veefkind et al., 2006]
23
For the conversion of the slant column density into a vertical column density a so-called air mass factor is used,
which is defined as the ratio of the slant column and the vertical column densities. For cases when the scattering
can be ignored, i.e. for the retrieval of trace gases in the near-infrared, the air mass factor can be approximated
by the geometrical air mass factor. However, in the UV and visible part of the spectrum, scattering in the
atmosphere has be account for. In this case, the computation of the air mass factor requires radiative transfer
modelling, taking scattering, surface reflection, cloud effects and for strong absorbers such as ozone, the trace
gas profile into account. For many tropospheric trace gas retrievals, the largest uncertainty are in the air mass
factor [Boersma et al. 2004].
3.1.6 Retrieval: tropospheric NO2 (example)
Tropospheric nitrogen dioxide (NO2) is retrieved using DOAS yielding the total column density, followed by a
correction for the stratospheric column. Figure 3-6 shows the spectral window from which NO2 is retrieved. The
spectral structures in the reflectance spectrum due to nitrogen dioxide absorption are less pronounced than for
ozone. There are two reasons for this: (1) the absorption of NO2 is weak, and (2) other features as for example
ozone and the Ring-effect contribute to the spectral structure in this wavelength region. For these reasons the
nitrogen dioxide columns are retrieved with a lower precision than ozone columns.
Figure 3-6. Example of an OMI spectrum for the NO2 fit window as measured over Belgium on 15 March 2006.
In blue: reflectance spectrum normalized using a second order polynomial. In red: absorption
cross-section of NO2 in the same wavelength region. Data courtesy of Ben Veihelmann, KNMI.
Interesting cases for tropospheric nitrogen dioxide retrieval are polluted scenes, as shown in Figure 3-10. The
nitrogen dioxide vertical profiles for polluted cases show that a very large fraction of the total column resides in
the boundary layer. The sensitivity of the spectral measurement for nitrogen dioxide is much smaller for these
lower layers than for layers higher up. The low surface albedo of cloud free scenes means that most of the
measured light comes from scattering in the atmosphere and therefore not much light has passed through the
polluted boundary layer. This is corrected using the appropriate air mass factor and an assumed nitrogen dioxide
profile. Obviously this leads to larger uncertainties in NO2 determination. Boersma et al. [2004] have shown that
errors up to 50% in the air mass factor for polluted scenes result from profile uncertainties.
For air pollution studies the tropospheric column is of interest, so the stratospheric column of nitrogen dioxide
needs to be deducted from the total column. There are several methods in use to do this. They have in common
that they use total column measurements above sites that are remote from nitrogen dioxide sources and therefore
have a very small tropospheric column. The difference between the stratospheric column above the remote site
and the site of interest is them found by applying a model or smooth functions.
3.1.7 Summary of properties of air quality satellite measurement
The main properties of satellite observations for constituents that are relevant for air quality are summarized.
Table 3-2 links the species that can be observed from space to the pollutants regulated in the EU Directives.
24
Table 3-1. Main properties of satellite measurements for satellite measurement relevant for air quality.
Property
Temporal sampling
Integration time
Spatial averaging (vertical)
Spatial averaging (horizontal)
Spatial coverage (vertical)
Spatial coverage (horizontal)
Characteristic Value
1-3 times per 24hr
±1 sec
Tropospheric column (0 - ±10 km)
1 – 100 km
troposphere
Global in 1 – 6 days
Table 3-2. Link between species that can be measured using satellite remote sensing and the related regulated
pollutants.
Satellite Measurement
Tropospheric Ozone
Tropospheric NO2 Column
Tropospheric SO2 Column
Tropospheric CO Column
Aerosol Properties1:
Optical depth
Single scattering albedo
Ångström parameter
Fine mode fraction
Formaldehyde Column
Related regulated pollutant
Ozone concentration on ground level (EU Directive 2002/3/EC)
NO2 concentration on ground level (EU Directive 1999/30/EC)
NOx National Emission Ceiling (EU Directive 2001/81/EC)
SO2 concentration on ground level (EU Directive 1999/30/EC)
CO concentration on ground level (EU Directive 2000/69/EC)
PM10 concentration on ground level (EU Directive 1999/30/EC)
Formaldehyde concentration on ground level (EU Directive 2002/3/EC)2
1
The aerosol optical properties are related to the physcical/chemical aerosol properties in the following manner. Aerosol
optical depth is the vertically integrated aerosol extinction and is a proxy for total aerosol mass. The single scattering albedo
is a measure for the absorption and is an indicator for the aerosol composition or type. The Ångström parameter is an
indicator for the aerosol size distribution.
2
EU Directive 2002/3/EC formaldehyde is not regulated, but has to be regularly monitored, because of its role in ozone
formation.
Compared to ground based measurements of constituents relevant for air quality, we can conclude that satellite
observations do not:
• Measure air quality directly at the altitude relevant for (human) exposure (0 – 10 m).
• Measure air quality with sufficient temporal sampling and averaging to determine exposure.
• Measure all relevant constituents to determine the exposure to air quality .
• Measure air quality with such a high spatial resolution that exposure in individual streets can be
determined.
• Measure air quality for clouded days.
Compared to ground based measurements satellite observations do:
• Deliver daily information on air quality on the continental - global scale.
• Deliver information on the spatial distribution of air quality with a resolution up to 1-10 km.
3.2
Current and planned satellite instruments
In this section an overview is given over the current and planned satellite instruments that are capable of
observing tropospheric pollutants. An important input to this section is the IGACO report [IGACO, 2004], which
describes amongst others the current and planned satellite missions.
To be useful for monitoring air quality, sufficient spatial and temporal resolutions are required. This section is
therefore limited to satellite instruments that meet these requirements. Table 3-3 provides an overview of the
instruments listed for each atmospheric species. It should be noted that Table 3-3 doesn’t provide a ranking of
25
the quality of the observations, the only criterion used is that an instrument can be used to detect tropospheric
pollution. The vast majority of the instruments are passive instruments that detect backscattered Solar radiance
from polar orbiting satellites.
3.2.1 UV-Visible spectrometers
Important satellite instruments for the trace gases ozone, nitrogen dioxide, sulfur dioxide and formaldehyde are
the UV/VIS spectrometers. The first of this type of instruments was GOME-1 on the European ERS-1 satellite.
GOME-1 had a large ground pixel size of 320 x 40 km2 and a swath with of 900 km, providing global coverage
in 3 days. SCIAMACHY on the European Envisat satellite is the successor of the GOME-1 instrument.
SCIAMACHY provides a better spatial resolution of 30 x 60 km2. The swath width of SCIAMACHY is
comparable to GOME-1, but because SCIAMACHY is sharing its observation time between nadir and limb
measurements, global coverage takes 9 days. OMI on the NASA EOS Aura satellite combines an improved
spatial resolution of 13 x 24 km2 at nadir with daily global coverage. However, compared to the SCIAMACHY
instrument the spectral range is reduced, therefore OMI cannot measure all the trace gases of SCIAMACHY. On
the operational METOP satellites, three GOME-2 instruments are planned. GOME-2 will have a spatial
resolution of 40 x 40 km2 at nadir and a 2000 km swath. Providing global coverage will take 1 day at the midlatitudes and 2 days in the tropics. On the operational NPOESS satellites an OMPS instrument is planned, but
given its spectral resolution and wavelength range, this instrument will probably be limited to ozone
measurements. OMPS achieves global coverage in one day with a spatial resolution of 50 x 50 km2 at nadir.
Besides these current and planned missions, several research instruments have been proposed that provided
multiple measurements a day with a spatial resolution of 10 x 10 km2 at nadir or smaller.
3.2.2 Aerosol instruments
The first dedicated aerosol instruments were launched in the 1990’s, before that only measurements are available
of instruments that were not designed for measuring aerosols [King et al., 1999]. Currently the most used dataset
for aerosols is from the MODIS instruments on the NASA EOS Terra and Aqua instruments. However,
instruments with multiple viewing angles, such as ATSR and MISR, or even multiple viewing angles combined
with polarization, such as Polder and APS, provide more information on aerosols. In addition to the passive
aerosol instruments, also the first LIDAR systems have been launched. These active LIDAR systems provide
information on the vertical profile of aerosols, however they only measure at nadir and do not provide global
coverage. It is therefore clear that these LIDARs have to be used in combination with the traditional passive
techniques. On operational meteorological missions, dedicated aerosol instruments are planned on the USA
NPOESS series, carrying the VIIRS and APS instruments. The dedicated aerosol instruments have a spatial
resolution of 10 x 10 km2 at nadir, and daily global coverage in less than one day, in case of combination of
MODIS instruments on Terra and Aqua, to several days.
3.2.3 Infrared instruments
Some gases, such as carbon monoxide can only be measured in the infrared part of the spectrum. In addition, for
some gases like ozone it is easier to obtain profile information from the infrared. A big advantage of making
measurements in the infrared is that data can be also obtained during the night, when no solar radiance is
available. Current instruments that are targeted to tropospheric carbon monoxide are MOPITT, SCIAMACHY,
AIRS, TES and IASI. TES also aims to directly measuring tropospheric ozone. IASI will measure ozone
profiles, but is not dedicated to tropospheric ozone. The spatial resolution of these instruments varies from 22 x
22 km2 for MOPITT to 30x120 km2 for SCIAMACHY. For these instruments, global coverage is achieved in
approximately 3-9 days. TES is an exception, because it only provides nadir measurements, thus providing no
complete spatial coverage.
3.2.4 Future missions
The most important satellite programs relevant to air quality that are currently active are the research programs
ERS/ENVISAT of ESA and the EOS program of NASA. Both are scientific programs and specifically not
targeted on operational atmospheric monitoring. The lifetime of ENVISAT has recently been extended to 2015.
26
The three major missions of the EOS program, Terra, Aqua and Aura, are expected to end between 2010 and
2015.
For the time period after 2010 it is expected that the GMES initiative will be important in providing innovative
systems. The aim of the CAPACITY project (www.knmi.nl/capacity) included the definition of satellite
components of a future operational system to monitor atmospheric composition for implementation by ESA/EU
within the Space Component of GMES. This project has delivered user requirements in a number of fields,
including air quality. The conclusions of the CAPACITY study are, amongst other, that a combination of a
geostationary (GEO) and low earth orbit (LEO) satellites are needed to fulfill the user requirements. As a
compromise a constellation of three satellites in an orbit with low inclination is mentioned.
Current and planned operational missions for operational air quality monitoring include:
• EUMETSAT Polar System (EPS-MetOp) including GOME-2 and IASI (2006-2020);
• EUMETSAT Post-EPS program (2020-);
• ESA/EU GMES Sentinel Programme nominally including Sentinels 4 and 5 dedicated to atmospheric
chemistry monitoring, required to bridge the gap between current capabilities and the timeframe beyond
2020. Sentinel 3 is dedicated to ocean color but will also provide information on aerosols.
• US NPOESS Preparatory Program (NPP) (2007-2011);
• US National Polar-orbiting Operational Environment Satellite System (NPOESS) (2010-).
For the Meteosat Third Generation (MTG), EUMETSAT has conducted pre-Phase A studies for air quality
monitoring sensors on a geostationary platform, with a focus on Europe. The Meteosat Third Generation is
planned for the period 2015-2025. However, the air quality sensors are currently not in the baseline for MTG.
In addition to the operational programs, the TRAQ (Tropospheric composition and Air Quality) mission is one
of the six missions that have been selected for a pre-Phase-A study within the ESA Earth Explorer program. The
TRAQ mission main objective is to study air quality and tropospheric chemistry globally, with a special focus on
Europe. Of these six missions that are going to the pre-Phase-A, one will be selected for launch after 2012.
27
Table 3-3. Overview of relevant current and planned satellite instruments for observing tropospheric pollutants. Adapted from IGACO [2004].
y
Ozone (O3)
Satellite Instrument
TOMS
ERS-2 GOME-1
ENVISAT SCIAMACHY
TES/OMI
AURA/OMI
METOP GOME-2
METOP IASI
NPP OMPS
NPOESS OMPS
Agency
NASA
ESA
GE/NL/BE
NASA
NL/FI
Eumetsat
Eumetsat
NOAA/NASA/DOD
NOAA/NASA/DOD
00
01
02
03
04
05
06
07
08
09
10
11
12
13
14
15
Carbon Monoxide (CO)
Satellite Instrument
Terra MOPITT
ENVISAT SCIAMACHY
AQUA AIRS
AURA TES
METOP IASI
Agency
NASA
GE/NL/BE
NASA
NASA
Eumetsat
00
01
02
03
04
05
06
07
08
09
10
11
12
13
14
15
Formaldehyde (HCHO)
Satellite Instrument
ERS-2 GOME-1
ENVISAT SCIAMACHY
AURA/OMI
METOP GOME-2
Agency
ESA
GE/NL/BE
NL/FI
Eumetsat
00
01
02
03
04
05
06
07
08
09
10
11
12
13
14
15
28
Nitrogen Dioxide (NO2)
Satellite Instrument
ERS-2 GOME-1
ENVISAT SCIAMACHY
AURA/OMI
METOP GOME-2
Agency
ESA
GE/NL/BE
NL/FI
Eumetsat
00
01
02
03
04
05
06
07
08
09
10
11
12
13
14
15
Sulfur Dioxide (SO2)
Satellite Instrument
ERS-2 GOME-1
ENVISAT SCIAMACHY
AQUA AIRS
AURA/OMI
METOP GOME-2
NPP OMPS
NPOESS OMPS
Agency
ESA
GE/NL/BE
NASA
NL/FI
Eumetsat
NOAA/NASA/DOD
NOAA/NASA/DOD
00
01
02
03
04
05
06
07
08
09
10
11
12
13
14
15
29
Satellite Instrument
Aerosol Optical Properties
NOAA AVHRR
MVIRI/SEVIRI
METOP AVHRR3
NPP VIIRS
NPOESS VIIRS
NPOESS APS
TOMS
ERS-2/ENVISAT ATSR-2/AATSR
TERRA-AQUA MODIS
TERRA MISR
ENVISAT SCIAMACHY
AURA/OMI
Parasol/Polder
Icesat / GLAS
ALADIN
CALIPSO
EarthCare/ATLID
Agency
00
01
02
NOAA
Eumetsat
NOAA
NOAA/NASA/DOD
NOAA/NASA/DOD
NOAA/NASA/DOD
NASA
ESA
NASA
NASA
GE/NL/BE
NL/FI
CNES
NASA
ESA
NASA
ESA
Legend
Research Instrument
Pre-Operational
Operational
30
03
04
05
06
07
08
09
10
11
12
13
14
15