Tài liệu Faecal pollution and water quality ppt
Bạn đang xem bản rút gọn của tài liệu. Xem và tải ngay bản đầy đủ của tài liệu tại đây (269.74 KB, 51 trang )
51
CHAPTER 4
Faecal pollution and water quality
F
aecal pollution of recreational water can lead to health problems because of the
presence of infectious microorganisms. These may be derived from human sewage
or animal sources.
This chapter relates to recreational water activities where whole-body contact takes
place (i.e., those in which there is a meaningful risk of swallowing water).
4.1 Approach
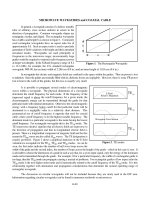
Water safety or quality is best described by a combination of sanitary inspection and
microbial water quality assessment. This approach provides data on possible sources
of pollution in a recreational water catchment, as well as numerical information on
the actual level of faecal pollution. Combining these elements provides a basis for a
robust, graded, classification as shown in Figure 4.1.
FIGURE 4.1. SIMPLIFIED CLASSIFICATION MATRIX
Sanitary inspection
Microbial water quality assessment
Decreasing quality
Decreasing quality
VERY GOOD
GOOD
FAIR
VERY POOR
POOR
52 GUIDELINES FOR SAFE RECREATIONAL WATER ENVIRONMENTS
Is the water body used for contact recreation? Unclassified (reassess if usage changes)
NO
Sanitary inspection category Microbial water quality assessment
YES
Very good Good Fair Poor Very poor
Good (but unsuitable for
several days after rain)
Very good (but unsuitable
for several days after rain)
Fair (but unsuitable for
several days after rain)
Water subject to occasional and
predictable deterioration*
*where users can be shown to be effectively discouraged from entering the water following occasional and predictable water
quality deteriorations (linked to, for example, rainfall), the area may be upgraded to reflect the water quality that users are
exposed to, but only with the accompanying explanatory material.
Classification
FIGURE 4.2. SIMPLIFIED FRAMEWORK FOR ASSESSING RECREATIONAL WATER ENVIRONMENTS
The results of the classification can be used to:
• grade beaches in order to support informed personal choice;
•provide on-site guidance to users on relative safety;
• assist in the identification and promotion of effective management
interventions; and
•provide an assessment of regulatory compliance.
In some instances, microbial water quality may be strongly influenced by factors
such as rainfall leading to relatively short periods of elevated faecal pollution. Expe-
rience in some areas has shown the possibility of advising against use at such times
of increased risk and, furthermore, in some circumstances that individuals respond
to such messages. Where it is possible to prevent human exposure to pollution hazards
in this way this can be taken into account in both grading and advice. Combining
classification (based on sanitary inspection and microbial quality assessment) with
prevention of exposure at times of increased risk leads to a framework for assessing
recreational water quality as outlined in Figure 4.2.
The resulting classification both supports activities in pollution prevention (e.g.,
reducing stormwater overflows) and provides a means to recognise and account for
local cost-effective actions to protect public health (e.g., advisory signage about rain
impacts).
4.2 Health effects associated with faecal pollution
Recreational waters generally contain a mixture of pathogenic and non-pathogenic
microorganisms. These microorganisms may be derived from sewage effluents, the
recreational population using the water (from defecation and/or shedding), livestock
(cattle, sheep, etc.), industrial processes, farming activities, domestic animals (such
as dogs) and wildlife. In addition, recreational waters may also contain free-living
pathogenic microorganisms (chapter 5). These sources can include pathogenic organ-
isms that cause gastrointestinal infections following ingestion or infections of the
upper respiratory tract, ears, eyes, nasal cavity and skin.
Infections and illness due to recreational water contact are generally mild and so
difficult to detect through routine surveillance systems. Even where illness is more
severe, it may still be difficult to attribute to water exposure. Targeted epidemiolog-
ical studies, however, have shown a number of adverse health outcomes (including
gastrointestinal and respiratory infections) to be associated with faecally polluted
recreational water. This can result in a significant burden of disease and economic
loss.
The number of microorganisms (dose) that may cause infection or disease depends
upon the specific pathogen, the form in which it is encountered, the conditions of
exposure and the host’s susceptibility and immune status. For viral and parasitic pro-
tozoan illness, this dose might be very few viable infectious units (Fewtrell et al.,
1994; Teunis, 1996; Haas et al., 1999; Okhuysen et al., 1999; Teunis et al., 1999).
In reality, the body rarely experiences a single isolated encounter with a pathogen,
and the effects of multiple and simultaneous pathogenic exposures are poorly under-
stood (Esrey et al., 1985).
The types and numbers of pathogens in sewage will differ depending on the inci-
dence of disease and carrier states in the contributing human and animal populations
and the seasonality of infections. Hence, numbers will vary greatly across different
parts of the world and times of year. A general indication of pathogen numbers in
raw sewage is given in Table 4.1.
In both marine and freshwater studies of the impact of faecal pollution on the
health of recreational water users, several faecal index bacteria, including faecal strep-
tococci/intestinal enterococci (see Box 4.1), have been used for describing water
quality. These bacteria are not postulated as the causative agents of illnesses in swim-
mers, but appear to behave similarly to the actual faecally derived pathogens (Prüss,
1998).
Available evidence suggests that the most frequent adverse health outcome asso-
ciated with exposure to faecally contaminated recreational water is enteric illness,
such as self-limiting gastroenteritis, which may often be of short duration and may
not be formally recorded in disease surveillance systems. Transmission of pathogens
that can cause gastroenteritis is biologically plausible and is analogous to waterborne
disease transmission in drinking-water, which is well documented. The association
has been repeatedly reported in epidemiological studies, including studies demon-
strating a dose–response relationship (Prüss, 1998).
CHAPTER 4. FAECAL POLLUTION AND WATER QUALITY 53
54 GUIDELINES FOR SAFE RECREATIONAL WATER ENVIRONMENTS
TABLE 4.1. EXAMPLES OF PATHOGENS AND INDEX ORGANISM CONCENTRATIONS IN RAW SEWAGE
a
Pathogen/index organism Disease/role Numbers per 100 ml
Bacteria
Campylobacter spp. Gastroenteritis 10
4
–10
5
Clostridium perfringens spores Index organism 6 ¥ 10
4
- 8 ¥ 10
4
Escherichia coli Index organism (except specific strains) 10
6
–10
7
Faecal streptococci/intestinal enterococci Index organism 4.7 ¥ 10
3
- 4 ¥ 10
5
Salmonella spp. Gastroenteritis 0.2–8000
Shigella spp. Bacillary dysentery 0.1–1000
Viruses
Polioviruses Index organism (vaccine strains), 180-500 000
poliomyelitis
Rotaviruses Diarrhoea, vomiting 400–85 000
Adenoviruses Respiratory disease, gastroenteritis not enumerated
b
Norwalk viruses Diarrhoea, vomiting not enumerated
b
Hepatitis A Hepatitis not enumerated
b
Parasitic protozoa
c
Cryptosporidium parvum oocysts Diarrhoea 0.1–39
Entamoeba histolytica Amoebic dysentery 0.4
Giardia lamblia cysts Diarrhoea 12.5–20 000
Helminths
c
(ova)
Ascaris spp. Ascariasis 0.5–11
Ancylostoma spp. and Necator sp. Anaemia 0.6–19
Trichuris spp. Diarrhoea 1–4
a
Höller (1988); Long & Ashbolt (1994); Yates & Gerba (1998); Bonadonna et al. 2002.
b
Many important pathogens in sewage have yet to be adequately enumerated, such as adenoviruses, Norwalk-like viruses,
hepatitis A virus.
c
Parasite numbers vary greatly due to differing levels of endemic disease in different regions.
A cause–effect relationship between faecal or bather-derived pollution and acute
febrile respiratory illness (AFRI) and general respiratory illness is also biologically
plausible. A significant dose–response relationship (between AFRI and faecal strep-
tococci) has been reported in Fleisher et al. (1996a). AFRI is a more severe health
outcome than the more frequently assessed self-limiting gastrointestinal symptoms
(Fleisher et al., 1998). When compared with gastroenteritis, probabilities of con-
tacting AFRI are generally lower and the threshold at which illness is observed is
higher.
A cause–effect relationship between faecal or bather-derived pollution and ear
infection has biological plausibility. However, ear problems are greatly elevated in
bathers over non-bathers even after exposure to water with few faecal index organ-
isms (van Asperen et al., 1995). Associations between ear infections and microbio-
logical indices of faecal pollution and bather load have been reported (Fleisher et al.,
1996a). When compared with gastroenteritis, the statistical probabilities are gener-
ally lower and are associated with higher faecal index concentrations than those for
gastrointestinal symptoms and for AFRI.
BOX 4.1 FAECAL STREPTOCOCCI/INTESTINAL ENTEROCOCCI
F
aecal streptococci is a bacterial group that has been used as an index of faecal pollution in recre-
ational water; however, the group includes species of different sanitary significance and survival char-
acteristics (Gauci, 1991; Sinton & Donnison, 1994). In addition, streptococci species prevalence differs
between animal and human faeces (Rutkowski & Sjogren, 1987; Poucher et al., 1991). Furthermore, the tax-
onomy of this group has been subject to extensive revision (Ruoff, 1990; Devriese et al., 1993; Janda, 1994;
Leclerc et al., 1996). The group contains species of two genera—Enterococcus and Streptococcus (Holt et
al., 1993). Although several species of both genera are included under the term enterococci (Leclerc et al.,
1996), the species most predominant in the polluted aquatic environments are Enterococcus faecalis, E.
faecium and E. durans (Volterra et al., 1986; Sinton & Donnison, 1994; Audicana et al., 1995; Borrego et al.,
2002).
Enterococci, a term commonly used in the USA, includes all the species described as members of the genus
Enterococcus that fulfil the following criteria: growth at 10 °C and 45°C, resistance to 60°C for 30 min,
growth at pH 9.6 and at 6.5% NaCl, and the ability to reduce 0.1% methylene blue. Since the most common
environmental species fulfil these criteria, in practice the terms faecal streptococci, enterococci, intestinal
enterococci and Enterococcus group may refer to the same bacteria.
In order to allow standardization, the International Organization for Standardization (ISO, 1998a) has
defined the intestinal enterococci as the appropriate subgroup of the faecal streptococci to monitor (i.e.,
bacteria capable of aerobic growth at 44 °C and of hydrolysing 4-methylumbelliferyl-
b-D-glucoside in the
presence of thallium acetate, nalidixic acid and 2,3,5-triphenyltetrazolium chloride, in specified liquid
medium). In this chapter, the term intestinal enterococci has been used, except where a study reported the
enumeration of faecal streptococci, in which case the original term has been retained.
It may be important to identify human versus animal enterococci, as greater human health risks (prima-
rily enteric viruses) are likely to be associated with human faecal material—hence the emphasis on human
sources of pollution in the sanitary inspection categorisation of beach classification (see Table 4.12). Grant
et al. (2001) presented a good example of this approach. They demonstrated that enterococci from stormwa-
ter, impacted by bird faeces and wetland sediments and from marine vegetation, confounded the assess-
ment of possible bather impact in the surf zone at southern Californian beaches. There will, however, be
cases where animal faeces is an important source of pollution in terms of human health risk.
Increased rates of eye symptoms have been reported among swimmers, and evi-
dence suggests that swimming, regardless of water quality, compromises the eye’s
immune defences, leading to increased symptom reporting in marine waters. Despite
biological plausibility, no credible evidence for increased rates of eye ailments asso-
ciated with water pollution is available (Prüss, 1998).
Some studies have reported increased rates of skin symptoms among swimmers,
and associations between skin symptoms and microbial water quality have also been
reported (Ferley et al., 1989; Cheung et al., 1990; Marino et al., 1995; see also
chapter 8). Controlled studies, however, have not found such association and the
relationship between faecal pollution and skin symptoms remains unclear. Swimmers
with exposed wounds or cuts may be at risk of infection (see also chapter 5) but there
is no evidence to relate this to faecal contamination.
CHAPTER 4. FAECAL POLLUTION AND WATER QUALITY 55
Most epidemiological investigations either have not addressed severe health out-
comes (such as hepatitis, enteric fever or poliomyelitis) or have been undertaken in
areas of low endemicity or zero reported occurrence of these diseases. Considering
the strong evidence for transmission of self-limiting gastroenteritis, much of which
may be of viral etiology, transmission of infectious hepatitis (hepatitis A and E viruses)
and poliomyelitis is biologically plausible, should exposure of susceptible persons
occur. However, poliomyelitis was not found to be associated with bathing in a 5-
year retrospective study relying on total coliforms as the principal water quality index
(Public Health Laboratory Service, 1959). Furthermore, sero-prevalence studies for
hepatitis A among windsurfers, waterskiers and canoeists who were exposed to con-
taminated waters have not identified any increased health risks (Philipp et al., 1989;
Taylor et al., 1995). However, there has been a documented association of transmis-
sion of Salmonella paratyphi, the causative agent of paratyphoid fever, with recre-
ational water use (Public Health Laboratory Service, 1959). Also, significantly higher
rates of typhoid have been observed in Egypt among bathers from beaches polluted
with untreated sewage compared to bathers swimming off relatively unpolluted
beaches (El Sharkawi & Hassan, 1982).
More severe health outcomes may occur among recreational water users swim-
ming in sewage-polluted water who are short-term visitors from regions with low
endemic disease incidence. Specific control measures may be justified under such
circumstances.
Outbreak reports have noted cases of diverse health outcomes (e.g., gastrointesti-
nal symptoms, typhoid fever, meningoencephalitis) with exposure to recreational
water and in some instances have identified the specific etiological agents responsi-
ble (Prüss, 1998). The causative agents of outbreaks may not be representative of the
“background” disease associated with swimming in faecally polluted water as detected
by epidemiological studies. Table 4.2 lists pathogens that have been linked to swim-
ming-associated disease outbreaks in the USA between 1985 and 1998.
56 GUIDELINES FOR SAFE RECREATIONAL WATER ENVIRONMENTS
TABLE 4.2. OUTBREAKS ASSOCIATED WITH RECREATIONAL WATERS IN THE USA, 1985–1998
a
Etiological agent Number of cases Number of outbreaks
Shigella spp. 1780 20
Escherichia coli O157:H7 234 9
Leptospira sp. 389 3
Giardia lamblia 65 4
Cryptosporidium parvum 429 3
Norwalk-like viruses 89 3
Adenovirus 3 595 1
Acute gastrointestinal infections (no agent identified) 1984 21
a
From Kramer et al. (1996); Craun et al. (1997); Levy et al. (1998).
Two pathogenic bacteria, enterohaemorrhagic Escherichia coli and Shigella sonnei,
and two pathogenic protozoa, Giardia lamblia and Cryptosporidium parvum, are of
special interest because of the circumstances under which the associated outbreaks
occurred—i.e., usually in very small, shallow bodies of water that were frequented
by children. Epidemiological investigations of these, and similar, outbreaks suggest
that the source of the etiological agent was usually the bathers themselves, most likely
children (Keene et al., 1994; Cransberg et al., 1996; Voelker, 1996; Ackman et al.,
1997; Kramer et al., 1998; Barwick et al., 2000). Each outbreak affected a large
number of bathers, which might be expected in unmixed small bodies of water con-
taining large numbers of pathogens. Management of these small bodies of water is
similar to management of swimming pools (see Volume 2 of the Guidelines for Safe
Recreational Water Environments).
Outbreaks caused by Norwalk-like viruses and adenovirus 3 are more relevant, in
that the sources of pathogens were external to the beaches and associated with faecal
contamination. However, high bather density has been suggested to account for high
enterovirus numbers at a Hawaiian beach (Reynolds et al., 1998). Leptospira sp. are
usually associated with animals that urinate into surface waters, and swimming-asso-
ciated outbreaks attributed to Leptospira sp. are rare (see chapter 5). Conversely, out-
breaks of acute gastrointestinal infections with an unknown etiology are common,
with the symptomatology of the illness frequently being suggestive of viral infections.
The serological data shown in Table 4.3 suggest that Norwalk virus has more poten-
tial than rotavirus to cause swimming-associated gastroenteritis (WHO, 1999),
although these results were based on a limited number of subjects. Application of
reverse transcriptase-polymerase chain reaction technology has indicated the presence
of Norwalk-like viruses in fresh and marine waters (Wyn-Jones et al., 2000).
CHAPTER 4. FAECAL POLLUTION AND WATER QUALITY 57
TABLE 4.3. SEROLOGICAL RESPONSE TO NORWALK VIRUS AND ROTAVIRUS IN CHILDREN
WITH RECENT SWIMMING-ASSOCIATED GASTROENTERITIS
a,b
Antigen Number of subjects Age range Number with 4-fold titre increase
Norwalk virus 12 3 months–12 years 4
Rotavirus 12 3 months–12 years 0
a
From WHO (1999).
b
Acute and convalescent sera were obtained from swimmers who suffered from acute gastroenteritis after
swimming at a highly contaminated beach in Alexandria, Egypt. On the day after the swimming event and
about 15 days later sera were obtained from 12 subjects, all of whom were less than 12 years old.
4.3 Approaches to risk assessment and risk management
Regulatory schemes for the microbial quality of recreational water have been largely
based on percentage compliance with faecal index organism counts (EEC, 1976; US
EPA, 1998). Constraints to these approaches include the following:
•Management actions are retrospective and can be deployed only after human
exposure to the hazard.
•In many situations, the risk to health is primarily from human excreta, yet the
traditional indices of faecal pollution are also derived from other sources. The
response to non-compliance, however, typically concentrates on sewage treat-
ment or outfall management as outlined below.
• There is poor interlaboratory comparability of microbiological analytical data.
•Beaches are classified as either safe or unsafe, although there is, in fact, a gra-
dient of increasing variety and frequency of health effects with increasing faecal
pollution of human and animal origin.
Traditionally, regulation tends to focus response upon sewage treatment and
outfall management as the principal, or only, interventions. Due to the high costs of
these measures coupled with the fact that local authorities are generally not the sew-
erage undertaker, local authorities may be relatively powerless, and few options may
be available for effective local interventions in securing water user safety from faecal
pollution. The limited evidence available from cost–benefit studies of point source
pollution control suggests that direct health benefits alone may often not justify the
proposed investments which may also be ineffective in securing regulatory compli-
ance, particularly if non-human, diffuse faecal sources and/or stormwaters are major
contributor(s) (Kay et al., 1999). Furthermore, the costs may be prohibitive or may
divert resources from greater public health priorities, such as securing access to a safe
drinking-water supply, especially in developing regions. Lastly, considerable concern
has been expressed regarding the burden (cost) of monitoring, primarily but not
exclusively to developing regions, especially in light of the precision with which the
monitoring effort assesses the risk to the health of water users and effectively sup-
ports decision-making to protect public health.
These limitations may largely be overcome by a monitoring scheme that combines
microbial testing with broader data collection concerning sources and transmission
of pollution. There are two outcomes from such an approach—one is a recreational
water environment classification based on long-term analysis of data, and the other
is immediate actions to reduce exposure, which may work from hour to hour or from
day to day.
4.3.1 Harmonized approach and the “Annapolis Protocol”
A WHO expert consultation in 1999 formulated a harmonized approach to assess-
ment of risk and risk management for microbial hazards across drinking, recreational
and reused waters. Priorities can therefore be addressed across all water types or within
a type, when using the risk assessment/risk management scheme illustrated in Figure
4.3 (Bartram et al., 2001).
The “Annapolis Protocol” (WHO, 1999; Bartram & Rees, 2000—chapter 9) rep-
resents an adaptation of the “harmonized approach” to recreational water and was
developed in response to concerns regarding the adequacy and effectiveness of
approaches to monitoring and management of faecally polluted recreational waters.
The most important developments recommended in the Annapolis Protocol were:
• the move away from the reliance on numerical values of faecal index bacteria
as the sole compliance criterion to the use of a two component qualitative
ranking of faecal loading in recreational water environments, supported by
direct measurement of appropriate faecal indices; and
58 GUIDELINES FOR SAFE RECREATIONAL WATER ENVIRONMENTS
•provision to account for the impact of actions to discourage water use during
periods, or in areas, of higher risk.
The protocol has been tested in various countries, and recommendations result-
ing from these trials have been included in the Guidelines described here. These
include the classification scheme that results from application of the Annapolis Pro-
tocol to the development of Guidelines for safe Recreational Water Environments, which
is described in sections 4.5 and 4.6.
4.3.2 Risk assessment
Assessing the risk associated with human exposure to faecally polluted recreational
waters can be carried out directly via epidemiological studies or indirectly through
quantitative microbial risk assessment (QMRA). Both methods have advantages and
limitations.
Epidemiological studies have been used to demonstrate a relationship between
faecal pollution (using bacterial index organisms) and adverse health outcomes (see
section 4.2 and Prüss, 1998). Some types of epidemiological studies are also suitable
to quantify excess risk of illness attributable to recreational exposure. The problems
and biases in a range of epidemiological studies of recreational water and the suit-
ability of studies to determine causal or quantitative relationships have been reviewed
by Prüss (1998).
CHAPTER 4. FAECAL POLLUTION AND WATER QUALITY 59
RISK MANAGEMENT
Define key risk points and
audit procedures for overall
system effectiveness
Define analytical verifications
(process, public health)
Define measures and interventions
(requirements, specifications)
based upon objectives
Water quality
objectives
Other
management
objectives
Basic control approaches
Assessment
of risk
HEALTH
TARGETS
PUBLIC
HEALTH
OUTCOMES
Assess
environmental
exposure
New local
outcomes
Tolerable
risk
FIGURE 4.3. HARMONIZED APPROACH TO ASSESSMENT OF RISK AND RISK MANAGEMENT FOR WATER-
RELATED EXPOSURE TO PATHOGENS (ADAPTED FROM BARTRAM ET AL., 2001)
From a review of the literature, one (or more) key epidemiological study may be
identified that provides the most convincing data with which to assess quantitatively
the relation between water quality (index organism) data and adverse health out-
comes. The series of randomized epidemiological investigations, conducted in the
United Kingdom, provide such data for gastroenteritis (Kay et al., 1994), AFRI and
ear ailments associated with marine bathing (Fleisher et al., 1996a). These studies are
described in more detail in section 4.4.1.
QMRA can be used to indirectly estimate the risk to human health by predicting
infection or illness rates given densities of particular pathogens, assumed rates of
ingestion and appropriate dose-response models for the exposed population. Appli-
cation of QMRA to recreational water use is constrained by the current lack of
specific water quality data for many pathogens and the fact that pathogen numbers,
as opposed to faecal index organisms, vary according to the prevalence of specific
pathogens in the contributing population and may exhibit seasonal trends.
These factors suggest a general screening-level risk assessment (SLRA) as the first
step to identify where further data collection and quantitative assessment may be
most useful. However, caution is required in interpretation because the risk of infec-
tion or illness from exposure to pathogenic microorganisms is fundamentally differ-
ent from the risk associated with other contaminants, such as toxic chemicals. Several
of the key differences between exposure to pathogens and toxic chemicals are:
• exposure to chemical agents occurs via an environment-to-person pathway.
Exposure to pathogens can occur via an environment-to-person pathway, but
can also occur due to person-to-person contact (secondary spread);
• whether a person becomes infected or ill after exposure to a pathogen may
depend on the person’s pre-existing immunity. This condition implies that
exposure events are not independent;
• infectious individuals may be symptomatic or asymptomatic;
• different strains of the same pathogen have a variable ability to cause disease
(differing virulence);
• this virulence can evolve and change as the pathogen passes through various
infected individuals; and
• pathogens are generally not evenly suspended in water.
Although the differences between exposure to chemical agents and pathogenic
microorganisms are widely acknowledged, the conceptual framework for chemical
risk assessment (Table 4.4) has been commonly employed for assessing the risk asso-
ciated with exposure to pathogenic microorganisms. Frameworks have been devel-
oped specifically to assess the risks of human infection associated with exposure to
pathogenic microorganisms and to account for some of the perceived shortcomings
of the chemical risk framework with respect to properties unique to infectious
microorganisms. However, to date, these frameworks have not been widely
adopted.
In employing the chemical risk framework to carry out a SLRA, a representative
pathogen is used to conservatively characterize its microbial group. For example, the
60 GUIDELINES FOR SAFE RECREATIONAL WATER ENVIRONMENTS
occurrence of adenovirus, with its associated dose–response curve, may be used as a
predictor for enteric viruses. Conservative estimates of exposure to each pathogen
group (viruses, bacteria, parasitic protozoa and helminths) may be used to charac-
terize “total” risks from each of the groups of pathogens. The results of the SLRA
should then indicate an order of magnitude estimate of risk, whether or not further
data are required and if risks are likely to be dominated by a single class of pathogen
or source (potentially defining options for risk management). It should be empha-
sized that this SLRA approach presumes that little net error is made by not account-
ing for either person-to-person transmission of disease or immunity.
CHAPTER 4. FAECAL POLLUTION AND WATER QUALITY 61
TABLE 4.4. RISK ASSESSMENT PARADIGM FOR ANY HUMAN HEALTH EFFECT
a
Step Aim
1. Hazard identification To describe acute and chronic human health effects (toxicity, carcinogenicity,
mutagenicity, developmental toxicity, reproductive toxicity and neurotoxicity)
associated with any particular hazard, including pathogens.
2. Exposure assessment To determine the size and nature of the population exposed and the route,
amount and duration of the exposure.
3. Dose–response To characterize the relationship between various doses administered and the
assessment incidence of the health effect.
4. Risk characterization To integrate the information from exposure, dose–response and hazard
identification steps in order to estimate the magnitude of the
public health problem and to evaluate variability and uncertainty.
a
Adapted from NRC, 1983.
Given the somewhat limited array of microorganisms for which a dose–response
relationship has been estimated, SLRAs are currently limited to a few microorgan-
isms, such as rotavirus, adenovirus, Cryptosporidium parvum, Giardia lamblia and
Salmonella spp. (Haas et al., 1999). A screening-level QMRA approach is outlined
for a recreational water example in Box 4.2 (adapted from Ashbolt et al., 1997).
A more comprehensive alternative to the SLRA approach is to employ a popula-
tion based disease transmission model to assess the risks of human disease associated
with exposure to pathogenic microorganisms. In this population-based approach,
the potential for person-to-person transmission and immunity are accounted for
(Eisenberg et al., 1996; Soller, 2002), however, the models require substantially
more epidemiological and clinical data than SLRA models. Application of the
disease transmission modelling approach may, therefore, be more limited than the
SLRA approach.
The primary advantages of QMRA studies are that the potential advantages and
limitations of risk management options may be explored via numerical simulation to
examine their potential efficacy, and that risk below epidemiologically detectable
levels may be estimated under certain circumstances. The limitations of QMRA
studies, as noted earlier, are that limited data are available to carry out these assess-
ments and, in many cases, the data that are available are highly uncertain and vari-
able. Nevertheless, it may be inferred from several of the available QMRA studies
(Sydney and Honolulu) (Mamala Bay Study Commission, 1996; Ashbolt et al., 1997)
that they provide supporting evidence for the results of various epidemiological
studies.
BOX 4.2 SCREENING-LEVEL QMRA APPROACH FOR BATHER RISK (ADAPTED FROM ASHBOLT ET AL., 1997)
F
or a predominantly sewage-impacted recreational water, the concentration of pathogens in waters may
be estimated from the mean pathogen densities in sewage and their dilution in recreational waters
(based on the numbers of index organisms; see Table 4.5 below). As an initial conservative approximation
of pathogen numbers in recreational waters, enterococci may be used as an index for the dilution of
sewage-associated bacterial pathogens (e.g., Shigella) and spores of Clostridium perfringens or entero-
cocci for the enteric viruses and parasitic protozoa. Alternatively, direct presence/absence measurement of
pathogens in large volumes of recreational waters may be attempted (Reynolds et al., 1998). Next, a volume
of recreational water ingestion is required to determine the pathogen dose, in this instance 20–50 ml of
water per hour of swimming has been assured.
62 GUIDELINES FOR SAFE RECREATIONAL WATER ENVIRONMENTS
TABLE 4.5. GEOMETRIC MEAN INDEX ORGANISMS AND VARIOUS PATHOGENS IN PRIMARY SEWAGE
EFFLUENT IN SYDNEY, AUSTRALIA
a
Clostridium
Thermotolerant perfringens
coliforms spores Cryptosporidium Giardia Rotavirus
(cfu/100 ml) (cfu/100 ml) (oocysts/litre) (cysts/litre) (pfu/litre)
b
1.33 ¥ 10
7
7.53 ¥ 10
4
24 14 000 470
a
Index bacteria and parasite data are from Long & Ashbolt (1994).
b
Total enteric virus estimate of 5650 for raw sewage is from Haas (1983). Long & Ashbolt (1994) quoted a 17% reduction
for adenoviruses, enteroviruses and reoviruses by primary treatment (discharge quality), and rotavirus was assumed to be
10% of total virus estimate.
After the general concentrations of pathogens from the three microbial groups have been determined,
selected representatives are used for which dose–response data are available (e.g., Shigella, Cryp-
tosporidium, Giardia, rotavirus and adenoviruses). Note that these specific pathogens may not necessar-
ily be the major etiological agents, but are used as health protective representatives characteristic of the
likely pathogens. Risks from viral, bacterial and protozoan pathogens can then be characterized per expo-
sure by applying published dose–response models for infection and illness (Haas et al., 1999). Employing
the framework described above for chemical agents, risks experienced on different days are assumed to
be statistically independent, and the daily risks are assumed to be equal. According to Haas et al. (1993),
the annual risk can be calculated from a daily risk as follows:
where:
•
P
ANNUAL
is the annual risk of a particular consequence;
•
P
DAILY
is the daily risk of the same consequence; and
•
N is the number of days on which exposure to the hazard occurs within a year.
PP
ANNUAL DAILY
N
=- -
(
)
11
Thus, QMRA can be a useful tool for screening the risk to public health at recre-
ational water sites and for determining the potential efficacy of management alter-
natives through the integration of a wide array of disparate data. Finally, QMRA
provides credible scientific analysis that can be used in conjunction with or, at times,
in lieu of epidemiological investigations to assess risk to human health at recreational
water sites.
4.3.3 Risk management
To meet health targets ultimately based on a tolerable risk of illness (see section
4.4), achievable objectives need to be established for water quality and associated
management. Hazard analysis and critical control point (HACCP) provides an
example of a possible approach. It is a risk management tool that promotes
good operational/management practice and is an effective quality assurance (QA)
system that is used in the food and beverage industry (Deere et al., 2001). It has
become the benchmark means to ensure food and beverage safety since its
codification in 1993 by the Food and Agriculture Organization of the United
Nations and WHO Codex Alimentarius Commission. Water Safety Plans (WSP)
for drinking-water have been developed from the HACCP approach (WHO,
2003).
For recreational waters, the HACCP approach has been interpreted as described
in Table 4.6. This risk management procedure should be approached in an iterative
manner, with increasing detail proportional to the scale of the problem and resources
available. By design, HACCP addresses principally the needs for information
for immediate management action; when applied to recreational water use
areas, however, its information outputs are also suitable for use in longer-term
classification.
Variation in water quality may occur in response to events (such as rainfall) with
predictable outcomes, or the deterioration may be constrained to certain areas or sub-
areas of a single recreational water environment. It may be possible to effectively dis-
courage use of areas that are of poor quality or discourage use at times of increased
risk. Since measures to predict times and areas of elevated risk and to discourage
water contact during these periods may be inexpensive (especially where large point
sources are concerned), greater cost effectiveness and improved possibilities for effec-
tive local management intervention are possible.
4.4 Guideline values
In many fields of environmental health, guideline values are set at a level of exposure
at which no adverse health effects are expected to occur. This is the case for some
chemicals in drinking-water, such as DDT (p,p¢-dichlorodiphenyl trichloroethane)
and copper.
For other chemicals in drinking-water, such as genotoxic carcinogens, there is no
“safe” level of exposure. In these cases, guidelines (including WHO guideline values;
WHO, 1996) are generally set at the concentration estimated to be associated with
a certain (low) excess burden of disease. A frequent point of reference is a 1 in
CHAPTER 4. FAECAL POLLUTION AND WATER QUALITY 63
64 GUIDELINES FOR SAFE RECREATIONAL WATER ENVIRONMENTS
TABLE 4.6. IMPLEMENTATION OF HACCP APPROACH FOR RECREATIONAL WATER MANAGEMENT
Initial steps Implementation
Assemble
•
The team is formed to steer the overall process. Composition of the team should be
HACCP team such as to represent all stakeholders and cover all fields of expertise as much as
possible. Representatives of health agencies, user groups, tourism industry, water and
sewage industry, communities, competent authorities, potential polluters, experts in
hazard and risk analysis, etc., should all therefore be considered.
Collate historical
•
Summarize previous data from sanitary surveys, compliance testing, utility maps of
information sewerage, water and stormwater pipes and overflows.
•
Determine major animal faecal sources for each recreational water catchment.
•
Reference development applications and appropriate legal requirements.
•
If no (historical) data are available, collect basic data to fill data gap/deficiency.
Produce and
•
Produce and verify flow charts for faecal pollution from source(s) to recreational
verify flow charts exposure area(s) for each recreational water catchment. This may require a new
sanitary survey.
•
The series of flow charts should illustrate what happens to water between catchment
and exposure in sufficient detail for potential entry points of different sources of faecal
contaminants to be pinpointed and any detected contamination to be traced.
Core principles
Hazard analysis
•
Identify human versus different types of animal faecal pollution sources and potential
points of entry into recreational waters.
•
Determine significance of possible exposure risks (based on judgement, quantitative
and qualitative risk assessment, as appropriate).
•
Identify preventive measures (control points) for all significant risks.
Critical control
•
Identify those points or locations at which management actions can be applied to
points reduce the presence of, or exposure to, hazards to acceptable levels. Examples include
municipal sewage discharge points, treatment works operation, combined sewer
overflows, illegal connections to combined sewers, etc.
Critical limits
•
Determine measurable control parameters and their critical limits. Ideally, assign
target and action limits to pick up trends towards critical limits (e.g., >10–20 mm
rainfall in previous 24-h period or notification of sewer overflow by local agency).
Monitoring
•
Establish a monitoring regime to give early warning of exceedances beyond critical
limits. Those responsible for the monitoring should be closely involved in developing
monitoring and response procedures. Note that monitoring is not limited to water
sampling and analysis, but could also include, for example, visual inspection of
potential sources of contamination in catchment or flow/overflow gauges.
Management
•
Prepare and test actions to reduce or prevent exposure in the event of critical limits
actions being exceeded. Examples include building an appropriate treatment and/or disposal
system, training personnel, developing an early warning system, issuing a media
release and (ultimately) closing the area for recreational use.
Validation/
•
Obtain objective evidence that the envisaged management actions will ensure that the
verification desired water quality will be obtained or that human recreational exposures will be
avoided. This would draw from the literature and in-house validation exercises.
•
Obtain objective data from auditing management actions that the desired water
quality or change in human exposure is in fact obtained and that the good operational
practices, monitoring and management actions are being complied with at all times.
Record keeping
•
Ensure that monitoring records are retained in a format that permits external audit
and compilation of annual statistics. These should be designed in close liaison with
those using the documents and records.
100000 excess incidence of cancer over a lifetime of exposure. Such levels may be
termed tolerable risk levels.
Guideline values and standards for microbial water quality were originally
developed to prevent the occurrence of outbreaks of disease. However, there was
limited information available concerning the degree of health protection they
provided. In the case of recreational waters, the quantitative epidemiological
studies published in recent years enable the estimation of the degree of health
protection (or, conversely, burden of disease) associated with any given range of water
quality. Further information on this is available in section 4.4.1, which illustrates the
association of gastrointestinal illness and respiratory illness with microbial water
quality.
In setting guidelines for recreational water quality, it would be logical to ensure
that the overall levels of health protection were comparable to those for other water
uses. This would require comparison of very different adverse health outcomes, such
as cancer, diarrhoea, etc. Significant experience has now been gained in such
comparisons, especially using the metric of disability-adjusted life years (DALYs).
1
When this is done for recreational waters, it becomes clear that typical standards for
recreational water would lead to “compliant” recreational waters associated with a
health risk very significantly greater than that considered acceptable, or tolerable, in
other circumstances (such as carcinogens in drinking-water). However, setting recre-
ational water quality standards at water qualities that would provide for levels of
health protection similar to those accepted elsewhere would lead to standards that
would be so strict as to be impossible to implement in many parts of the developing
and developed world and would detract from the beneficial effects of recreational
water use.
The approach adopted here therefore recommends that a range of water quality
categories be defined and individual locations be classified according to these (see
sections 4.4.3 and 4.6). The use of multiple categories provides incentive for pro-
gressive improvement throughout the range of qualities in which health effects are
believed to occur.
4.4.1 Selection of key studies
Numerous studies have shown a causal relationship between gastrointestinal symp-
toms and recreational water quality as measured by index bacteria numbers (Prüss,
1998). Furthermore, a strong and consistent association has been reported with tem-
poral and dose–response relationships, and the studies have biological plausibility and
analogy to clinical cases from drinking contaminated water, although various biases
can occur with all epidemiological studies (Prüss, 1998).
CHAPTER 4. FAECAL POLLUTION AND WATER QUALITY 65
1
A DALY expresses years of life lost to premature death (i.e., a death that occurs before the age to which
the dying person could have been expected to survive if s/he were a member of a standardized model
population with a life expectancy at birth equal to that of the world’s longest-living population—Japan)
and years lived with a disability of specific severity and duration. Thus, one DALY is one lost year of
healthy life.
In 19 of the 22 studies examined in Prüss’s (1998) review, the rate of certain symp-
toms or symptom groups was significantly related to the count of faecal index bac-
teria in recreational water. Hence, there was a consistency across the various studies,
and gastrointestinal symptoms were the most frequent health outcome for which sig-
nificant dose-related associations were reported.
The randomized controlled trials conducted in marine waters in the United
Kingdom (Kay et al., 1994; Fleisher et al., 1996a; Kay et al., 2001) provide the most
convincing data. These studies give the most accurate measure of exposure, water
quality and illness compared with observational studies where an artificially low
threshold and flattened dose–response curve (due to misclassification bias) were likely
to have been determined.
These trials therefore form the key studies for derivation of guideline values for
recreational waters (Box 4.3). However, it should be emphasized that they are pri-
marily indicative for healthy adult populations in sewage impacted marine waters in
temperate climates. Studies that reported higher thresholds and case rate values (for
adult populations or populations of countries with higher endemicities) may suggest
increased immunity, which is a plausible hypothesis but awaits empirical confirma-
tion. Most studies reviewed by Prüss (1998) suggested that symptom rates were
higher in lower age groups, and the UK studies may therefore systematically under-
estimate risks to children.
BOX 4.3 KEY STUDIES FOR GUIDELINE VALUE DERIVATION
T
he randomized trials reported by Kay et al. (1994) and Fleisher et al. (1996a) were designed to over-
come significant “misclassification” (e.g., attributing a daily mean water quality to all bathers) and “self-
selection” (e.g., the exposed bathers may have been more healthy at the outset) biases present in earlier
studies. Both effects would have led to an underestimation of the illness rate.
This was done by recruiting healthy adult volunteers in urban centres during the four weeks before each
of the four studies (i.e., the volunteers may not represent the actual population at a beach as well as did
participants in the earlier prospective studies), conducted from 1998 to 1992 at United Kingdom beaches
that were sewage impacted but passed existing European Union “mandatory” standards. Volunteers
reported for an initial interview and medical examination 1–3 days prior to exposure. They reported to a
beach on the study day and were informed of their randomization status into the “bather” or “non-bather”
group (i.e., avoiding “self-selection” bias). Bathers were taken by a supervisor to a marked section of beach,
where they bathed for a minimum period of ten min and immersed their heads three times during that
period. The water in the recreational area was intensively sampled during the swimming period to give a
spatial and temporal pattern of water quality, which allowed a unique water quality to be ascribed to each
bather derived from a sample collected very close to the time and place of exposure (i.e., minimizing “mis-
classification” bias). Five candidate bacterial faecal indices were measured synchronously at three depths
during this process. Enumeration of indices was completed using triplicate filtration to minimize bias
caused by the imprecision of index organism measurement in marine waters. All volunteers were inter-
viewed on the day of exposure and at one week post-exposure, and they completed a postal questionnaire
66 GUIDELINES FOR SAFE RECREATIONAL WATER ENVIRONMENTS
at three weeks post-exposure. These questionnaires collected data on an extensive range of potential con-
founding factors, which were examined in subsequent analyses. Bathers and all subsequent interviewers
were blind to the measure(s) of exposure used in statistical analysis, i.e., faecal index organism concen-
tration encountered at the time and place of exposure.
Gastroenteritis rates in the bather group were predicted by faecal streptococci (i.e., intestinal enterococci)
measured at chest depth (with gastroenteritis being based on accepted definitions in Europe and North
America such as loose bowel motions, fever and vomiting). This relationship was observed at three of the
four study sites; at the fourth, very low concentrations of this index organism were observed.
Only faecal streptococci, measured at chest depth, showed a dose–response relationship for both gas-
trointestinal illness (Kay et al., 1994) and AFRI (Fleisher et al., 1996a) in marine waters. Bathers had a sta-
tistically significant increase in the occurrence of AFRI at levels at or above 60 faecal streptococci/100 ml.
While a significant dose–response relation with gastroenteritis was identified when faecal streptococci
concentrations exceeded approximately 32/100 ml. No dose–response relationships with other illnesses
were identified.
Faecal index organism concentrations in recreational waters vary greatly. To accommodate this variabil-
ity, the disease burden attributable to recreational water exposure was calculated by combining the
dose–response relationship with a probability density function (PDF) describing the distribution of index
bacteria. This allows the health risk assessment to take account of the mean and variance of the bacterial
distribution encountered by recreational water users.
The maximum level of faecal streptococci measured in these trials was 158 faecal streptococci/100ml (Kay
et al., 1994). The dose–response curve for gastroenteritis derived from these studies, and used in deriving
the guidelines below, is limited to values in the range commencing where a significant effect was first
recorded, 30–40 faecal streptococci/100 ml, to the maximum level detected. The probability of gastroen-
teritis or AFRI at levels higher than these is unknown. In estimating the risk levels for exposures above
158 faecal streptococci/100 ml, it is assumed that the probability of illness remains constant at the same
level as exposure to 158 faecal streptococci/100 ml (i.e., an excess probability of 0.388), rather than con-
tinuing to increase. This assumption is likely to underestimate risk and may need review as studies become
available that clarify the risks attributable to exposures above these levels.
Discussion has arisen concerning the steep dose–response curve reported in these
studies, compared with previous studies. The best explanation of the steeper curve
appears to be that with less misclassification and other biases, a more accurate measure
of the association between index organism numbers and illness rates was made. In
addition, the key studies examined beaches with direct sewage pollution, and it is
possible that other pollution risks may result in a different (lower) risk. A reanalysis
of these data (Kay et al., 2001) using a range of contemporary statistical tools has
confirmed that the relationships originally reported are robust to alternative statisti-
cal approaches. The slopes of the dose–response curves for gastrointestinal illness and
AFRI are also broadly consistent with the dose–response models used in QMRA
(Ashbolt et al., 1997).
CHAPTER 4. FAECAL POLLUTION AND WATER QUALITY 67
4.4.2 The 95th percentile approach
Many agencies have chosen to base criteria for recreational water compliance upon
either percentage compliance levels, typically 95% compliance levels (i.e., 95% of
the sample measurements taken must lie below a specific value in order to meet the
standard), or geometric mean values of water quality data collected in the bathing
zone. Both have significant drawbacks. The geometric mean is statistically a more
stable measure, but this is because the inherent variability in the distribution of
the water quality data is not characterized in the geometric mean. However, it is this
variability that produces the high values at the top end of the statistical distribution
that are of greatest public health concern. The 95% compliance system, on the other
hand, does reflect much of the top-end variability in the distribution of water quality
data and has the merit of being more easily understood. However, it is affected by
greater statistical uncertainty and hence is a less reliable measure of water quality,
thus requiring careful application to regulation. When calculating percentiles it is
important to note that there is no one correct way to do the calculation. It is there-
fore desirable to know what method is being used, as each will give a different result
(see Box 4.4).
4.4.3 Guideline values for coastal waters
The guideline values for microbial water quality given in Table 4.7 are derived from
the key studies described above. The values are expressed in terms of the 95th per-
centile of numbers of intestinal enterococci per 100ml and represent readily under-
stood levels of risk based on the exposure conditions of the key studies. The values
may need to be adapted to take account of different local conditions and are rec-
ommended for use in the recreational water environment classification scheme dis-
cussed in section 4.6.
4.4.4 Guideline values for fresh water
Dufour (1984) discussed the significant differences in swimming-associated gas-
trointestinal illness rates in seawater and freshwater swimmers at a given level of faecal
index organisms. The illness rate in seawater swimmers was about two times greater
than that in freshwater swimmers. A similar higher illness rate in seawater swimmers
is observed if the epidemiological study data of Kay et al. (1994) and Ferley et al.
(1989) are compared, although it should be noted that the research groups used very
different methodologies. At the same intestinal enterococci densities, the swimming-
associated illness rate was about five times higher in seawater bathers (Kay et al.,
1994) than in freshwater swimmers (Ferley et al., 1989). This difference may be due
to the more rapid die-off of index bacteria than pathogens (especially viruses) in
seawater compared with fresh water (Box 4.5). This relationship would result in more
pathogens in seawater than in fresh water when index organism densities are identi-
cal, which would logically lead to a higher swimming-associated gastrointestinal
illness rate in seawater swimmers.
68 GUIDELINES FOR SAFE RECREATIONAL WATER ENVIRONMENTS
BOX 4.4 PERCENTILE CALCULATION
I
ndividual regulatory authorities should decide on the most appropriate percentile calculation approach,
based on data availability, statistical considerations and local resources. Two main approaches can be
used. In the parametric approach it is assumed that the samples have been drawn from a particular dis-
tribution. This is typically the log
10
normal distribution for microbiological data and so one uses the 95
percentile of that distribution, calculated from the mean and standard deviation of the logarithms of the
data. The nonparametric approach does not assume any particular distribution and uses data ranking.
The parametric approach is outlined in Bartram & Rees (2000). This approach requires sufficient data to
define the mean and standard deviations of the log
10
bacterial enumerations. It also assumes that the dilu-
tion policy applied by the microbiology laboratories has been applied so as to not produce data items
reported as, for example, <100 per 100ml. For data sets with sufficient entries and appropriate dilution
policy, the 95 percentile point of the probability density function (PDF) is defined as follows:
In calculating this statistic for a column of bacterial data acquired from one beach, all enumerations should
be converted to log
10
values and the calculations of mean and standard deviation should be completed on
the log
10
transformed data.
Sample percentiles can also be calculated by a two-step non-parametric procedure. Firstly the data are
ranked into ascending order and then the “rank” of the required percentile calculated using an appropri-
ate formula—each formula giving a different result. The calculated rank is seldom an integer and so in
the second step an interpolation is required between adjacent data using the following formula:
where X
0.95
is the required 95 percentile, X
1
, X
2
, , X
n
are the n data arranged in ascending order and the
subscripts r
frac
and r
int
are the fractional and integer parts of r.
RANKING FORMULAE
Three formulae are in use in the water industry (Ellis 1989), covering the range of estimates that may be
made: Weibull, Hazen and Excel
TM
. Their formulae are: r
Weibull
= 0.95(n + 1), r
Hazen
=
1
/
2
+ 0.95n, and r
Excel
=
1 + 0.95(n - 1). An example calculation using the Weibull formula is presented in Bartram & Rees (2000,
Table 8.3). It needs at least 19 samples to work, and always gives the highest result. The Hazen formula
needs only 10 samples to work, while the Excel
TM
formula needs only one sample and always gives the
lowest result.
EXAMPLE CALCULATION
Say that we have 100 data of which the six highest are: 200, 320, 357, 389, 410, 440. Then we have
r
Hazen
= 95.5 and so the 95 percentile estimated by the Hazen formula is X
0.95
= (0.5 ¥ 200) + (0.5 ¥ 320) = 260.
Note that using the Weibull formula we have r
Weibull
= 95.95 and so the 95 percentile estimated by the
Weibull formula is X
0.95
= (0.05 ¥ 200) + (0.95 ¥ 320) = 314, while for the method used in Excel
TM
we have
r
Excel
= 95.05 and so the 95 percentile estimated by the Excel formula is X
0.95
= (0.95 ¥ 200) + (0.05 ¥ 320)
= 206—much lower than the Weibull result.
XrXrX
rr095 1
10
.
int int
=-
(
)
+
+frac frac
Log
10
95%ile Arithmetic mean log bacterial concentration 1.6449 standard deviation of log
bacterial concentration
10 10
=+¥
(
)
CHAPTER 4. FAECAL POLLUTION AND WATER QUALITY 69
70 GUIDELINES FOR SAFE RECREATIONAL WATER ENVIRONMENTS
TABLE 4.7. GUIDELINE VALUES FOR MICROBIAL QUALITY OF RECREATIONAL WATERS
95th percentile
value of intestinal
enterococci/100 ml
(rounded values) Basis of derivation Estimated risk per exposure
£40 This range is below the <1% GI illness risk
A NOAEL in most <0.3% AFRI risk
epidemiological studies.
The upper 95th percentile value of 40/100 ml relates to an
average probability of less than one case of gastroenteritis
in every 100 exposures. The AFRI burden would be
negligible.
41–200 The 200/100ml value is 1–5% GI illness risk
B above the threshold of 0.3–1.9% AFRI risk
illness transmission
reported in most The upper 95th percentile value of 200/100ml relates to an
epidemiological studies average probability of one case of gastroenteritis in 20
that have attempted to exposures. The AFRI illness rate at this upper value would
define a NOAEL or be less than 19 per 1000 exposures, or less than
LOAEL for GI illness approximately 1 in 50 exposures.
and AFRI.
201–500 This range represents a 5–10% GI illness risk
C substantial elevation in 1.9–3.9% AFRI risk
the probability of all
adverse health This range of 95th percentiles represents a probability of 1
outcomes for which in 10 to 1 in 20 of gastroenteritis for a single exposure.
dose–response data are Exposures in this category also suggest a risk of AFRI in
available. the range of 19–39 per 1000 exposures, or a range of
approximately 1 in 50 to 1 in 25 exposures.
>500 Above this level, there >10% GI illness risk
D may be a significant >3.9% AFRI risk
risk of high levels of
minor illness There is a greater than 10% chance of gastroenteritis per
transmission. single exposure. The AFRI illness rate at the 95th percentile
point of >500/100 ml would be greater than 39 per 1000
exposures, or greater than approximately 1 in 25 exposures.
Notes:
1. Abbreviations used: A–D are the corresponding microbial water quality assessment categories (see section 4.6) used as
part of the classification procedure (Table 4.12); AFRI = acute febrile respiratory illness; GI = gastrointestinal; LOAEL =
lowest-observed-adverse-effect level; NOAEL = no-observed-adverse-effect level.
2. The “exposure” in the key studies was a minimum of 10 min of swimming involving three head immersions. It is
envisaged that this is equivalent to many immersion activities of similar duration, but it may underestimate risk for
longer periods of water contact or for activities involving higher risks of water ingestion (see also note 8).
3. The “estimated risk” refers to the excess risk of illness (relative to a group of non-bathers) among a group of bathers
who have been exposed to faecally contaminated recreational water under conditions similar to those in the key
studies.
4. The functional form used in the dose–response curve assumes no further illness outside the range of the data (i.e., at
concentrations above 158 intestinal enterococci/100 ml; see Box 4.3). Thus, the estimates of illness rate reported above
this value are likely to be underestimates of the actual disease incidence attributable to recreational water exposure.
5. The estimated risks were derived from sewage-impacted marine waters. Different sources of pollution and more or less
aggressive environments may modify the risks.
6. This table is derived from risk to healthy adult bathers exposed to marine waters in temperate north European waters.
CHAPTER 4. FAECAL POLLUTION AND WATER QUALITY 71
TABLE 4.7. Continued
7. This table may not relate to children, the elderly or the immunocompromised, who could have lower immunity and
might require a greater degree of protection. There are presently no adequate data with which to quantify this, and no
correction factors are therefore applied.
8. Epidemiological data on fresh waters or exposures other than swimming (e.g., high-exposure activities such as surfing,
dinghy boat sailing or whitewater canoeing) are currently inadequate to present a parallel analysis for defined risks.
Thus, a single series of microbial values is proposed, for all recreational uses of water, because insufficient evidence
exists at present to do otherwise. However, it is recommended that the length and frequency of exposure encountered
by special interest groups (such as bodysurfers, board riders, windsurfers, sub-aqua divers, canoeists and dinghy
sailors) be taken into account (chapter 1).
9. Where disinfection is used to reduce the density of index organisms in effluents and discharges, the presumed
relationship between intestinal enterococci (as an index of faecal contamination) and pathogen presence may be
altered. This alteration is, at present, poorly understood. In water receiving such effluents and discharges, intestinal
enterococci counts may not provide an accurate estimate of the risk of suffering from gastrointestinal symptoms or
AFRI.
10. Risk attributable to exposure to recreational water is calculated after the method given by Wyer et al. (1999), in which a
log
10
standard deviation of 0.8103 for faecal streptococci was assumed. If the true standard deviation for a beach is less
than 0.8103, then reliance on this approach would tend to overestimate the health risk for people exposed above the
threshold level, and vice versa.
11 . Note that the values presented in this table do not take account of health outcomes other than gastroenteritis and AFRI.
Where other outcomes are of public health concern, then the risks should also be assessed and appropriate action
taken.
12. Guideline values should be applied to water used recreationally and at the times of recreational use. This implies care
in the design of monitoring programmes to ensure that representative samples are obtained.
BOX 4.5 DIFFERENTIAL DIE-OFF OF INDEX BACTERIA AND PATHOGENS IN SEAWATER AND FRESH WATER
S
alinity appears to accelerate the inactivation of sunlight-damaged coliforms in marine environments,
such that coliforms are appreciably less persistent than intestinal enterococci in seawater. Cioglia &
Loddo (1962) showed that poliovirus, echovirus and coxsackie virus were inactivated at approximately the
same rate in marine and fresh waters (Table 4.8), but it is important to note that other factors, such as
water temperature, are more important than salinity for virus inactivation (Gantzer et al., 1998).
TABLE 4.8. SURVIVAL OF ENTEROVIRUSES IN SEAWATER AND RIVER WATER
a
Die-off rates (in days)
b
Virus strain Seawater River water
Polio I 8 15
Polio II 8 8
Polio III 8 8
Echo 6 15 8
Coxsackie 2 2
a
Adapted from Cioglia & Loddo (1962).
b
Maximum number of days required to reduce the virus population by 3 logs (temperature and sunlight
effects not provided, but critical; Gantzer et al., 1998).
It appears likely that bacterial index organisms have different die-off characteristics in marine and fresh
waters, while human viruses are inactivated at similar rates in these environments.
72 GUIDELINES FOR SAFE RECREATIONAL WATER ENVIRONMENTS
Thus, application of the guideline values derived above for seawaters (Table 4.7)
to fresh waters would be likely to result in a lower illness rate in freshwater users,
providing a conservative (i.e., more protective) guideline in the absence of suitable
epidemiological data for fresh waters.
Furthermore, in estuaries salinity is highly variable and it would be difficult to
decide when or whether a freshwater or marine standard should be applied to a given
compliance location, were separate marine and freshwater guideline values to be
specified.
Studies using a randomized trial design have been conducted in Germany at
freshwater sites. These have yet to be reported in the peer-reviewed literature.
Initial reports (Wiedenmann et al., 2002) suggest that these studies have
identified similar thresholds of effect to those reported in Kay et al. (1994). Until
the full results of these investigations become available, there is inadequate
evidence with which to directly derive a water quality guideline value for fresh
water.
The guideline value derived for coastal waters can be applied to fresh water until
review of more specific data has been undertaken.
4.4.5 Adaptation of guideline values to national/local circumstances
There is no universally applicable risk management formula. “Acceptable” or “toler-
able” excess disease rates are especially controversial because of the voluntary nature
of recreational water exposure and the generally self-limiting nature of the most
studied health outcomes (gastroenteritis, respiratory illness). Therefore, assessment of
recreational water quality should be interpreted or modified in light of regional
and/or local factors. Such factors include the nature and seriousness of local endemic
illness, population behaviour, exposure patterns, and sociocultural, economic, envi-
ronmental and technical aspects, as well as competing health risk from other diseases
including those that are not associated with recreational water. From a strictly health
perspective, many of the factors that might be taken into account in such an adap-
tation would often lead to the derivation of stricter standards than those presented
in Table 4.7. What signifies an acceptable or tolerable risk is not only a regional or
local issue, however, as even within a region or locality children, the elderly and
people from lower socioeconomic areas would be expected to be more at risk (Cabelli
et al., 1979; Prüss, 1998).
The guideline values given in Table 4.7 were derived from studies involving
healthy adult bathers swimming in sewage impacted marine waters in a temperate
climate. Thus, the Guidelines do not relate specifically to children, the elderly or
immunocompromised, who may have lower immunity and might require a greater
degree of protection. If these are significant water user groups in an area, local author-
ities may want to adapt the Guidelines accordingly.
In areas with higher carriage rates or prevalence of diseases potentially transmit-
ted through recreational water contact, risks are likely to be greater (in response to
greater numbers of, or different, pathogens), and stricter standards may be judged
appropriate by local authorities.
If a region is an international tourist area, other factors that need to be taken into
consideration in applying the guideline values include the susceptibility of visiting
populations to locally endemic disease, such as hepatitis A, as well as the risk of intro-
duction of unfamiliar pathogens by visitors to the resident population.
The guideline values were derived from studies in which the “exposure” was a
minimum of tenminutes of swimming involving three head immersions. They may
therefore underestimate risk for activities involving higher risks of water ingestion or
longer periods of water contact. Recreational water uses involving lesser degrees of
water contact (such as windsurfing and sea canoeing) will usually result in less water
ingestion and thus may require less stringent guideline values to achieve equivalent
health protection.
When information on “typical” swimmers (e.g., age, number of swimming events
per swimming season per swimmer, average amount of water swallowed per swim-
ming event) is known, local authorities can adapt the guideline values to their own
circumstances, expressing the health risk in terms of the rate of illness affecting a
“typical” swimmer over a fixed period of time.
Use of a range of categories, rather than a simple pass/fail approach, supports the
principle of informed personal choice. It also allows achievable improvement targets
to be set for high-risk areas, rather than an “across the board” target which may result
in less overall health gain.
Pathogens and faecal index organisms are inactivated at different rates, dependent
on physicochemical conditions. Therefore, any one index organism is, at best, only
an approximate index of pathogen removal efficacy in water (Davies-Colley et al.,
2000; Sinton et al., 2002; Box 4.5). This suggests that factors influencing faecal index
organism die-off should be taken into consideration when applying the guideline
values in Table 4.7, depending on local circumstances. This is particularly true where
sewage is disinfected prior to release, as this will markedly affect the pathogen/index
organism relationship.
Objective input for the adaptation of guidelines to standards may be informed by
quantitative microbial risk assessment (QMRA), as outlined in section 4.3.2. Thus,
a screening-level QMRA is recommended where differential persistence of faecal
index organisms and pathogens compared with the United Kingdom studies may
occur. Examples of such circumstances include higher water temperatures, higher
sunlight (UV) intensity and possibly different rates of microbial predation, along with
different endemic disease(s) or where there is further treatment of sewage effluent
(such as disinfection) prior to discharge.
Adaptation of guideline values to national or local circumstances may be informed
by reference levels of risk using, for example, disability adjusted life years per person
per year, comparing risks considered tolerable for drinking-water, for example, with
risks from recreational water use. Alternatively, exposure to recreational waters has
been considered tolerable when gastrointestinal illness is equivalent to that in the
CHAPTER 4. FAECAL POLLUTION AND WATER QUALITY 73
background unexposed population. Background rates have been given as, for
example, 0.9–9.7% from a range of marine and freshwater studies (Cabelli et al.,
1982; Kay et al., 1994; van Asperen et al., 1998). Based on the key studies of coastal
bathers in the United Kingdom, Wyer et al. (1999) provided an example of tolera-
ble risk in terms of faecal index bacteria (faecal streptococci) equivalent to “back-
ground” or non-water-related gastrointestinal disease. Published or site-specific
dose–response curves of the probability of illness over increasing index organism
exposure can then be used in conjunction with the distribution of faecal index bac-
teria in recreational water to yield prospective microbial water quality criteria or
actual expected disease burden at a particular recreational water location.
The guideline values, defined in Table 4.7, were derived using an average value
for the standard deviation of the PDF for faecal streptococci of 0.8103 (as a log
10
faecal streptococci/100ml value), calculated from a survey of 11000 European recre-
ational waters (Kay et al., 1996). Local variations in the standard deviation would
affect the shape of the PDF (higher standard deviation values would give a broader
spread of values, while smaller standard deviation values would produce a more
narrow spread of values). Thus, the effect of using a fixed standard deviation for all
recreational water environments is variable.
The adaptation of guidelines to form national standards, for example, and the
subsequent regulation of recreational waters is also examined in section 4.7.3 and
chapter 13.
4.4.6 Regulatory parameters of importance
For any microorganism to be used as a regulatory parameter of public health sig-
nificance for recreational waters, it should ideally:
• have a health basis;
• have adequate information available with which to derive guideline values (e.g.,
from epidemiological investigations);
• be sufficiently stable in water samples for meaningful results to be obtained
from analyses;
• have a standard method for analysis;
• be low cost to test;
• make low demands on staff training; and
•require basic equipment that is readily available.
Microorganisms commonly used in regulation include the following:
• Intestinal enterococci meet all of the above.
• E. coli is intrinsically suitable for fresh waters but not marine water; however,
as discussed in section 4.4.4, there are currently insufficient data with which
to develop guideline values using this parameter in fresh water.
• Total coliforms are inadequate for the above criteria, in particular as they are
not specific to faecal material.
74 GUIDELINES FOR SAFE RECREATIONAL WATER ENVIRONMENTS
• Thermotolerant coliforms, although a better index than total coliforms,
include non-faecally derived organisms (e.g., Klebsiella can derive from pulp
and paper mill effluents). As there are no adequate studies on which to
base guideline values, thermotolerant coliforms are unsuitable as regulatory
parameters.
• Salmonellae have been used for regulatory purposes. Their direct health role
has not been supported by outbreak data. They are unlikely to contribute sig-
nificantly to the transmission of disease via the recreational water route because
of their low infectivity and typically relatively low numbers in sewage, which,
when combined with their rapid inactivation in waters, particularly seawaters,
suggest limited biological plausibility.
• Enteroviruses have been used for regulatory purposes. They are costly to assay
and require specialized methods that include a concentration step for their
analysis, which is imprecise. Although enteroviruses are always present in
sewage and there are standard methods, their numbers are variable and not
related to health outcome (Fleisher et al., 1996a,b). Hence, there are insuffi-
cient data with which to develop guideline values. Their direct health signifi-
cance varies from negligible (e.g., vaccine strains) to very high.
4.5 Assessing faecal contamination of recreational water environments
The two principal components required for assessing faecal contamination of recre-
ational water areas are:
• assessment of evidence for the degree of influence of faecal material (i.e.,
derivation of a sanitary inspection category); and
• counts of suitable faecal index bacteria (a microbial water quality assessment).
These would be done for the purposes of classification only where a recreational
water is used for whole-body contact recreation (i.e., where there is a meaningful risk
of swallowing water). The two components are combined (as outlined in section 4.6
and Figure 4.4) in order to produce an overall classification.
4.5.1 Sanitary inspection category
Sources of faecal pollution have been outlined in section 4.2. The sanitary inspec-
tion should aim to identify all sources of faecal pollution, although human faecal pol-
lution will tend to drive the overall sanitary inspection category for an area.
The three most important sources of human faecal contamination of recreational
water environments for public health purposes are typically sewage, riverine dis-
charges (where the river is a receiving water for sewage discharges and either is used
directly for recreation or discharges near a coastal or lake area used for recreation)
and contamination from bathers (including excreta). Other sources of human faecal
contamination include septic tanks near the shore (leaching directly into groundwa-
ter seeping into the recreational water environment) and shipping and local boating
(including moorings and special events such as regattas).
CHAPTER 4. FAECAL POLLUTION AND WATER QUALITY 75