Tài liệu Air pollution in Boston bars before and after a smoking ban pptx
Bạn đang xem bản rút gọn của tài liệu. Xem và tải ngay bản đầy đủ của tài liệu tại đây (468.96 KB, 15 trang )
BioMed Central
Page 1 of 15
(page number not for citation purposes)
BMC Public Health
Open Access
Research article
Air pollution in Boston bars before and after a smoking ban
James L Repace*
†1,2
, James N Hyde
†1
and Doug Brugge
†1
Address:
1
Department of Public Health and Family Medicine, Tufts University School of Medicine, 136 Harrison Ave.; Boston, MA 02111, USA
and
2
Repace Associates, 101 Felicia Lane, Bowie, MD 20720, USA
Email: James L Repace* - ; James N Hyde - ; Doug Brugge -
* Corresponding author †Equal contributors
Abstract
Background: We quantified the air quality benefits of a smoke-free workplace law in Boston
Massachusetts, U.S.A., by measuring air pollution from secondhand smoke (SHS) in 7 pubs before
and after the law, comparing actual ventilation practices to engineering society (ASHRAE)
recommendations, and assessing SHS levels using health and comfort indices.
Methods: We performed real-time measurements of respirable particle (RSP) air pollution and
particulate polycyclic aromatic hydrocarbons (PPAH), in 7 pubs and outdoors in a model-based
design yielding air exchange rates for RSP removal. We also assessed ventilation rates from carbon
dioxide concentrations. We compared RSP air pollution to the federal Air Quality Index (AQI) and
the National Ambient Air Quality Standard (NAAQS) to assess health risks, and assessed odor and
irritation levels using published SHS-RSP thresholds.
Results: Pre-smoking-ban RSP levels in 6 pubs (one pub with a non-SHS air quality problem was
excluded) averaged 179 μg/m
3
, 23 times higher than post-ban levels, which averaged 7.7 μg/m
3
,
exceeding the NAAQS for fine particle pollution (PM
2.5
) by nearly 4-fold. Pre-smoking ban levels of
fine particle air pollution in all 7 of the pubs were in the Unhealthy to Hazardous range of the AQI.
In the same 6 pubs, pre-ban indoor carcinogenic PPAH averaged 61.7 ng/m
3
, nearly 10 times higher
than post-ban levels of 6.32 ng/m
3
. Post-ban particulate air pollution levels were in the Good AQI
range, except for 1 venue with a defective gas-fired deep-fat fryer, while post-ban carcinogen levels
in all 7 pubs were lower than outdoors.
Conclusion: During smoking, although pub ventilation rates per occupant were within ASHRAE
design parameters for the control of carbon dioxide levels for the number of occupants present,
they failed to control SHS carcinogens or RSP. Nonsmokers' SHS odor and irritation sensory
thresholds were massively exceeded. Post-ban air pollution measurements showed 90% to 95%
reductions in PPAH and RSP respectively, differing little from outdoor concentrations. Ventilation
failed to control SHS, leading to increased risk of the diseases of air pollution for nonsmoking
workers and patrons. Boston's smoking ban eliminated this risk.
Background
Secondhand smoke (SHS) has been condemned as a
health hazard by all U.S. environmental health, occupa-
tional health, and public health authorities [1-7]. This
hazard is due to the emission of toxins and carcinogens
into indoor air from burning cigarettes, pipes, and cigars,
Published: 27 October 2006
BMC Public Health 2006, 6:266 doi:10.1186/1471-2458-6-266
Received: 28 April 2006
Accepted: 27 October 2006
This article is available from: />© 2006 Repace et al; licensee BioMed Central Ltd.
This is an Open Access article distributed under the terms of the Creative Commons Attribution License ( />),
which permits unrestricted use, distribution, and reproduction in any medium, provided the original work is properly cited.
BMC Public Health 2006, 6:266 />Page 2 of 15
(page number not for citation purposes)
as well as exhaled tobacco smoke from smokers. SHS con-
tains about 4000 chemical compounds, including known
carcinogens such as polycyclic aromatic hydrocarbons
(PAH), aromatic amines, volatile- and tobacco-specific
nitrosamines, as well as a variety of other toxic or irritating
compounds, including carbon monoxide, benzene, for-
maldehyde, hydrogen cyanide, ammonia, formic acid,
nicotine, nitrogen oxides, acrolein, and respirable particu-
late matter [8]. SHS contains 5 regulated hazardous air
pollutants, 47 hazardous wastes, and at least 172 chemi-
cal toxins [9]. Despite its known hazards, SHS remains a
common indoor air pollutant, especially in the hospitality
industry, which has had a long history of opposition to
efforts to eliminate SHS exposure in restaurants, bars,
nightclubs, and casinos.
This report presents the results of air quality monitoring
for two SHS marker compounds: respirable particles
(RSP) and particle-bound PAH (PPAH) in 7 hospitality
venues in the City of Boston, Massachusetts, before and
after the city's May 5
th
, 2003 smoking ban. These marker
compounds are also harmful air pollutants. A large body
of epidemiologic literature associates increases in outdoor
air fine particle pollution with increases in acute and
chronic mortality, and vice versa. More than 100 studies
published over the past 10 years consistently show statis-
tically significant associations between levels of total and
cardiovascular mortality and combustion-related outdoor
RSP concentrations, and the similarity of pathophysiolog-
ical mechanisms for RSP exposure from SHS and from
outdoor RSP has been noted [10]. Polycyclic aromatic
hydrocarbons (PAH) are carcinogens are found in tobacco
smoke, and polluted environments such as iron and steel
foundries, where such exposures are thought to be the
cause of excess cancers in workers. Benzo [a]pyrene (BaP)
is the best known PPAH. PAH are potent locally acting car-
cinogens in laboratory animals inducing lung and upper
respiratory cancers of the upper respiratory tract and lung
when inhaled, and tumors of the digestive tract when
ingested. IARC has concluded that exposure to SHS is car-
cinogenic to humans [11].
All monitored venues were mechanically-ventilated bars
or bar/restaurants, as described in Table 1. The aims of
this study were: first, to measure the level of markers for
SHS pollution in the hospitality industry of a major Amer-
ican city before and after a smoking ban, so as to assess the
contribution of SHS to the fine particle and carcinogen air
pollution exposure of restaurant and bar staff and
patrons, second, to compare RSP levels to the short-term
Federal Air Quality Index and long-term NAAQS to assess
acute and chronic health risks, and third, to evaluate the
odor and irritation levels from such exposure. Boston
passed a Clean Indoor Air Regulation banning workplace
smoking in 2003. The study design is model-based, in
order to relate observed concentrations to smoker density
and air exchange rates for generalizability and compari-
son to other similar studies [12].
Methods
Air quality monitors
In order to assess indoor and outdoor air quality, two frac-
tions of the particulate phase of secondhand smoke were
chosen for measurement: respirable particles (RSP), con-
sisting of airborne particulate matter in the combustion
size range below 3.5 microns in diameter (PM
3.5
), and
particulate polycyclic aromatic hydrocarbons (PPAH).
RSP was recorded using a pump-driven ThermoMIE per-
Table 1: 7 Downtown Boston bar/restaurants where air quality was measured. Smoking was permitted in the bar areas under the
existing Boston regulations during the April 18, 2003 measurements, and was banned when the October 17, 2003 measurements were
made. The monitors' inlets were ~1 m from the floor for all measurements.
Venue
A
Description
1. Bar/Restaurant A large "horseshoe" bar area dominates one large room. A small room opens out to the front. Bar caters to young singles clientele who gather after
work. Food is also available but not central. Monitoring equipment was placed ~15 ft. from the bar against an outer wall in the bar area for both
measurements.
2. Bar/Restaurant A long rectangular bar dominates this famous bar/restaurant. One large open room. Wide variety of patrons from young singles, older couples and some
tourists. Monitoring equipment was positioned against a wall ~6 ft. from one end of the bar and ~10 ft. from the front door in a virtually identical position
for both measurements.
3. Bar/Restaurant A large complex area dominated by a centrally located bar and stand-up eating area. This bar/restaurant is part of a chain well known for bar and
traditional "pub-style" food. Patrons include both tourists and locals of diverse ages. On both occasions monitoring devices were placed in identical
locations about 8 feet from the bar against a 5 ft. wall in the stand-up area.
4. Bar/Restaurant A noisy and crowded venue. Patrons are almost exclusively 20 to 30 year old singles who gather from late afternoon to late at night. Bar food is available
and served throughout both in the bar area and smaller dining room. Monitors were placed ~20 ft. from the bar against a windowed wall during the first
(April visit), and against the bar for the return (October) visit.
5. Bar/Restaurant A small, crowded, neighborhood bar/restaurant. The narrow bar area is ~15 ft. wide and ~40 ft. long with another ~20 ft. devoted to dining booths
contiguous to the bar. Monitors were placed about 6 feet from the bar's middle against a wall in identical locations for each visit.
6. Bar/Restaurant Grilled and sizzling-hot ethnic food is the main attraction of this bar/restaurant. The bar is contiguous to dining area #1, and ~10 ft. distant and open to
dining area #2. Monitors were placed adjacent to tables in dining area #1 in April, and in dining area #2 in October.
7. Bar/Restaurant Well-known upscale bar/restaurant chain frequented by both locals and tourists. The large rectangular raw shellfish bar area is separated from the main
dining room by corridors but also has large dining tables encircling the bar. Monitors were placed against a wall adjacent to a dining table at ~12 ft. from
the bar, and at adjacent tables for the two visits.
8. Hotel Room 11
th
Floor Nonsmoking Rooms each visit, measurements made with open windows; hotel near Boston Garden Park.
A
(Venue numbers are keyed to Figures 1 and 2.)
BMC Public Health 2006, 6:266 />Page 3 of 15
(page number not for citation purposes)
sonalDataRAM model pDR-1200 real-time aerosol moni-
tor (ThermoAndersen, Inc., Smyrna, GA), and PPAH was
sampled using a pump-driven EcoChem PAS2000CE real-
time particle-bound polycyclic aromatic hydrocarbon
monitor (EcoChem Analytics, Inc., League City, TX). The
pDR1200 was used with a factory calibration of 1.00; the
instrument was HEPA-zeroed and the calibration
rechecked prior to each day's sampling. PM
3.5
and PM
2.5
,
a regulated outdoor air pollutant, are essentially the same
when measuring both the fresh and aged SHS aerosol as
essentially the entire SHS distribution is below 1 μm in
diameter. The PAS2000CE was also used as factory cali-
brated. As described in detail elsewhere [12], our pDR
1200's calibration was previously checked against SHS
and background aerosol in a series of controlled experi-
ments using 7 Marlboro cigarettes and found to be accu-
rate to within experimental error against both a
piezobalance and pump and filter, and simultaneously,
our PAS2000ce was evaluated in the same experiment to
ascertain the PPAH-to-SHS-RSP ratio. Both devices incor-
porate data loggers and can output mass concentration
and time to a computer; both were synchronized and set
for 1-minute averaging times.
Ventilation assessment
In order to assess ventilation, two methods were used: the
first method involved measuring carbon dioxide (CO
2
)
using a Langan T15 Personal Exposure Measurer (Langan
Instruments, San Francisco, CA), which measures concen-
trations in real time. Calibration of these MIE and PAS
instruments is described elsewhere [12]. If the number of
persons in the establishment is counted, the ventilation
rate per occupant can be estimated from the difference
between the indoor and outdoor CO
2
levels by using an
equation given by The American Society of Heating Refrig-
erating, and Air Conditioning Engineers (ASHRAE) in
ASHRAE Standard 62–1999 [13]. This method is based on
carbon dioxide levels in exhaled breath, which will build
up in an indoor environment limited only by the ventila-
tion rate. The ventilation rate per occupant defines the rate
of supply of outdoor air per occupant of the space, and
does not directly measure the rate of pollutant removal.
This commonly-used method is limited in accuracy by
two potential problems: the CO
2
levels may not be in
equilibrium, and it may be difficult to assess the true out-
door background because of emissions of CO
2
from
nearby traffic.
Accordingly a second method was used to assess ventila-
tion, the air exchange rate method, which relies upon the
mass-balance model [14,15]. The air exchange rate is
defined as the rate of replacement of polluted air with
unpolluted air, and is an index of how fast the second-
hand smoke is removed by the air handling system plus
sorption on room surfaces. These are described in more
detail below.
Pre-smoking-ban survey methods
The first monitoring phase was conducted on Friday
evening, April 18, 2003, prior to enactment of the May 5
th
smoke-free law in the city of Boston. The criteria for eligi-
bility in the first phase were the presence of visible smok-
ing, that each establishment be within walking distance of
the previous, and establishments represent a broad variety
of hospitality venues, ranging from a neighborhood bar
serving food to a tourist bar serving raw shellfish. Two
bar/restaurant venues on the list of candidates were
rejected because no-one could be found smoking at entry,
and time was limited by PPAH monitor battery charge.
The venues were selected by one of us (JH) a Boston resi-
dent, who identified the venues to be sampled.
Venues were visited for an average of about 36 minutes
(range, 20 to 59 min). Outdoor and in-transit locations
were sampled before and after each venue, as well as a
nonsmoking hotel room before and after the pub survey.
The miniaturized monitors were concealed in wheeled
luggage, and sampling was discreet in order not to disturb
occupants' normal behavior. All venues were well-patron-
ized during the measurements. The monitoring package
was generally unobtrusively located along a wall, or
beneath a table, ~2 ft from the floor.
Each pub's dimensions were measured using a Calculated
Industries Dimension Master ultrasonic digital ruler
(range 2 ft – 50 ft, resolution ± 1%), by a Bushnell Yardage
Pro Sport Compact infrared laser Rangefinder (range 10
yd to 700 yd, resolution ± 1 yd), or estimated by pacing, if
the venue was too crowded or irregular in shape. The total
number of persons and the number of burning cigarettes
was counted every ten minutes, including the beginning
and end of the sampling period. The clock time upon
entering and leaving each establishment was recorded in
a time-activity pattern diary, so that each venue's concen-
tration could be identified by time recorded in the data.
Post-smoking-ban survey methods
The second monitoring phase was conducted six months
later, on Friday evening, October 17, 2003, after compli-
ance with the law had been amply demonstrated, and the
temperature was sufficiently cool such that the venues
were not open to the outdoor air and the baseline indoor
air quality could be assessed in the absence of smoking.
Eligibility criteria were as in Survey #1, except that in all
venues no smoking was observed. The same 7 hospitality
venues were visited for an average of about 43 minutes
(range, 21 to 71 min), after the smoking ban took effect,
and it was judged that their compliance with the ban was
satisfactory. Continuous measurements of RSP and PPAH,
BMC Public Health 2006, 6:266 />Page 4 of 15
(page number not for citation purposes)
were again made from ~6 PM to 12 AM, in the same order
and at about the same time of night. As in the pre-ban
field study, control measurements were performed out-
doors, in transit, and in a non-smoking room on the same
floor at the same hotel.
SHS odor and irritation
Odor and irritation thresholds have implications for
smoking policy development. Weber and Grandjean [25]
report that nearly three-fourths of nonsmokers were dis-
turbed by smoky air in restaurants, that acute irritation
from SHS is enhanced in warm and dry air, and that con-
trolled studies of healthy nonsmokers show that the par-
ticulate phase of SHS is mostly responsible for the
irritating effects of SHS, while the gas phase is responsible
for most of the annoyance. Weber and Grandjean [25]
also found that irritation, as measured by eye-blink rate,
increased linearly with increasing smoke concentration,
and with increased duration of exposure at a constant con-
centration. The same results were observed, although less
pronounced, for nose and throat irritations. Unlike irrita-
tion, annoyance increases rapidly as exposure begins, then
plateaus with time.
Junker et al. [26], conducted a study of 24 healthy non-
smokers aimed at determining air quality standards
required to protect nonsmokers from adverse health
effects caused by impacts of SHS from smoldering ciga-
rettes on the human sensory system as well as to provide
measures for establishing acceptable indoor air quality.
Junker et al. [26] found that that the threshold for objec-
tively measured sensory irritation was about 4.4 μg/m
3
for
PM
2.25
, and that at this level, 67% of the nonsmoking sub-
jects judged the quality of the air to be unacceptable. In
addition, Junker et al. [26] measured a median odor-
detection threshold of about 1 μg/m
3
SHS-PM
2.25
. These
authors concluded that the results for sensory symptoms
show that even at very low SHS concentrations, subjects
perceived a significant increase in sensory impact (eye,
nasal, and throat irritation), and felt significantly more
annoyed and reported the quality of the air to be less
acceptable than exposure to zero levels of SHS.
The active smoker model
The model-based study design allows the data to be gen-
eralized: in the April 18
th
survey, values for area, volume,
active smoker count, and pollutant concentration were
measured. From these values the smoker density can be
computed, and air exchange rate due to ventilation can be
estimated using a simplified version of the mass-balance
model called the Active Smoker Model (Eq. 1 below) [12].
This equation calculates, in units of micrograms of pollut-
ant per cubic meter of air (μg/m
3
), the level of uniformly-
mixed time-averaged SHS-RSP in a building as a function
of the active smoker density D
s
, in units of burning ciga-
rettes per hundred cubic meters (BC/100 m
3
) and the
building's air exchange rate C
v
, in units of air changes per
hour (h
-1
):
The relationship of the number of burning cigarettes to
the number of smokers present is illustrated as follows:
the 2003 Massachusetts average adult habitual smoking
prevalence is 19.7% (± 1%) [24]. Thus in a group of adult
Bostonians consisting of mixed smokers and nonsmokers
according to the Statewide smoking prevalence, 19.7% of
the entire group would be expected to be habitual smok-
ers. Of those, 1/3, or ~6.6% would be expected to be
observed actively smoking at any one time [12]. Thus in a
2003 field survey of a venue in Boston, the prevalence of
active smoking would be expected to be 6.6% of persons
present if the smoking prevalence is representative of that
in the larger state population. Table 2 shows that the
mean active smoking prevalence actually observed in the
pre-ban survey is about 2/3 of this value, at 4.04% (SD
1.6%) for all 7 venues sampled. This may reflect a lower
smoking prevalence among affluent urban Bostonians
than in the rest of the State.
For a bar with a percentage of smokers equal to the 2003
Massachusetts smoking prevalence rate of 19.7% [33], at
maximum occupancy, the default smoker density is
(0.197 smokers/occ)(100 occ/10,000 ft
3
) = 19.7 smokers
per 10,000 ft
3
, or in metric units, 19.7 smokers per 283
cubic meters (m
3
), of whom 1/3 would be expected to be
actively smoking at any one time yielding an estimated
active smoker density of D
s
= (1/3)(19.7)/2.83 = 2.32
active smokers (i.e., burning cigarettes (BC) per 100 m
3
.
Using Eq. 1, the expected SHS-RSP concentration for a
properly ventilated Boston bar at maximum occupancy is:
SHS-RSP = 650(2.32)/18 = 83 μg/m
3
above background.
Note that if the SHS-RSP concentration and smoker den-
sity are measured, the air exchange rate for SHS-RSP
removal can be calculated. Note that the model implicitly
assumes a default surface decay rate for RSP = 1.33 C
v
[9].
Ventilation rates per occupant from CO
2
CO
2
is a waste product of human metabolism, and will
buildup in the air proportionally to the number of per-
sons in the building environment. Accordingly, ventila-
tion systems are designed with CO
2
control in mind. The
design ventilation engineer's guideline for ventilation
rates in buildings is ASHRAE Standard 62–1999 [13].
Equation 2 is typically used by engineers to estimate the
ventilation adequacy based upon an indoor CO
2
measure-
ment. Eq. 2 is given in Appendix C of ASHRAE Standard
62 [13], and specifies the estimation of C
s
, the equilib-
rium CO
2
levels in parts per million (ppm) in a venue:
RSP
D
C
ETS
s
v
=
()
650 Eq. 1 ,
BMC Public Health 2006, 6:266 />Page 5 of 15
(page number not for citation purposes)
Table 2: April 18, 2003 Boston Indoor/Outdoor Pre-Ban Air Quality Survey Results
Venue Area
(ft
2
)
Ceiling Ht.
(ft)
Volume
(m
3
)
Ave.
b
#
Persons
Present
(SD)
Ave.
b
#
Persons
per 1000
ft
2
Ave.
b
#
Burning
Cigarettes
(SD)
% of Persons
Actively
Smoking
b
Estimated
Smoker
Prevalence
% of all
Persons
Ave.
b
RSP,
μg/m
3
(SD)
Ave.
b
PPAH,
ng/m
3
(SD)
D
s
,
Active
Smoker
Density
a
C
v
, Est.
c
RSP Air
changes
per hour
(h
-1
)
CO ppm
(ave.) (SD)
CO
2
ppm
(Peak)
V
o
L/s-occ
g
Pub #1 1600 13 589 78.3
(11.2)
49 2.33 (0.58) 2.98 8.93 197 (55) 62 (23) 0.40 1.4 1.86 (0.13) 1100 7.9
Pub #2 4550 12.83 1653 131 (34) 29 0.5 (0.58) 1.5 1.15 43 (23) 6.4 (11.5) 0.03 0.75 1.90 (0.14) 680 29.1
Pub #3 5041 11 1570 111 (51.2) 22 3.67 (0.14) 3.3 9.9 57 (49) 38 (21) 0.23 3.74 2.08 (0.06) 800 15.3
Pub #4 1440 10 408 98 (2.7) 68 4.0 (1.73) 4.08 12.2 338 (120) 160 (59) 0.98 1.98 2.47 (0.21) 900 11.7
Pub #5 900 7.5 191 54 (1.4) 60 2.5 (0.71) 4.63 13.9 323 (113) 109 (68) 1.31 2.78 2.77 (0.33) 1480 5.0
Pub #6 2037 9.58 552 40.8
(9.25)
20 2.25 (0.5) 5.51 16.5 308 (80) 41.1 (68) 0.41 0.91 5.50 (1.05) 1150 7.4
Pub #7 1655 9 422 43.5 (2.1) 26 2.75 (0.5) 6.32 19.0 117 (39) 15.3 (9.0) 0.65 4.23 1.89 (0.07) 720 20.2
Mean All 79.5
(35.2)
39 (19.5) 2.57 (1.13) 4.04 (1.6) 11.65 (5.8) 198 (128) 61.7 (54.9) 0.57
(0.44)
2.26 (1.37) 2.63 (1.31) 976
(286)
13.8 (8.5)
Mean all but # 6
d
179 (129) 65.1 (59.3) 2.48 (1.35) 2.16 (0.38) 950
(301)
14.8 (8.8)
Hotel Rm 1 6.45* (1.36) 2.81** (1.59) 0 1.32 (0.045) 625
(19)
Out-doors in transit
f,h
- 18.6 (11.7) 15.8 (11.7) 0 2.14 (0.45) 473
e
* 77 minute average (68 min before and 9 min after all Venue sampling); **73 minute average (65 min before, 8 min after sampling); (SD = standard deviations of measurments in parentheses;
a
(D
s
in units of
burning cigarettes per 100 m
3
);).
c
(Using Habitual Smoker Model of Repace & Lowrey (1985):assumes 2 cigarettes per smoker-hour & 1.43 mg RS)P/cig: ETS-RSP = 650 D
s
/C
v
);
d
(excluding RSP and PPAH
values from Pub #6).
b
(Ave. of 3 measurements~ten minutes apart.) RH%: 25%–64%, mean 43.5% (9). T°C range: 12.7–20.9; mean 17.3 (2.3);
e
(Average minimum background outdoor CO
2
value).
f
(average
of all outdoor measurements);
g
(assumes C
o
= 473 ppm),
h
(On sidewalks; crossing streets).
BMC Public Health 2006, 6:266 />Page 6 of 15
(page number not for citation purposes)
where N is the CO
2
generation rate per person (N = 0.30
L/min, or 5000 ppm-L/s-occupant corresponding to office
work), V
o
is the outdoor air flow rate per occupant in L/s,
and C
o
is the CO
2
concentration (expressed in parts per
million or ppm) in the outdoor air.
The CO
2
levels measured in this survey are given in Table
2, and used to calculate V
o
in the right-most column of
table 2. The ASHRAE Standard recommended value for V
o
is 15 L/s-occ at maximum occupancy, essentially to con-
trol human bioeffluents. CO
2
concentrations in accepta-
ble outdoor air typically range from 300 ppm to 500 ppm,
and maintaining a level of 15 L/s-occ should result in a
steady-state CO
2
concentration of about 350 ppm above
background. Thus expected CO
2
concentrations for a
venue in compliance with ASHRAE Standard 62 should
result in a concentration of the order of 850 ppm or less,
and levels above 1000 ppm are consistent with poor ven-
tilation. Note that the air exchange rate calculated from
the model refers to the removal of SHS by ventilation and
surface decay, while the CO
2
calculation refers to human
bioeffluent removal.
Results
Pre-ban
Weather conditions measured at Logan Airport on the
Harbor on Friday evening April 18, 2003 (6 PM to Mid-
night) were fair and cold, with barometric pressure
between 30.57 and 30.54 inches of mercury. The outdoor
temperature was 5°C (41°F) at 6 PM, decreasing to 4°C
(39°F) by Midnight. Outdoor relative humidity ranged
from 76% to 87% during the same hours [16]. However,
the environmental parameters inside the monitoring
package were measured using the Langan Personal Expo-
sure measurer, which was deployed in the Downtown
Boston area during this survey, were less extreme, with
temperature varying from 12.7°C to 20.9°C, with a mean
17.3°C, and relative humidity ranging from 25% to 64%,
with a mean of 43.5%.
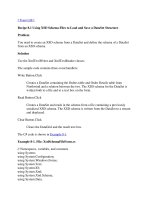
Table 2 organizes the April 18 pre-smoking-ban study
results. The April 18 RSP and PPAH data are plotted in Fig-
ure 1. Figure 1 shows a characteristic pattern of low out-
door RSP and PPAH levels, with indoor RSP and PPAH
levels in all pubs quite elevated with respect to the out-
doors. Pub # 6 has a carbon monoxide (CO) level twice as
high as the other pubs, whose CO levels on average are
comparable to outdoors. Figure 3 shows a plot of the RSP
levels vs. the PPAH levels, excluding Pub #6 [which had
an indoor air quality problem unrelated to smoking as
discussed below]. Figure 3 shows a linear relationship (R
= 0.93) between RSP and PPAH in the pubs suggesting
that the PPAH carcinogens are due to SHS, as found in
controlled experiments which show that SHS-PPAH levels
track the SHS-RSP levels, and that both are elevated dur-
ing smoking and decay toward background levels when
the cigarettes are extinguished [12].
Excluding Pub #6, the indoor levels of RSP average 179
μg/m
3
, ~10 times higher than the outdoor RSP levels,
which averaged 18.6 μg/m
3
, and ~28 times higher than in
the hotel room, where measurements were taken in front
of an open window. Similarly, the PPAH levels, again
excluding Pub #6, average 65.1 ng/m
3
in the pubs, ~4
times higher than the outdoor levels, which averaged 15.8
μg/m
3
, and 23 times higher than the hotel room.
Post-ban
The same venues were sampled on Friday evening Octo-
ber 17, 2003 (6 PM to Midnight) at the same time of night
as in the pre-ban survey. Weather (6 PM to Midnight) was
overcast and mild, with barometric pressure between
30.09 inches of mercury to 30.12 inches of mercury. The
outdoor temperature was 48.2°F (9°C) at 6 PM, increas-
ing to 50.0°F (10°C) by midnight. Relative humidity
ranged from 58% to 62% during the same period [16].
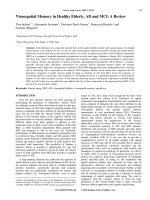
Table 3 organizes the Oct. 17 post-ban study results. Zero
smokers were observed in all pubs post-ban. The Oct. 17
RSP and PPAH data are plotted in Figure 2. Figure 2 shows
a characteristic pattern of low indoor and outdoor RSP
and PPAH levels, except for the anomalous RSP levels in
Pub # 6. Pub # 6 results show that the RSP is more than an
order of magnitude greater than for any other pub, while
the PPAH levels are the lowest of any pub. This indicates
that the smoking created the elevated PPAH levels shown
in Figure 1 for Pub # 6, but that there is another source for
the RSP. As in Table 2, Table 3 shows that Pub # 6 also has
an elevated carbon monoxide (CO) level, 6 times that of
the mean for the other pubs, which again have CO levels
on average comparable to outdoors. Again excluding Pub
#6, the indoor levels of RSP average 7.73 μg/m
3
, ~99% of
the outdoor RSP levels, which averaged 7.82 μg/m
3
, and
only ~4 times higher than in the hotel room. Similarly,
the PPAH levels, again excluding Pub #6, average 5.64 ng/
m
3
in the pubs, ~62% of the outdoor levels, which aver-
aged 9.05 ng/m
3
, and 2.2 times higher than the hotel
room. The hotel room RSP levels were 3 times higher on
April 18 than on Oct. 17, but still relatively low, on both
surveys, and PPAH levels were essentially the same on
both occasions.
Odor and irritation results
In table 5, the SHS-RSP values for the most-polluted
venue, Pub #4 exceed Junkers' irritation threshold by a
factor of (332)/4.4 = 75-fold, and exceed Junkers' odor
C
N
V
C
s
o
o
=+
()
Eq. 2 ,
BMC Public Health 2006, 6:266 />Page 7 of 15
(page number not for citation purposes)
threshold [26] by a factor of 332. For the least SHS-pol-
luted venue, Pub # 3, the irritation and odor ratios are still
13 times and 57 times the threshold levels. For all venues
averaged, these thresholds are exceeded by factors of 39 to
171 respectively. The lack of an adverse economic impact
in the hospitality industry due to Massachusetts' smoke-
free workplace law one year [17] later may be due in part
to the reductions in odor and irritation from SHS, making
these venues more attractive to nonsmokers [29].
Discussion
Smoker density
The observed smoker density ranges from 0.03 BC/100 m
3
to 1.31 BC/100 m
3
, and averages 0.57 BC/100 m
3
, just
25% of the 2.32 BC/100 m
3
expected at maximum occu-
pancy.
Air exchange rates from the model
The default air exchange rate for a typical bar at maximum
occupancy was derived by Repace [12] as C
v
= 18 air
changes per hour (h
-1
). Using Eq. 1, C
v
is calculated for all
7 venues in Table 2, ranging from C
v
= 0.75 to 4.23 h
-1
,
also much lower than expected, indicating these bars are
underventilated.
Ventilation rates from CO
2
Calculated V
o
values in Table 2 range from 5 to 29 L/s-occ,
and average about 14 L/s-occ, close to the 15 L/s-occ spec-
ified by ASHRAE. However, the mean occupancy was 39
occupants per 1000 ft
2
, 39% of maximum occupancy for
a bar, indicating that air quality would be much worse at
busier times. This illustrates even if the ventilation rate for
removal of CO
2
is adequate, the air exchange rate for SHS
Measurements of respirable particle (RSP) and carcinogen pollution (PPAH) as a function of time before the Boston smoking ban on Friday, April 18, 2003 from 6 PM to 12 AM in 7 hospitality venuesFigure 1
Measurements of respirable particle (RSP) and carcinogen pollution (PPAH) as a function of time before the Boston smoking
ban on Friday, April 18, 2003 from 6 PM to 12 AM in 7 hospitality venues. Outdoor levels are indicated between the dotted
lines showing the levels in each pub. Contrast with Figure 2.
0
50
100
150
200
250
300
350
400
450
500
550
600
650
700
0
50
100
150
200
250
300
350
400
450
500
550
600
650
700
RSP Concentration, micrograms per cubic meter (
μ
g/m
3
)
0 30 60 90 120 150 180 210 240 270 300 330 360
0 30 60 90 120 150 180 210 240 270 300 330 360
Elapsed Time, minutes
Boston Good Friday Indoor/Outdoor Air Quality Study: Pre-Smoking Ban 4/18/03
PPAH ng/m
3
RSP
μ
g/m
3
Carcinogen Concentration, PPAH, nanograms per cubic meter (ng/m
3
)
6:00 PM
7:00 PM
8:00 PM 9:00 PM
10 :00 PM
11 :00 PM
12:00 AM
Pub #1
Pub #2
Pub #3
Pub #4
Pub
#5
Pub
#6
Pub #7
SMOKING
BMC Public Health 2006, 6:266 />Page 8 of 15
(page number not for citation purposes)
Table 3: October 17, 2003 Boston Indoor/Outdoor Air Quality Survey Smoke-Free Results Post-Ban
Venue Area
(ft
2
)
Ceiling Ht.
(ft)
Volume
(m
3
)
Ave.
b
Persons
Present
(SD)
Ave.
b
Persons
per 1000 ft
2
Ave.
b
RSP,
μg/m
3
(SD)
% of Pre-
ban RSP
Level
Ave.
b
PPAH,
ng/m
3
(SD)
% of Pre-
ban PPAH
Level
CO ppm
(ave.) (SD)
CO
2
ppm
(peak)
V
0
, L/s-occ
d,f,g
Pub #1 1600 13 589 54.6 (1.15) 34 7.47 (1.46) 3.8 8.56 (4.99) 13.8 1.04 (0.084) 950 10.8
Pub #2 4550 12.83 1653 99.3 (26) 21.8 16.3 (4.75) 38 1.61 (2.14) 25.2 2.89 (0.37) 900 12.1
Pub #3 5041 11 1570 123 (20.6) 24.4 1.39 (1.44) 2.4 5.98 (13.7) 15.7 1.30 (0.24) 800 16.0
Pub #4 1440 10 408 92.7 (22.5) 64.4 6.26 (1.05) 1.9 12.2 (5.13) 7.6 0.82 (0.18) 950 10.8
Pub #5 900 7.5 191 69 (1.73) 76.7 13.5 (3.16) 4.2 7.45 (4.00) 6.8 0.92 (0.09) 940 11.0
Pub #6 2037 9.58 552 50.3 (2.08) 24.7 525 (274) 170 1.55 (3.82) 3.8 7.94 (1.48) 1260 6.5
Pub #7 1655 9 422 48.3 (11.0) 29.0 1.49 (0.96) 1.2 2.14 (1.24) 14.0 0.48 (0.19) 720 21.5
Mean all Venues 76.7 (28.8) 39 (22) 81.6 (196) 41 5.64 (4.09) 9.1 2.20 (2.64) 931 (169) 12.7 (4.78)
Mean all but # 6
a
7.73 (6.13) 4.3 6.32 (4.02) 10.2 1.24 (0.85) 877 (96) 13.7 (4.3)
Non-smoking Hotel Room 1 2.14* (1.16) 33 2.42** (1.54) 86 0.56 (0.037) 573 (44)
Outdoors/In Transit
h
7.82
c
42 9.05
c
57 1.32 487
e
(SD = standard deviations of measurements in parentheses); *(91 min Ave., 68 min before venues, 23 min after); **(85 min Ave., 65 min before venues, 20 min after;
a
(excluding Pub #6).
b
Ave. of 3
measurements~ten min apart;);
c
(Time-weighted mean).
d
(based on ASHRAE 62 formula);
e
(average minimum background);
f
(assumes C
o
= 487 ppm);
g
(assumes C
o
= 487 ppm);
h
(On sidewalks; crossing
streets). Range in air temperature: 17.5 – 21.8°C, mean 19.8°C; range in relative humidity: 28%–48%, mean 38%.
BMC Public Health 2006, 6:266 />Page 9 of 15
(page number not for citation purposes)
removal can be inadequate because V
o
is not coupled to
smoker density. It also illustrates that at full occupancy,
none of the venues would have complied with ASHRAE
Standards, showing that proper ventilation has been
ignored in these venues.
Air pollution from SHS
Figure 3 plots the pre-ban RSP vs. the pre-ban PPAH. A
regression analysis yields a good linear fit (R = 0.93) with
a 2000:1 ratio between RSP and PPAH. This is in good
qualitative agreement with previous research which shows
that during smoking, the cigarette PPAH tracks the RSP,
but has a higher decay rate [12]. Figure 4 plots the back-
ground-subtracted RSP vs. the background-subtracted
PPAH values as a function of burning cigarette density and
SHS-RSP air exchange rate using the habitual smoker
model. The correlation of net RSP and net PPAH with
each other and the increase of PPAH and RSP with active
smoker density suggest a strong association with smoking,
and interestingly, the slope of the regression differs only
by 1% from that observed in the Wilmington Study [12].
By how much are the RSP and PPAH levels reduced by the
smoking ban? From Table 2, excluding Pub # 6, which
had the IAQ problem, the pre-ban pub RSP levels average
179 μg/m
3
. From Table 3, the post-ban pub RSP levels,
again excluding Pub #6, average 7.7 μg/m
3
, a decrease by
96%. Similarly, From Table 2, excluding Pub #6, the pre-
ban pub PPAH levels average 65.1 ng/m
3
. From Table 3,
the post-ban pub PPAH levels, again excluding Pub #6,
Measurements of RSP and PPAH as a function of time after the Boston smoking ban on Friday, October 17, 2003 from 6 PM to 12 AM in the same 7 hospitality venues shown in Figure 1Figure 2
Measurements of RSP and PPAH as a function of time after the Boston smoking ban on Friday, October 17, 2003 from 6 PM to
12 AM in the same 7 hospitality venues shown in Figure 1. Pub #6 had high carbon monoxide levels before and after the ban;
this was reported to Boston Public Health, whose investigation later disclosed this was due to fumes from a malfunctioning gas-
fired deep fat fryer. Outdoor air pollution levels appear between the dotted lines bracketing the indoor levels in each pub.
0
50
100
150
200
250
300
350
400
450
500
550
600
650
700
0
50
100
150
200
250
300
350
400
450
500
550
600
650
700
Respirable Particle Concentration (RSP)
μ
g/m
3
0 30 60 90 120 150 180 210 240 270 300 330 360
0 30 60 90 120 150 180 210 240 270 300 330 360
Elapsed Time, minutes
Boston Air Quality Study Post Smoking Ban, Friday Oct. 17, 2003
PPAH
RSP
Carcinogen Pollution (PPAH) ng/m
3
SMOKE-FREE
6:00
PM
7:00
8:00
9:00 10:00 11 :00
PM
12 :00
AM
Pub
#1
Pub
#2
Pub
#3
Pub
#4
Pub
#5
Pub
#6
Pub
#7
BMC Public Health 2006, 6:266 />Page 10 of 15
(page number not for citation purposes)
average 6.32 ng/m
3
, a decrease by 90%. If the calculations
are referenced to the indoor/outdoor levels on April 18,
the estimated SHS-RSP contribution is [(179-18.6)/179] =
90%, and the estimated SHS-PPAH level contribution is
[(65.1-15.8)/65.1] = 76%. However the latter calculation
may be an underestimate, since the PPAH level in the
pubs on Oct. 17, 6.32 ng/m
3
, was about 70% of the out-
door level; if the PPAH outdoor level on April 18 is
adjusted downward to 70% of its value (0.70)(15.8) = 11
ng/m
3
, and the estimated SHS-PPAH concentration recal-
culated, [(65.1-11)/65.1] = is 83%. Thus, a conservative
inference from the data would be that SHS contributed
about 90% to 95% of the RSP levels during smoking, and
80% to 90% of the PPAH levels during smoking, with an
average smoking prevalence of about 12%. This compares
to a state-wide smoking prevalence of 19.7% in 1999, as
reported above.
But there was one major exception: Pub # 6, which had a
higher RSP level after the smoking ban than before
(although the PPAH level was much lower). Repace et al.
(1980) [14] found that cooking smoke could contribute
significantly to indoor air pollution. Kitchens are sup-
posed to remain under negative pressure to contain cook-
ing fumes [36]. However, Table 2 shows that Pub #6's CO
level on April 18 was [(5.5-2.16)/(0.38)] = 8.8 standard
deviations beyond the mean of the other pubs. Similarly,
Table 3 shows that Pub #6's CO level on Oct. 17 was also
high, at [(7.94-1.24)/(0.85)] = 7.9 standard deviations
beyond the mean of the others. This suggests that Pub # 6
The regression of respirable particle pollution against carcinogen pollution in 6 of 7 Boston pubs studied before the smoking banFigure 3
The regression of respirable particle pollution against carcinogen pollution in 6 of 7 Boston pubs studied before the smoking
ban. Pub # 6 is excluded due to apparent contamination from kitchen fumes. The ratio for RSP/PPAH in the same units is about
2000:1. This is the same RSP/PPAH ratio found in the Wilmingon, Delaware study (Repace, 2004).
0
50
100
150
200
250
300
350
RSP (micrograms per cubic meter)
0 50 100 150 200
PPAH (nanograms per cubic meter)
RSP μg/m
3
= 2.030 PPAH ng/m
3
+ 46.988 r
2
= 0.87
RSP vs. PPAH, 6 Boston Pubs
BMC Public Health 2006, 6:266 />Page 11 of 15
(page number not for citation purposes)
had an indoor air quality problem of another type. The
Boston Public Health Commission (BPHC) was alerted,
and conducted an investigation. The investigation discov-
ered that a gas-fired deep-fat fryer had a yellowish flame
instead of the expected blue, as a result of the burner being
plugged with grease. These yellow flames emitted 50 ppm
of CO into the kitchen, which permeated the rest of the
premises, although the kitchen exhaust hoods were func-
tioning (L. Bethune, Boston Public Health Commission,
Office of Environmental Health, personal communica-
tion).
How do these air quality measurements compare with
other studies? In a preliminary report on a similar model-
based RSP study in 27 Boston hospitality venues with
smoking, but with both pre- and post-ban data taken
using an aerosol monitor, Connolly et al. (2005) [17] in a
Harvard study, reported a mean estimated SHS-RSP of
207 μg/m
3
(SD 202), and a median value of 121 μg/m
3
.
Connolly et al.'s smoker density D
s
varied between 0 and
2.95 BC/100 m
3
, with a mean value of 0.89 (SD 0.73)
compared to 0.57 (SD 0.44) in our study. Our mean pre-
ban estimated SHS-RSP is (198 – 19) = 179 μg/m
3
(Table
2), and a median value of 178 μg/m
3
(not shown), and a
mean estimated SHS-PPAH level of (61.7-15.8) = 46 ng/
m
3
.
In a very similar model-based air quality survey to that
reported here, Repace [12] measured RSP and PPAH in
Wilmington, DE in 8 hospitality venues, a casino, 6 pubs,
and a pool-hall. In the Wilmington study, active smoker
density varied between 0.02 and 1.44 cigarettes per hun-
dred cubic meters and averaged 0.53 (SD 0.54), and SHS
contributed 90% to 95% of the RSP air pollution during
smoking, and 85% to 95% of the carcinogenic PPAH, with
an average smoking prevalence of 15%. Indoor RSP levels
averaged 231 μg/m
3
(SD 207), quite similar to the values
reported by the Massachusetts Study [17]. Ott [38], in a
model-base study, observed reductions of RSP 84% fol-
lowing California's smoking ban, in a 2-year longitudal
study in a tavern in California, and reported that the active
smoking count explained more than 50% of the variation
in the RSP concentrations observed on individual visits
[38].
Table 5: Comparison of Pre-and-Post Ban RSP Levels with the Federal AQI.
1. Venue 2. Pre-Ban Ave. RSP, μg/m
3
3. Potential AQI
Designation
4. Est. SHS-RSP
(RSP
pre-ban
– RSP
post-ban
)
5. Junker Irritation
Ratio
a
6. Junker Odor
Threshold Ratio
b
Pub #1 197 VERY UNHEALTHY 188 43 188
Pub #2 43 UNHEALTHY SENSITIVE
GROUPS
119 27 119
Pub #3 57 UNHEALTHY SENSITIVE
GROUPS
57 13 57
Pub #4 338 HAZARDOUS 332 75 332
Pub #5 323 HAZARDOUS 309 70 309
Pub #6 308 HAZARDOUS
Pub #7 117 UNHEALTHY 116 26 116
Mean All Venues 198 VERY UNHEALTHY
Mean all but # 6 179 VERY UNHEALTHY 171 39 171
Non-smoking Hotel Room 6.45 GOOD NA NA NA
Outdoors/In Transit 18.6 MODERATE NA NA NA
a
(Ratio of SHS-RSP in Col. 4 to Junker Irritation Threshold of 4.4 μg/m
3
).
b
(Ratio of SHS-RSP in Col. 4 to Junker Odor Threshold of 1 μg/m
3
). NA
= not applicable.
Table 4: Levels of fine particulate (PM
2.5
) air pollution in units of micrograms per cubic meter ((μg/m
3
) and corresponding U.S. health
advisory descriptors with accompanying simplified color code (USEPA, 1999).
PM
2.5
(μg/m
3
) AQI Break-
points
Air Quality Index Category Color Code
0.0 – 15.4 0 – 50 Good Green
15.5 – 40.4 51 – 100 Moderate Yellow
40.5 – 65.4 101 – 150 Unhealthy SG* Orange
65.5 – 150.4 151 – 200 Unhealthy Red
150.5 – 250.4 201 – 300 Very unhealthy Violet
250.5 – 350.4 301 – 400 Hazardous Maroon
350.5 – 500.4 401 – 500 Very Hazardous Maroon
> 505 500 (Significant Harm) **
*SG = sensitive groups; **exists, but is not a part of the AQI as outdoor air never gets this polluted due to federal and state regulation and
enforcement action (Ellsworth, 2005).
BMC Public Health 2006, 6:266 />Page 12 of 15
(page number not for citation purposes)
Another model-based survey in Western New York State
reported a range in smoker density in 14 bars and restau-
rant/bars from 0.25 to 3.15 BC/100 m
3
, averaging 1.36
BC/100 m
3
; the mean estimate SHS-RSP level was 385 μg/
m
3
, and the total RSP pollution level declined by 93%
after a state-wide smoking ban [39]. This is in good agree-
ment with a study of the effectiveness of a state-wide
smoking ban in New York State, where urine cotinine lev-
els, a measure of SHS exposure, declined by 94%, from a
pre-ban median of 4.93 ng/ml in non-casino hospitality
workers (n = 36) to a post-ban level of 0.3 ng/ml (n = 27),
the level of detection [30].
Similar results have been observed in Europe. Mulcahy et
al. [23] randomly sampled 20 city centre bars in Galway,
Ireland, for air nicotine concentrations before and after
the Irish national smoking ban. They found an 83%
reduction in air nicotine concentrations following the
smoking ban. However, smoker density was not reported.
Edwards et al. [37] conducted a cross sectional study in
four mainly urban areas of the North West of England
measuring a mean PM
2.5
level of 285.5 μg/m
3
(95% CI
212.7 to 358.3), in a stratified random sample of 64 pubs;
smoker density was not reported. Levels were higher in
pubs in deprived communities: mean 383.6 μg/m
3
(95%
Pre-ban secondhand smoke respirable particulate, SHS-RSP, (total measured RSP – background RSP, B) in micrograms per cubic meter and SHS-PPAH concentration (total measured PPAH – background PPAH, B') in nanograms per cubic meter ver-sus burning cigarette density D
s
(active smokers observed per hundred cubic meters of space volume) and air exchange rate C
v
in units of air changes per hour (ach) as calculated from RSP using the model of Repace (2005)Figure 4
Pre-ban secondhand smoke respirable particulate, SHS-RSP, (total measured RSP – background RSP, B) in micrograms per
cubic meter and SHS-PPAH concentration (total measured PPAH – background PPAH, B') in nanograms per cubic meter ver-
sus burning cigarette density D
s
(active smokers observed per hundred cubic meters of space volume) and air exchange rate C
v
in units of air changes per hour (ach) as calculated from RSP using the model of Repace (2005). The decay rates of PPAH are
higher than for RSP. Background-subtraction values are arbitrarily chosen from measured open-window nonsmoking hotel
room values. Data from Pub # 6 are omitted from this plot.
0
50
100
150
200
250
300
350
0
50
100
150
200
250
300
350
Estimated SHS-RSP (
μ
g/m
3
)
0 0.5 1 1.5
D
s
, Burning Cigarettes per 100 m
3
Boston Good Friday Pub Study
PPAH - B'
RSP - B
0.75
ach 1.98
ach
4.23
ach
Estimated SHS-PPAH (ng/m
3
)
BMC Public Health 2006, 6:266 />Page 13 of 15
(page number not for citation purposes)
CI 249.2 to 518.0) vs 187.4 μg/m
3
(144.8 to 229.9). The
highest outdoor levels observed were about 24 μg/m
3
sug-
gesting that overall, about 92% of the RSP levels might
have been due to SHS. The UK will ban smoking in pubs
in 2007.
The Boston pre-ban PPAH results 61.7 ng/m
3
(SD 54.9),
half of those found in the Wilmington air quality study,
134 ng/m
3
(SD 86.5), whereas the smoker density varied
from 0.03 to 1.31 in Boston, and averaged 0.57 (SD 0.44).
However the average air exchange rate in the Boston study
was higher, at 2.26 h
-1
(SD 1.37), compared to 1.4 h
-1
(SD
0.97) in the Wilmington Study. Further, to place the
preban Boston PPAH results into perspective, they are
compared with PPAH measurements in outdoor air meas-
ured in nine sites in Roxbury, a Boston neighborhood pol-
luted by heavy diesel bus and truck emissions. Median
Roxbury concentrations ranged from 4 to 57 ng per cubic
meter (ng/m
3
), and averaged 18 ng/m
3
over all sites [18].
Our PPAH levels average (61.7/18) = 3.4 times as high as
on the most heavily travelled roadways in Boston. Finally,
a regression of the SHS RSP vs. SHS PPAH yields a ratio of
~2030:1, in excellent agreement with the value of 2054:1
reported in the Delaware study [12].
Air quality and health
To place the predicted and observed levels of RSP into per-
spective, consider the U.S. Annual National Ambient Air
Quality Standard (NAAQS) for particulate matter 2.5
microns in diameter or less (PM
2.5
), which encompasses
combustion-related fine particulate by-products such as
tobacco smoke, chimney smoke, and diesel exhaust. In
1997, the EPA promulgated a 24-hour NAAQS for PM
2.5
,
of 65 μg/m
3
, not to be exceeded more than once per year,
and an annual NAAQS for PM
2.5
of 15 μg/m
3
, based on
protecting human health [19,20,35]. The NAAQS for
PM
2.5
is designed to protect against such respirable parti-
cle health effects as premature death, increased hospital
admissions, and emergency room visits (primarily the eld-
erly and individuals with cardiopulmonary disease);
increased respiratory symptoms and disease (children and
individuals with cardiopulmonary disease); decreased
lung function (particularly in children and individuals
with asthma); and against alterations in lung tissue and
structure and in respiratory tract defense mechanisms in
all persons. [19]. PM
2.5
and PM
3.5
are closely related [21].
The annual average PM
2.5
level for Boston (City Square)
for 2001 was: 13.25 μg/m
3
[34]. 90% of U.S. Counties
have PM2.5 levels below about 16 μg/m
3
[22]. The intent
of the NAAQS is to limit risk to human health from expo-
sure to particulate air pollution. The NAAQS does not
apply de jure to indoor air quality because the U.S. Clean
Air Act specifies only outdoor ambient air and as such is
not an exposure standard, however, this health-based
standard may be used de facto to evaluate levels of indoor
air quality provided averaging times are taken into
account. We did not consider using OSHA workplace
standards as a basis of comparison, because they are far
less protective of human health than EPA standards.
Recent research on the adverse health effects of fine parti-
cle pollution shows estimated concentration-response
functions that are approximately linear, with no evidence
of safe threshold levels; moreover, unresolved gaps in
understanding exist concerning who is most at risk or
most susceptible [10].
The average pre-ban SHS PM
3.5
level in the 6 pubs (exclud-
ing Pub #6) was 179 μg/m
3
, and post-ban 7.73 μg/m
3
.
Subtracting post-ban background, and assuming pub staff
work 260 days per year, 8 hrs per day, they are exposed to
an annual average of (171 μg/m
3
)(260 d/365 d)(8 hr/24
hr) = 40.6 μg/m
3
from SHS, and to an annual average
background level of 13.25 μg/m
3
from outdoor non-SHS
sources. Assuming that these averages are sustained over
the required 3 year averaging period, SHS exceeds the 15
μg/m
3
level of the Annual National Ambient Air Quality
Standard by a factor of (40.6 + 13.25)/15 = 3.6. Although
no standards have been set for PPAH, assuming an 8-hr
workday, on a 24-hr average basis for the 7 venues sam-
pled, pre-ban PPAH exceeded post-ban PPAH levels by a
factor of [(65.1/3) + 6.32)]/6.32 = 4.1, significantly
increasing exposure of workers to substances known to be
implicated in the causation of cancer, heart disease, and
stroke [12,31,32].
Figures 1, 2, and 3 taken together demonstrate conclu-
sively that secondhand smoke causes most or a significant
fraction of the massive RSP and PPAH pollution eleva-
tions shown in 6 of 7 hospitality venues of Figure 1.
Smoking in these Massachusetts hospitality venues caused
levels of respirable particles and particle-bound PAH car-
cinogens exposure to increase by six-to-ten-fold. The mod-
els developed from Equation 1 generalize the results to
other hospitality venues. Finally, the elevated carbon
monoxide levels and heavy RSP pollution in Pub #6
before and after the smoking ban suggest that the kitchen
exhaust equipment has broken down and grilling fumes
are being pulled into the dining room along with cooking
gas fumes from a defective deep-fat fryer. Overall, RSP lev-
els decreased from 179 μg/m
3
to 8 μg/m
3
, or by 96% and
PPAH levels decreased from 65 ng/m
3
to 6 ng/m
3
, or by
90%. There are few public policy interventions that
require such a small public investment and that yield such
a dramatic return in such a short period of time.
Health risk assessment for workers and patrons
What are the disease risks of SHS-RSP at the odor and irri-
tation thresholds? Repace et al. estimated [27] that lung
cancer and heart disease mortality risk combined from
workplace SHS (annualized workplace exposure of 6.7
BMC Public Health 2006, 6:266 />Page 14 of 15
(page number not for citation purposes)
hours daily) for a working lifetime of 40 years was 150
deaths per million persons at risk per 1 μg/m
3
. Since the
federal (EPA) de minimis risk level is 1 death per million
workers at risk, at the lowest odor threshold ever meas-
ured, the risk from passive smoking is 150 times de mini-
mis risk, and at the lowest irritation level ever measured,
600 times de minimis risk. the de minimis risk is defined as
a level "below regulatory concern" [28]. In other words, if
SHS can be smelled, it's at harmful levels.
At the 179 μg/m
3
level SHS-RSP averaged over all venues,
the chronic risk of these two diseases combined is (179/
1)(150 × 10
-6
) = ~27 deaths per 1000 workers per 40 year
working lifetime. This exceeds the Occupational Safety
and Health Administration's Significant Risk of Material
Impairment of Health level of 1 death per 1000 per 45
years [27] by a factor of (45/40)(27 per 1000)/(1 per
1000) = 30-fold. Thus these exposures were quite signifi-
cant [28] by U.S. federal risk assessment standards for
occupational and environmental health.
Air Quality forecasts are provided by State and local agen-
cies, using the U.S. Environmental Protection Agency's
(EPA) Air Quality Index (AQI) [22], a uniform index that
provides general information to the public about air qual-
ity and associated health effects. These index descriptors
are described in Table 4. Health advisories and warnings
are based on the current AQI as well as the forecasted AQI.
Air quality authorities maintain running averages for each
pollutant, and an appropriate AQI is reported that gener-
ally corresponds to the current average. For most major
cities, air quality forecasts, based on predicted meteoro-
logical conditions and monitored air quality, are also
released to the public usually during the afternoon hours
of the day preceding the forecast period. These forecasts
are for PM and ozone, since these are the pollutants that
generally contribute to unhealthy air quality. If pollutant
levels are expected to be unhealthy, the state and local
agencies will release a color-coded health warning or advi-
sory to the local media and post these advisories on their
web sites [22]. The color codes and corresponding nor-
malized Air Quality Indices are based upon "break-
points" or ranges of minimum-to-maximum particulate
levels corresponding to increasing severity of expected
health effects. AQI values are usually below 100, with val-
ues greater than 100 occurring at most several times a
year. The SHS-RSP levels in Table 5 for the 7 pubs range
from AQI descriptors corresponding to Unhealthy for
Sensitive groups (2), to Unhealthy (1), to Very Unhealthy
(1), to Hazardous (3). This comports with Biener et al.'s
[29] reported health reasons for nonsmokers' aversion to
SHS. The air pollution levels overall correspond for all
venues to a level of 198 μg/m
3
, or Very Unhealthy.
Conclusion
Our air quality survey in 7 Boston Massachusetts pubs
indicates that Boston's smoke-free law reduced RSP pollu-
tion by 90% to 95% and PPAH pollution by 80% to 90%.
Few public investments have yielded such large public
health gains in such a short period of time at so little cost.
Pre-ban air pollution levels ranged from Unhealthy for
Sensitive groups to Hazardous, and on average corre-
sponded to Very Unhealthy levels as judged by the AQI for
outdoor PM
2.5
. Post-ban AQIs were in the Good range,
except in one pub that had a malfunctioning kitchen
appliance. This pub was excluded from the air quality
averages. RSP and PPAH levels were correlated during
smoking and were proportional to the density of burning
cigarettes. While ventilation rates were generally in com-
pliance with design rates at the 39% average occupancy, at
maximum occupancies they would not have met ASHRAE
Standard 62–2001 recommendations. SHS risk to workers
exposed at the 6-pub average exceeds OHSA' Significant
Risk level by a factor of 30 for lung cancer and heart dis-
ease combined. Workplace exposures to SHS-RSP
exceeded the U.S. NAAQS 4-fold. Carcinogenic risk apart,
ventilation was incapable of controlling RSP to meet the
NAAQS without a 100-fold increase in outdoor air supply.
Smoke-polluted pubs had average levels of fine particles
and particulate carcinogens which were ten-fold and
three-fold higher respectively than previously reported for
Boston streets with heavy truck and bus traffic. Averge
SHS-RSP values exceeded irritation and odor thresholds
by factors of 39 to 171 respectively. Daily SHS-PPAH
exposures were quadrupled relative to outdoors. The lack
of an economic impact from Massachusetts' smoke-free
workplace law may have resulted from reductions in odor
and irritation, making hospitality venues more attractive
to the nonsmoking majority.
Clinical significance
Nonsmoking hospitality workers and patrons are exposed
to unhealthy levels of air pollution and high levels of irri-
tation and odor from secondhand smoke.
Competing interests
JN Hyde and D Brugge declare they have no competing
interests. JL Repace is a secondhand smoke consultant,
and has served as an expert witness in litigation involving
secondhand smoke morbidity and mortality.
Authors' contributions
JLR, JNH, and DB conceived the study and participated in
drafting the manuscript; JNH selected the venues to be
sampled; JLR and JNH carried out the field measurements.
All authors read and approved the final manuscript.
Acknowledgements
We are grateful to Ms. Meghan Burch and Ms. Russett Morrow, of The Mas-
sachusetts Coalition For a Healthy Future, who served as observers and
BMC Public Health 2006, 6:266 />Page 15 of 15
(page number not for citation purposes)
assisted with logistics, and supported the air quality study. JL Repace's work
was supported by the Robert Wood Johnson Innovator Award. This work
was also funded in part by The Massachusetts Coalition For a Healthy
Future, and by the Bonawit Fund via the Vanguard Charitable Endowment
Program.
References
1. National Research Council: Environmental tobacco smoke – measuring
exposures and assessing health effects National Academy Press, Wash-
ington DC; 1986.
2. Surgeon General: The Health Consequences of Involuntary Exposure to
Tobacco Smoke, A Report of the Surgeon General U.S. Dept. of Health
and Human Services, Centers for Disease Control and Prevention,
Atlanta, GA; 2006.
3. NIOSH Current Intelligence Bulletin #54: Environmental Tobacco
Smoke in the Workplace, Lung Cancer and Other Health Effects U.S.
Department of Health and Human Services, National Institute for
Occupational Safety and Health, Cinncinati, OH; 1991.
4. U.S. EPA, Health Effects of Passive Smoking: Assessment of Lung Cancer
in Adults, and Respiratory Disorders in Children. EPA/600/6-90/006F 1992.
5. OSHA: U.S. Dept. of Labor, Occupational Safety & Health Administration.
29 CFR Parts 1915, 1926, and 1928 Indoor air quality, proposed rule Fed
Reg 59 # 65, Tues April 5, 1994, 15968-16039 .
6. CALIFORNIA ENVIRONMENTAL PROTECTION AGENCY: Health
Effects of Exposure to Environmental Tobacco Smoke, SRP-Approved Air
Resources Board, Office of Environmental Health Hazard Assess-
ment. Sacramento, CA; 2005.
7. National Toxicology Program: 9th Report on Carcinogens. U.S.
Dept. of Health & Human Services, National Institute of Environmental
Health Sciences, Research Triangle Park, NC 2000.
8. Hoffmann D, Hoffmann I: Significance of exposure to side-
stream tobacco smoke. Ch. 1. In IARC Scientific Publications no.81,
Environmental Carcinogens – Selected Methods of Analysis – Volume 9 Pas-
sive Smoking Edited by: O'Neill I, Brunnemann K, Dodet B, Hoffmann
D. International Agency for Research on Cancer, World, Health
Organization, United Nations Environment Programme, Lyon,
France; 1987.
9. Repace JL: Human Exposure to Secondhand Smoke. In Human
Exposure Analysis Edited by: Ott WR, Wallace LA, Steinemann AM.
CRC Press; 2006.
10. Pope CA, Dockery DW: Health effects of fine particulate air
pollution: lines that connect. 2006 Critical Review. J. Air &
Waste Manage Assoc 2006, 56:709-742.
11. IARC Monographs on the Evaluation of Carcinogenic Risks
to Humans Tobacco Smoke and Involuntary Smoking. Vol-
ume 83. World Health Organization, International Agency for
Research on Cancer. Lyon, France; 2004.
12. Repace JL: Respirable Particles and Carcinogens in the Air of
Delaware Hospitality Venues Before and After a Smoking
Ban. Journal of Occupational and Environmental Medicine 2004,
46:887-905.
13. American Society of Heating Refrigerating and Air Conditioning Engi-
neers: Ventilation for Acceptable Indoor Air Quality, ASHRAE Standard 62-
1989, Atlanta, GA 1989.
14. Repace JL, Lowrey AH: Indoor Air Pollution, Tobacco Smoke,
and Public Health. SCIENCE 1980, 208:464-474.
15. Ott WR: Mathematical models for predicting indoor air qual-
ity from smoking activity. Environmental Health Perspectives 1999,
107(suppl 2):375-381.
16. Weather Underground [
]
17. Connally GN, Carpenter C, Alpert HR, Skeer M, Travers M: Evalu-
ation of the Massachusetts Smoke-free Workplace Law, a
preliminary report, Harvard School of Public Health,
Tobacco Research Program. 2005 [
vard.edu/php/pri/tcrtp/Smoke-free_Workplace.pdf].
18. Levy JI, Bennett DH, Melly SJ, Spengler JD: Influence of traffic pat-
terns on particulate matter and polycyclic aromatic hydro-
carbon concentrations in Roxbury, Massachusetts. J Exposure
Analysis & Environmental Epidemiology 2003, 13:364-371.
19. Federal Register: July 18, 1997. 62(138):38651-38701. Rules and
Regulations
20. Ware JM: [EDITORIAL] Particulate Air Pollution and Mortal-
ity – Clearing the Air. New England J Medicine 343(24):. Decem-
ber 14, 2000
21. Wallace L: Indoor particles: a review. J Air & Waste Mgt Assoc
1996, 46:98-126.
22. US Environmental Protection Agency [ />airtrends/pm.html]
23. Mulcahy M, Evans DS, Hammond SK, Repace JL, Byrne M: Second-
hand smoke exposure and risk following the Irish smoking
ban: an assessment of salivary cotinine concentrations in
hotel workers and air nicotine levels in bars. Tobacco Control
2005, 14:384-388.
24. MMWR: Prevalence of Current Cigarette Smoking Among
Adults and Changes in Prevalence of Current and Some Day
Smoking – United States, 1996-2001. MMWR 52(14):303-307.
April 11, 2003
25. Weber A, Grandjean E: Acute effects of environmental tobacco
smoke. In IARC Scientific Publications no.81, Environmental Carcinogens
– Selected Methods of Analysis – Volume 9 Passive Smoking Edited by:
O'Neill IK, Brunnemann KD, Dodet B, Hoffmann D. International
Agency for Research on Cancer, World, Health Organization, United
Nations Environment Programme, Lyon, France; 1987.
26. Junker MH, Danuser B, Monn C, Koller T: Acute sensory
responses of nonsmokers at very low environmental tobacco
smoke concentrations in controlled laboratory settings. Envi-
ron Health Perspectives 2001, 109:1045-1052.
27. Repace JL, Jinot J, Bayard S, Emmons K, Hammond SK: Air nicotine
and saliva cotinine as indicators of passive smoking exposure
and risk. Risk Analysis 1998, 18:71-83.
28. Travis CC, Richter SA, Crouch EAC, Wilson R, Klema ED: Cancer
Risk Management. Environmental Science and TEchnology 1990,
21:415-420.
29. Biener L, Fitzgerald G: Smoky bars and restaurants: who avoids
them and why? J Public Health Management and Practice 1999,
5:74-78.
30. Abrams SM, Mahoney MC, Andrew Hyland A, Cummings KM, Davis
D, Song L: Early Evidence on the Effectiveness of Clean Indoor
Air Legislation in New York State. Am J Public Health 2006,
96:296-298.
31. ATSDR: Agency for Toxic Substances and Disease Registry.
ToxFAQs for Polycyclic Aromatic Hydrocarbons (PAHs) [http://
www.atsdr.cdc.gov/tfacts69.html].
32. Glantz SA, Parmley WW: Passive smoking and heart disease.
Circulation 1991, 83:1-7.
33. Biener L, Harris JE, Hamilton W: Impact of the Massachusetts
tobacco control programme: population based trend analy-
sis. BMJ 321(7257):351-354. 2000 August 5
34. Massachusetts Department of Environmental Protection.
2003.
35. U.S. EPA Office of Air and Radiation: EPA's Revised Particulate
Matter Standards. Fact Sheet, Office of Air Quality Planning & Stand-
ards . July 17, 1997
36. ASHRAE Handbook 1996 HVAC Systems and Equipment American Soci-
ety of Heating, Refrigerating, and Air Conditioning Engineers, Atlanta,
GA; 1996.
37. Edwards R, Hasselholdt CP, Hargreaves K, Probert C, Holford R,
Hart J, Van Tongeren M, Watson AFR: Levels of second hand
smoke in pubs and bars by deprivation and food-serving sta-
tus: a cross-sectional study from North West England. BMC
Public Health 2006, 6:42. doi:10.1186/1471-2458-6-42
38. Ott W, Switzer P, Robinson J: Particle concentrations inside a
tavern before and after prohibition of smoking: evaluating
the performance of an indoor air quality model. J Air & Waste
Manage Assoc 1996, 46:1120-1134.
39. Travers MJ, Cummings KM, Hyland A, Repace J, Babb S, Pechacek T,
Caraballo R: Indoor Air Quality in Hospitality Venues Before
and After Implementation of a Clean Indoor Air Law –
Western New York. MMWR 2003, 53(44):1038-104. November
12, 2004
Pre-publication history
The pre-publication history for this paper can be accessed
here:
/>pub