Tài liệu Participatory Air Pollution Monitoring Using Smartphones pdf
Bạn đang xem bản rút gọn của tài liệu. Xem và tải ngay bản đầy đủ của tài liệu tại đây (2.95 MB, 5 trang )
Participatory Air Pollution Monitoring Using Smartphones
David Hasenfratz, Olga Saukh, Silvan Sturzenegger, and Lothar Thiele
Computer Engineering and Networks Laboratory
ETH Zurich, Switzerland
{hasenfratz, saukh, thiele}@tik.ee.ethz.ch,
ABSTRACT
Air quality monitoring is extremely important as air pollu-
tion has a direct impact on human health. In this paper
we introduce a low-power and low-cost mobile sensing sys-
tem for participatory air quality monitoring. In contrast to
traditional stationary air pollution monitoring stations, we
present the design, implementation, and evaluation of Gas-
Mobile, a small and portable measurement system based on
off-the-shelf components and suited to be used by a large
number of people. Vital to the success of participatory sens-
ing applications is a high data quality. We improve mea-
surement accuracy by (i) exploiting sensor readings near
governmental measurement stations to keep sensor calibra-
tion up to date and (ii) analyzing the effect of mobility on
the accuracy of the sensor readings to give user advice on
measurement execution. Finally, we show that it is feasi-
ble to use GasMobile to create collective high-resolution air
pollution maps.
1. INTRODUCTION
Urban air pollution is a major concern in modern cities
and developing countries. Atmospheric pollutants consider-
ably affect human health; they are responsible for a variety
of respiratory illnesses (e.g., asthma) and are known to cause
cancer if humans are exposed to them for extended periods
of time [20]. Additionally, air pollution is responsible for en-
vironmental problems, such as acid rain and the depletion of
the ozone layer. Hence, air pollution monitoring is of utmost
importance.
State-of-the-art air quality monitoring. Nowadays, air
pollution is monitored by networks of static measurement
stations operated by official authorities. These stations are
highly reliable and can accurately measure a wide range of
air pollutants using traditional analytical instruments, such
as mass spectrometers. However, the extensive cost of ac-
quiring and operating these stations severely limits the num-
ber of installations and results in a limited spatial resolution
of the published pollution maps [8, 28].
Permission to make digital or hard copies of all or part of this work for
personal or classroom use is granted without fee provided that copies are
not made or distributed for profit or commercial advantage and that copies
bear this notice and the full citation on the first page. To copy otherwise, to
republish, to post on servers or to redistribute to lists, requires prior specific
permission and/or a fee.
2nd International Workshop on Mobile Sensing,
April 16–20, 2012, Beijing, China.
Copyright 2012 ACM 978-1-4503-1227-1/12/04 $10.00.
Participatory air quality monitoring. The concentra-
tion of air pollutants is highly location-dependent. Traffic
junctions, urban canyons, and industrial installations have
considerable impact on the local air pollution [27]. We
tackle the challenge of acquiring spatially fine-grained air
pollution data with a community-driven sensing infrastruc-
ture. Such initiatives that pursue the public gathering of
reliable data gained increasing popularity in the last years,
e.g., worldwide data collection of local food conditions or
nuclear radiation.
1
These examples show that it is possible
to collect region-wide measurements by involving the gen-
eral public. Given the broad availability of personal GPS-
equipped smartphones, we aim to use these devices to build
a large-scale sensor network of mobile devices for partici-
patory air pollution monitoring [25]. Involving the average
citizen in sensing the air she breathes helps to rise public
awareness and encourages to move towards sustainable de-
velopment [1].
Challenges. Getting the general public involved in partic-
ipatory air quality monitoring to collect useful data posts
several challenges. These involve providing the user with:
• Low-cost and low-power measurement hardware suit-
able for mobile measurements;
• Unobtrusive and user-friendly data acquisition and pro-
cessing software;
• Support in gathering high quality data;
• Information feedback as reward and incentive.
We tackle these challenges with our prototypical air quality
measurement system GasMobile. We connect a small-sized,
low-cost ozone sensor to an off-the-shelf smartphone running
the Android OS. We describe in Sec. 2 the hardware and
software system designs in detail and reveal the arising dif-
ficulties and constraints in controlling a gas sensor directly
with a smartphone. In Sec. 3 we approach the problem of re-
ceiving high-quality measurements in a mobile scenario: we
(i) exploit measurements near static stations to improve sen-
sor calibration, and (ii) analyze the effect of mobility on the
accuracy of the sensor readings to give advice on measure-
ment execution. In Sec. 4 we use GasMobile measurements
to create good quality air pollution maps with a high spatial
resolution. We survey related work in Sec. 5, and end the
paper in Sec. 6 with brief concluding remarks.
1
costofchicken.crowdmap.com, radiation.crowdmap.com
0 50 100 150 200
0
10
20
30
40
50
Current draw [mA]
Time [s]
Sensor off
Sensor off
Sensor
overheating
Sensor ready
Sensor in
automatic mode
Sensor idle
Poll sensor
every 10s
Poll sensor
every 2s
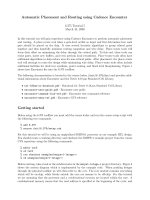
Figure 1: Current draw of the ozone sensor and USB
translator over time. Sensor polling does not noticeably
increase the current draw.
2. SYSTEM DESIGN
This sections describes the hardware and software archi-
tecture of GasMobile.
2.1 Hardware Architecture
Our measurement system consists of four parts as dis-
played in Fig. 2(a). We use a MiCS-OZ-47 sensor from
e2v [4] to sense the ozone concentration in the atmosphere
based on the measured resistance of the sensor’s tin diox-
ide (SnO
2
) layer. Digital communication is possible over the
board’s RS232-TTL interface, which is directly connected
to an off-the-shelf HTC Hero smartphone providing a USB
Mini-B port. All parts are stock hardware available for low
prices (in the range of hundreds of dollars in total). This is
essential to obtain widespread acceptance of participatory
sensing equipment.
USB host mode. In order to control another USB de-
vice with a smartphone, the phone has to support USB host
mode. This enables the interaction with various USB devices
such as memory sticks, external hard drives, keyboards, or
gas sensors in our case. Although many smartphones’ hard-
ware theoretically supports USB host mode (e.g., Motorola
Milestone, Motorola Droid, Nexus One, and HTC Hero), the
manufacturers do not enable this functionality by default.
2
Power supply in host mode. Usually USB host con-
trollers provide enough power on the 5 V line to at least
power a low-power peripheral (i.e., 100 mA at 5 V). Since
the HTC Hero is not designed for host mode, its USB con-
troller lacks the ability to provide power over the USB port.
Hence, we power the sensor externally with a battery pack.
As a side benefit, the sensor’s and smartphone’s power sup-
plies are entirely independent from each other. However,
new smartphones innately supporting USB host mode do
not necessarily need an external power source.
Power consumption. Having an extended battery lifetime
is crucial for mobile and participatory sensing applications.
We analyze the total current draw of the ozone sensor and
the USB-RS232 translator, both components being powered
by the battery pack. We use an Agilent digital multime-
ter with a sampling rate of 100 ms; the measured current
draws are illustrated in Fig. 1. After each power-on, the
tin dioxide layer of the ozone sensor is overheated for 60 s.
This overheating decreases the sensor drift over time. The
current draw during the overheating phase is 47 mA. After
overheating, the sensor is ready for taking measurements.
2
Lately some smartphones appeared on the market that in-
nately support USB host mode (e.g., Samsung Galaxy S II).
We put the sensor in automatic mode in which it uses its
own clock to automatically perform measurements every two
seconds. This ensures that an up-to-date measurement read-
ing is always available for the application, which polls the
sensor. Each measurement results in a short 50 mA peak of
the current draw, as shown in Fig. 1. Applications polling
sensor readings do not noticeably increase the current draw.
We operate the gas sensor using four AAA NiMH batteries
with a nominal capacity of 2500 mAh at 1.2 V. Considering
the highest measured current draw of 50 mA, we roughly
estimate a battery lifetime of 50 hours. This lifetime allows
us to monitor the ozone concentration for approximately one
month, assuming that on average an adult spends 1.7 hours
per day outdoors [12].
2.2 Smartphone Client
Next, we detail the software architecture.
Android OS. As described above, the Android kernel sup-
plied by HTC does not support USB host mode. Hence, we
choose the popular CyanogenMod custom kernel [3]. At the
moment, Android itself does not provide an API for reading
and writing to the serial port. Thus, we use android-serial-
api [2] for the serial communication between ozone sensor
and smartphone. We periodically poll the gas sensor for
raw sensor readings, which include the resistance R of the
tin dioxide layer and the on-board temperature T. As the
resistance is heavily temperature-dependent, we use T to
calculate the temperature-compensated resistance
˜
R
˜
R = R · e
K·(T −T
0
)
(1)
with the reference temperature T
0
= 25
◦
C and the tempera-
ture coefficient K = 0.025 from [4]. Since the response curve
of the ozone sensor is quasi-linear with respect to the ozone
concentration c [13], we approximate it with a first-order
polynomial
c(
˜
R, a
0
, a
1
) = a
0
+ a
1
·
˜
R (2)
where a
0
and a
1
represent the calibration parameters of the
sensor. We will detail in Sec. 3.1 how our Android applica-
tion helps the user determine these calibration parameters.
Android application. The application starts with the
main menu depicted in Fig. 2(b). The user can access the
settings, take measurements, calibrate the sensor, or upload
the measurements to a server. Using the settings screen,
shown in Fig. 2(c), the user can change several configura-
tion parameters. Both the temperature coefficient K and
the calibration parameters a
0
and a
1
are usually predefined
by the manufacturer. However, to get the best possible ac-
curacy, it is recommended to calibrate the sensor with real
pollution measurements [16], as described in Sec. 3.1.
In the measurements screen (see Fig. 2(e)) the user can
put the sensor in automatic mode and choose whether to
poll the sensor once or continuously with a pre-configured
poll interval. The application polls the latest raw data from
the ozone sensor (resistance, temperature, and humidity),
and position and speed information from the GPS mod-
ule. The ozone concentration is calculated using (2) and
displayed in the plot on the screen. The geo-localized and
time-stamped measurements can be permanently stored on
the smartphone’s memory card and uploaded to a server
for further processing and visualization, e.g., to refine sen-
sor calibration and to produce ozone concentration maps as
described in Sec. 4.
(a) Hardware architecture (b) Main menu (c) Settings (d) Calibration (e) Measurements
Figure 2: GasMobile hardware architecture (a) and Android application (b)-(d). The user can set the poll interval,
adjust calibration parameters, poll sensor measurements, and upload the measurements to a server for further processing.
Memory and CPU footprint. A resource-sparing ap-
plication is essential to achieve a long battery lifetime and
thus gain consumer acceptance. The GasMobile application
uses just 41.5 kB from the 166 MB of internal storage on the
HTC Hero. When the application is running, it uniquely
uses 5.5 MB of system memory and shares 25 MB with other
running processes. The CPU usage is increased by 5 % while
polling the sensors and calculating the ozone concentration.
In summary, the resource requirements are very low.
2.3 Extensibility to Other Gas Sensors
Extending GasMobile to support other sensors is straight-
forward and only requires minor modifications in two soft-
ware components, as long as the sensor provides serial com-
munication over USB. First, the serial communication pro-
tocol has to be tailored to the software and hardware re-
quirements of the intended sensor. Second, the Android ap-
plication must be implemented to facilitate the interaction
between user and sensor.
3. INCREASING SENSING ACCURACY
Usually data users must assume a certain data quality.
Thus, a high data quality is vital to the success of participa-
tory sensing applications. This section examines the possi-
bilities to optimize data quality gathered by mobile sensors.
We keep sensor calibration up to date by exploiting sen-
sor readings near a static reference station, and analyze the
influence of mobility on the measurement accuracy to give
advice on measurement execution.
3.1 Sensor Calibration with Quality Feedback
Sensor calibration is a difficult and time-consuming task.
Low-cost gas sensors must be frequently re-calibrated [26] as
they are unstable and responsive to the influence of interfer-
ing gases [16]. GasMobile provides assistance in keeping the
calibration parameters up to date by using publicly avail-
able high-quality measurements from static reference sta-
tions maintained by official authorities [13].
We exploit GasMobile sensor readings that are measured
in the vicinity of a static reference station. The temporal
and spatial vicinity requirements largely depend on the mea-
sured pollutant. The spatial dispersion of ozone in a street
canyon is in general constant [27] and the ozone concentra-
Sensor
calibration
Reference
measurements
Calibration
parameters
Internet
Sensor
readings
Figure 3: Calibration procedure. Measurements near a
reference station are used to update calibration parameters.
tion is typically slowly changing over time (in the order of
minutes). Hence, we specify in the settings (see Fig. 2(d)),
that sensor readings and reference measurements are con-
sidered to be exposed to very similar ozone concentrations
if their measurement time and location do not differ more
than 10 min and 400 m, respectively.
Fig. 3 depicts an overview of the calibration procedure.
The application fetches all sensor readings from the memory
card that satisfy the time period set by the user. Addition-
ally, the available reference measurements for this time pe-
riod are retrieved from the web. Both data sets are streamed
through a data filter in order to construct calibration tuples
of those sensor readings and reference measurements that
satisfy the given vicinity requirements. Consider that set S
contains these calibration tuples (
˜
R, M) with sensor read-
ing
˜
R and reference measurement M. We use the method
of least squares [6] to choose the calibration parameters a
0
and a
1
such that the sum of squared differences between
c(
˜
R, a
0
, a
1
) and M are minimized ∀ (
˜
R, M) ∈ S
arg min
a
0
,a
1
(
˜
R,M )∈S
c(
˜
R, a
0
, a
1
) − M
2
(3)
The application provides a visual feedback on the calibration
as shown in the plot in Fig. 2(d). The green dots display
the calibration tuples, the red dashed line denotes the cur-
rent calibration, and the red straight line represents the new
calculated calibration parameters a
0
and a
1
. The gray area
visualizes the standard deviation σ of the new calculated
0 100 200 300 400 500 600 700 800
0
10
20
30
Temperature [
Time [s]
Fan on
°C]
8°C
Figure 4: Air flow generated by a fan (shaded area)
influences the readings of the on-board temperature
sensor. We measure a maximum drop of 8
◦
C.
calibration parameters given by
σ
2
=
1
|S|
·
(
˜
R,M )∈S
c(
˜
R, a
0
, a
1
) − M
2
(4)
In general, the adjustment of the calibration parameters is
not advisable if the calibration curve currently in use lies
inside the gray area, which denotes the uncertainty of the
new calculated calibration curve (as shown in Fig. 2(d)).
3.2 Effect of Mobility on Sensor Readings
In the following, we analyze the effect of sensor mobility
on the accuracy of the sensor readings, mostly due to the
varying air flow around the sensor head.
We carry out several experiments in a closed room with a
constant ozone concentration. We use a table fan that gener-
ates a maximum wind speed of 6.6 m/s to analyze the influ-
ence of the air flow on the raw sensor readings. We observed
that the air flow mainly impacts the on-board temperature
T used in (1) to calculate resistance
˜
R. The air flow around
the sensor head influences the heat dissipation on the sensor
board and results in a lower temperature reading of at most
T
a
= 8
◦
C as shown in Fig. 4. The temperature drop induces
a maximum relative error of 14 % in the calculation of the
temperature-compensated resistance:
1 −
˜
R
a
/
˜
R = 1 − e
−K·T
a
= 0.14 (5)
This maximum relative difference is negligible for low ozone
concentrations, but results in a high offset under high pol-
lution levels. No precaution is required for measurement
campaigns with pedestrians, which are usually moving at a
slow speed. However, we recommend to protect the sensor
head from a direct exposure to air flow under rapid motion
speeds of the sensor head, e.g., while riding a bicycle. Alter-
natively, accelerometer data can be used to measure motion
speeds in order to compensate the temperature drop due to
mobility.
4. APPLICATION SCENARIO
We provide a full system for mobile participatory sens-
ing [7], ranging from the sensing hardware and client soft-
ware with calibration support as described in the previous
sections to a powerful web-based data visualization tool to
create collective air pollution maps. In the following, we
present results from a measurement campaign using GasMo-
bile and provide an estimation of its measurement accuracy.
Measurement campaign. We used GasMobile over a pe-
riod of two months for pollution measurements in an urban
area. For this, we mounted the sensor on a bicycle (pro-
tected from wind) and took measurements from several bi-
cycle rides all around the city. Throughout the measurement
(a) Overview (b) Close-up view
Figure 5: Two ozone pollution maps with distinct
spatial resolutions based on GasMobile measure-
ments. Data are from several bicycle rides with a poll in-
terval of five seconds.
Total number of Measurements near Mean error Std. error
measurements a reference station [ppb] [ppb]
2,815 34 2.74 4.19
Table 1: Measurements in the vicinity of reference
stations are used to calculate the measurement er-
ror. On average the error is within 2.74 ppb.
campaign we used a sampling interval of five seconds and col-
lected in total 2,815 spatially distributed data points. All
sensor readings were directly uploaded to our server running
GSN (Global Sensor Network) [5]. The measurements are
publicly available
3
and it is possible to browse through the
full data set. We use location- and time-based data aggrega-
tion and caching for efficient data retrieval [18]. This allows
the user to easily revisit past measurements and combine
different data sets from multiple participants to produce col-
lective air pollution maps with different spatial resolutions
as shown in Fig. 5. Using these maps, we can clearly spot
differences between streets of high and low pollution concen-
trations, which is impossible with currently published pol-
lution maps.
Generation of air pollution maps. To produce the air
pollution maps, we divide the area excerpt selected by the
user into rectangular regions of 35 x 35 pixels. For each re-
gion we calculate the average ozone concentration based on
the measurements performed in that region. We classify the
regions into three zones (green, yellow, and red) correspond-
ing to the average ozone concentration level as illustrated in
Fig. 5 with two distinct spatial resolutions.
Measurement accuracy. We estimate the measurement
accuracy by extracting sensor readings that were measured
in the spatial and temporal vicinity (≤ 400 m and ≤ 10 min)
of one of the four reference stations. The errors are on aver-
age 2.74 ±4.19 ppb compared to high-quality measurement
instruments as summarized in Table 1, this is only slightly
higher than in a static setting [13]. This is sufficient to cre-
ate accurate air pollution maps considering that the daily
ozone concentration typically ranges between 0 and 70 ppb.
3
5. RELATED WORK
Mobile phones are used in a wide range of application
scenarios to facilitate data collection, such as visibility mon-
itoring [22], traffic conditions surveillance [23], sensing indi-
vidual emotions [24], and bicycle localization [19]. Many of
these smartphone-based sensing applications use bluetooth
for data transfer between sensor and smartphone [10, 11,14,
15]. Bluetooth gives the user great freedom in sensor place-
ment, but leads to higher battery drain due to bluetooth
communication on the device and sensor side. We instead
exploit USB host mode and directly connect the sensor to
the smartphone. With this we reduce the power draw by a
factor two.
Monitoring air pollution using low-cost gas sensors has
gained high interest in recent years [26]. Low-cost gas sen-
sors are often embedded in custom-build sensor nodes that
are part of mobile sensor networks [9, 10, 14]. Instead, we
control the gas sensor with minimal additional hardware us-
ing an off-the-shelf smartphone. This keeps material costs
low and thus makes our measurement system attractive to
a large number of people as a large-scale sensor network of
mobile phones [17].
Compared to previously proposed participatory sensing
applications [10, 14], we tackle the challenge of improving
data quality of mobile sensors. To this end, we provide sup-
port to continuously keep sensor calibration up to date.
Only few publications are dealing with sensor calibration
in mobile sensor networks. Most similar to our calibration
approach is CaliBree [21], a distributed self-calibration pro-
tocol for mobile wireless sensor networks.
6. CONCLUSIONS
We show with our GasMobile prototype system, that par-
ticipatory air pollution monitoring is feasible. We use small,
low-cost, and off-the-shelf hardware to monitor the ozone
concentration. GasMobile provides a high data accuracy by
exploiting sensor readings near static measurement stations
to regularly keep sensor calibration up to date. Finally, we
show, that it is feasible to use GasMobile in participatory
sensing applications to increase public awareness and to cre-
ate spatially fine-grained air pollution maps.
Acknowledgements. The authors thank Matthias Keller
for the support with data visualization and Marco Zimmer-
ling for his valuable feedback. This work was funded by
NanoTera.ch with Swiss Confederation financing.
7. REFERENCES
[1] Rio declaration on environment and development. In
United Nations Conference on Environment and
Development, 1992.
[2] Android serial port api.
code.google.com/p/android-serialport-api, 2011.
[3] Cyanogenmod kernel source code for htc hero.
www.github.com/erasmux/hero-2.6.29-flykernel, 2011.
[4] MiCS-OZ-47 ozone sensing head with transmitter board.
www.e2v.com/e2v/assets/File/sensors_datasheets/
Metal_Oxide/mics-oz-47.pdf, 2011.
[5] K. Aberer, M. Hauswirth, and A. Salehi. A middleware for
fast and flexible sensor network deployment. In ACM
VLDB, 2006.
[6] A. Bj
¨
orck. Numerical methods for least squares problems.
In SIAM, 1996.
[7] J. Burke, D. Estrin, M. Hansen, A. Parker,
N. Ramanathan, S. Reddy, and M. Srivastava.
Participatory sensing. In WSW, 2006.
[8] A. Carullo, S. Corbellini, and S. Grassini. A remotely
controlled calibrator for chemical pollutant
measuring-units. In IEEE TIM, 2007.
[9] S. Choi, N. Kim, H. Cha, and R. Ha. Micro sensor node for
air pollutant monitoring: Hardware and software issues. In
Sensors MEMS, 2009.
[10] P. Dutta, P. Aoki, N. Kumar, A. Mainwaring, C. Myers,
W. Willett, and A. Woodruff. Demo abstract: Common
sense – participatory urban sensing using a network of
handheld air quality monitors. In ACM SenSys, 2009.
[11] T. Fahrni, M. Kuhn, P. Sommer, R. Wattenhofer, and
S. Welten. Sundroid: Solar radiation awareness with
smartphones. In ACM UbiComp, 2011.
[12] T. Fears, C. Bird, D. Guerry, R. Sagebiel, M. Gail,
D. Elder, A. Halpern, E. Holly, P. Hartge, and M. Tucker.
Average midrange ultraviolet radiation flux and time
outdoors predict melanoma risk. In AACR Cancer
research, 2002.
[13] D. Hasenfratz, O. Saukh, and L. Thiele. On-the-fly
calibration of low-cost gas sensors. In Springer EWSN,
2012.
[14] R. J. Honicky, E. A. Brewer, E. Paulos, and R. M. White.
N-smarts: Networked suite of mobile atmospheric real-time
sensors. In ACM NSDR, 2008.
[15] Y. Jiang, K. Li, L. Tian, R. Piedrahita, X. Yun,
O. Mansata, Q. Lv, R. P. Dick, M. Hannigan, and
L. Shang. Maqs: A mobile sensing system for indoor air
quality. In ACM UbiComp, 2011.
[16] M. Kamionka, P. Breuil, and C. Pijolat. Calibration of a
multivariate gas sensing device for atmospheric pollution
measurement. In Elsevier Sensors and Actuators B:
Chemical, 2006.
[17] A. Kansal, M. Goraczko, and F. Zhao. Building a sensor
network of mobile phones. In ACM/IEEE IPSN, 2007.
[18] M. Keller and J. Beutel. Demo abstract: Efficient data
retrieval for interactive browsing of large sensor network
data sets. In ACM/IEEE IPSN, 2011.
[19] T. Lai, C. Lin, Y. Su, and H. Chu. BikeTrack: Tracking
stolen bikes through everyday mobile phones and
participatory sensing. In ACM PhoneSense, 2011.
[20] D. Mage, G. Ozolins, P. Peterson, A. Webster, R. Orthofer,
V. Vandeweerd, and M. Gwynne. Urban air pollution in
megacities of the world. In Elsevier Atmospheric
Environment, 1996.
[21] E. Miluzzo, N. D. Lane, A. T. Campbell, and
R. Olfati-Saber. CaliBree: A self-calibration system for
mobile sensor networks. In IEEE DCOSS, 2008.
[22] E. Miluzzo, N. D. Lane, K. Fodor, R. Peterson, H. Lu,
M. Musolesi, S. B. Eisenman, X. Zheng, and A. T.
Campbell. Sensing meets mobile social networks: the
design, implementation and evaluation of the cenceme
application. In ACM SenSys, 2008.
[23] P. Mohan, V. N. Padmanbhan, and R. Ramjee. Nericell:
Rich monitoring of road and traffic conditions using mobile
smartphones. In ACM SenSys, 2008.
[24] K. Rachuri, M. Musolesi, C. Mascolo, P. Rentfrow,
C. Longworth, and A. Aucinas. EmotionSense: a mobile
phones based adaptive platform for experimental social
psychology research. In ACM UbiComp, 2010.
[25] M. Stevens and E. D’Hondt. Crowdsourcing of pollution
data using smartphones. In Workshop on Ubiquitous
Crowdsourcing, 2010.
[26] W. Tsujita, A. Yoshino, H. Ishida, and T. Moriizumi. Gas
sensor network for air-pollution monitoring. In Elsevier
Sensors and Actuators B: Chemical, 2005.
[27] S. Vardoulakis, B. Fisher, K. Pericleous, and
N. Gonzalez-Flesca. Modelling air quality in street canyons:
a review. In Elsevier Atmospheric Environment, 2003.
[28] N. Yamazoe and N. Miura. Development of gas sensors for
environmental protection. In IEEE CPMT, 1995.