Tài liệu MEASUREMENTS OF OUTDOOR AIR POLLUTION FROM SECONDHAND SMOKE ON THE UMBC CAMPUS pdf
Bạn đang xem bản rút gọn của tài liệu. Xem và tải ngay bản đầy đủ của tài liệu tại đây (846.29 KB, 10 trang )
MEASUREMENTS OF OUTDOOR AIR POLLUTION
FROM SECONDHAND SMOKE ON THE UMBC CAMPUS
James Repace, MSc.
Repace Associates, Inc.
101 Felicia Lane
Bowie, MD 20720
www.repace.com
June 1, 2005
Introduction.
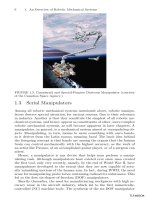
Individual cigarettes are point sources of air pollution; smoking in groups
becomes an area source. Outdoor air pollutants from individual point sources are subject
to plume rise if the temperature of the smoke plume is hotter than the surrounding air;
however if the plume has a small cross-section, as for a cigarette, it will rapidly cool and
lose its upward momentum, and then will subside as the combustion particles and gases
are heavier than air. Thus, in the case of no wind, the cigarette plume will rise to a
certain height and then descend, and for a group of smokers, for example sitting in an
outdoor cafe, on a hospital patio, or in stadium seats, their smoke will tend to saturate the
local area with secondhand smoke (SHS). In the case where there is wind, the amount of
thermally-induced plume rise is inversely proportional to the wind velocity
doubling the wind velocity will halve the plume rise. In this case, the cigarette plume
will resemble a cone tilted at an angle to the vertical. The width of the cone and its angle
with the ground will depend upon the wind velocity: a higher wind will create a
more horizontal but wider cone (due to increased turbulence), with uncertain impact on
exposure to SHS for downwind nonsmokers. If there are multiple cigarette sources,
the downwind concentrations will consist of multiple intersecting cones, i.e., overlapping
plumes. As the wind direction changes, SHS pollution will be spread in various
directions, fumigating downwind nonsmokers.
SHS contains a large quantity of respirable particles, which can cause breathing
difficulty for those with chronic respiratory diseases or trigger an asthmatic attack in
those with disabling asthma. For the remainder of nonsmokers, Junker et al. report eye,
nasal and throat irritation thresholds for 24 healthy young adult females for repeated
exposures over the course of 2 hours, corresponding to an SHS-PM
2.5
concentration of
about 4.4 micrograms per cubic meter (µg/m
3
) (Junker, 2001).
Very few published data are available on outdoor levels of SHS. A California Air
Resources Board study (CARB, 2003), measured 1 and 8 hour time-weighted average
nicotine concentrations outside an airport, college, government center, office complex,
and amusement park, found that at these typical outdoor locations, Californians may be
exposed to SHS levels previously associated only with indoor SHS concentrations.
Concentrations were strongly affected by counts of the number of smokers and
moderately affected by the size of the smoking area and the measured wind speed. The
CARB study indicated that outdoor SHS concentrations are detectable and sometimes
comparable to indoor concentrations, and demonstrates that the number of cigarettes
being smoked (i.e., total source strength), the position of smokers relative to the receptor,
-2-
and atmospheric conditions can lead to substantial variation in average exposures.
A more recent pilot study by Klepeis, et al. (2004) reported that mean outdoor
SHS concentrations determined from field surveys of particle concentrations measured in
buildings, at outdoor patios, on airport sidewalks, and in parks and public sidewalks
during time periods spent in locations where smokers were intermittently active that
mean SHS particle concentrations in outdoor settings in some cases can be comparable to
those in indoor settings. However, mean outdoor SHS concentrations appear more
variable than indoors, because outdoor SHS does not accumulate and outdoor transient
peaks are more sensitive to source-receptor proximity and wind conditions.
Long-term means for outdoor SHS concentrations are averaged over a large
number of transient peaks, which only occur when smokers are active, whereas indoor
concentrations remain high long after cigarettes have ended, and the total dose to a
person indoors from each cigarette will be greater than for a cigarette smoked outdoors.
Klepeis, et al. (2004) found from controlled experiments that, during periods of smoking
activity outdoor SHS levels can reach mean concentrations measured indoors, using
either burning cigarettes or CO tracer gas release, and reported a decrease in mean
pollutant concentrations as a function of distance such that a doubling of distance could
result in a concentration reduction of up to 50% or more. At distances of 1-2 m from the
source, mean outdoor SHS particle concentrations declined by about 75%. Klepeis et al.
found that changing wind directions can have a large impact on outdoor SHS exposure as
demonstrated by the differences between concentrations monitored on opposite sides of
an active point source.
The plume is driven in the longitudinal direction by the wind, and in the
transverse directions by diffusion. A highly simplified expression which illustrates the
physics for the downwind concentration C on the plume line for a point source pollutant
emitted at ground level is given by: C = Q/k
y
k
z
x, where Q is the pollutant mass emission
rate, x is the longitudinal distance from the source to the receptor, and where the product
k
y
k
z
represents the diffusion constants in the transverse vertical and horizontal planes
which describe the increasing lateral spread of the pollutant concentration as it proceeds
downwind in the longitudinal direction. There are four key features of most models
which describe the dispersal of emissions from a point source at ground level:
1. The downwind concentration at any location is directly proportional to the mass
emission rate of the source.
2. The more turbulent the atmosphere, the more rapid the spread of the plume in the
direction transverse to the direction of propagation of the plume.
3. The maximum concentration at ground level is directly downwind on the plume
line, and is inversely proportional to the downwind distance from the source.
4. The maximum concentration decreases for higher wind speeds, even though on
the plume line there is no explicit dependence on wind speed, because the
diffusion constants k
y
k
z
are inversely proportional to wind speed, due to
mechanical turbulence. These empirically-determined constants also depend on
the vertical temperature gradient of the atmosphere, which determines the
-3-
temperature difference between a rising parcel of plume air and the surrounding
air. (Williamson, 1973)
Thus, for each point source, the plume concentration will increase with source strength,
and decrease with increasing distance from the source and with increasing wind speed.
However, for a very large area source, while the pollutant concentration downwind will
still decrease inversely as the wind speed, it will increase with downwind distance from
the source as the square root of distance, or if there is an atmospheric inversion, with
increase linearly with distance.
With these considerations in mind, a field study and two controlled experiments
were designed and implemented on the campus of the University of Maryland at
Baltimore’s (UMBC) Catonsville, MD campus, at the request of UMBC’s University
Health Services, to perform experiments designed to quantify secondhand smoke levels
outdoors in the vicinity of building entrances, in order to provide scientific data relating
to whether limitations on smoking in proximity to campus building entrances were
justified.
Biographical Sketch of the Principal Investigator. I am a biophysicist and an
international secondhand smoke consultant with more than 60 scientific papers published
on the hazard, exposure, dose, risk, and control of secondhand smoke. I have received the
Flight Attendant Medical Research Institute Distinguished Professor Award, the Robert
Wood Johnson Foundation Innovator Award, the Surgeon General’s Medallion, and a
Lifetime Achievement Award from the American Public Health Association. I am a
Visiting Assistant Clinical Professor at the Tufts University School of Medicine. I was a
senior policy analyst and scientist with the U.S. Environmental Protection Agency. I
served as a consultant to the Occupational Safety and Health Administration, U.S.
Department of Labor, on its proposed rule to regulate secondhand smoke and indoor air
quality. I was also a research physicist at the Naval Research Laboratory in the Ocean
Sciences and Electronics Divisions. My full CV may be viewed at www.repace.com.
The UMBC Outdoor Secondhand Smoke Studies.
Equipment and Methodology.
I deployed continuous real-time monitors for respirable particles (RSP), i.e.,
airborne particulate matter in the combustion size range below 3.5 microns in diameter
(PM
3.5
), and carcinogenic particulate polycyclic aromatic hydrocarbons (PPAH), which
are appropriate markers for secondhand smoke and its toxicity. In addition I monitored
carbon dioxide (CO
2
), carbon monoxide, temperature, and relative humidity. For SHS
tracer monitoring, I used real-time battery-powered instruments, including the active-
mode MIE personalDataRAM (pDR-1200) and the EcoChem PAS 2000CE, a real-time
respirable PPAH monitor. Outdoors, the major sources of PPAH particles are diesel
exhaust and cars with defective catalytic converters.
PPAH particles are submicron in
size, or “nanoparticles.” The calibration and deployment of these instruments is
described in Repace (2004). The monitoring instruments were synchronized to each
other and to a wrist watch. A time-activity diary was used to record location and clock-
-4-
time from the watch at that location for comparison to the RSP and PPAH data measured
at various locations on the UMBC campus in the studies described below.
Results.
On April 5
th
and 14
th
, I performed one field study and two sets of controlled
experiments, as summarized in the figures below. Figure 1 illustrates the effect of a light
and heavy breeze on a cigarette smoke plume. Figure 2 illustrates the effect of no breeze
on the cigarette plume, which rises and disperses until it cools and subsides (Repace,
2000).
cigarette plume
Effect of increased wind is to blow
the plume to a more horizontal
position, and narrow the cone
angle. Increased wind also increases
turbulence which widens
the cone
Lighter breeze
Heavier
breeze
cigarette plume
Effect of wind on a smoke plume
JL Repace, 2001
Figure 1. Plume cones in light & heavy breezes.
Figure 2. Plume rises & falls with no breeze.
Figure 3 shows a plot of the real-time data measured on the UMBC campus for RSP
(PM
3.5
) in units of micrograms per cubic meter (µg/ m
3
) on the left axis, and PPAH
concentrations in nanograms per cubic meter (ng/m
3
) on the right axis, as a function of
elapsed time in minutes (lower horizontal axis) and clock time (upper horizontal axis).
The PPAH monitor was housed in a camera bag mounted on top of a small wheeled
suitcase which housed the RSP monitor. The intakes and exhausts of the concealed
monitors were connected to the outdoor environment.
The monitors were deployed about the UMBC campus in a variety of locations on
Tuesday, April 5
th
, 2005, including indoors in the Health Services conference room,
outdoors where smokers were briefly encountered between the Mathematics and
Psychology Buildings between 12:45 and 1:00 PM, on the Commons Building Plaza near
the cafeteria entrance, and at various distances in the Plaza. A controlled experiment
using 5 smoldered cigarettes was conducted between 2:20 and 2:40, to simulate the effect
of smokers outside the cafeteria entrance to the Commons building. The smoldered
cigarettes each emit about 90% of the smoke a smoked cigarette. In all cases, the point
sources of smoking were subject to breezes blowing in various directions from West-
Southwest to North-Northwest from 3 to 7 mph. The study ended at about 3:10 PM. It is
seen that in the proximity of smokers, both RSP and PPAH peaks are elevated well above
background concentrations.
-5-
0
10
20
30
40
50
60
70
80
90
100
0
10
20
30
40
50
60
70
80
90
100
RSP
µg/m
3
0 5 10 15 20 25 30 35 40 45 50 55 60 65 70 75 80 85 90 95 100 105 110 115 120 125 130 135 140 145 150 155 160 165 170 175 180
0 5 10 15 20 25 30 35 40 45 50 55 60 65 70 75 80 85 90 95 100 105 110 115 120 125 130 135 140 145 150 155 160 165 170 175 180
UMBC RESPIRABLE PARTICLE (RSP) AND CARCINOGEN (PPAH) TIME SERIES: OUTDOOR SMOKING
PPAH
RSP
PPAH (ng/m
3
)
12:15
12:30
12:45
1:00
1:15
1:30
1:45
2:00
2:15
2:30
2:45
3:00
3:15
INDOORS
TUESDAY,
APRIL 5, 2005
ELAPSED TIME, minutes
CONTROLLED
EXPERIMENTS:
5 CAMELS
SMOLDERED
FOR ~17 MIN.
WITHIN 6 ft
4 SMOKERS
WITHIN 4-6 ft.,
OUTSIDE
CAFETERIA
ENTRANCE
COMMONS BUILDING PLAZA
OUTDOORS
1-3
SMOKERS
OUTSIDE
MATH/PSYC
BUILDING
WITHIN
10-30 ft
CLOSEST
SMOKERS
50 TO 75 ft
1-2 SMOKERS
WITHIN
15 TO 25 ft
0-2
SMOKERS
9 ft
ON
CAMPUS
RETURN
TO
HEALTH
BLDG.
HEALTH
SERVICES
CONF. ROOM
Repace Associates, Inc. 2005
RH% = 20% (SD 8%)
T
o
C = 24.7
o
C (SD 4
o
C)
Figure 3. April 5
th
field study. Winds were light 3-7 mph, blowing WSW-NNW. One indoor location
and several outdoor locations were sampled with smokers in close and distant proximity. A
controlled experiment with cigarettes located at a point source was conducted for comparison.
April 15
th
Controlled Experiments.
A series of experiments were conducted on Thursday, April 14
th
to measure the
concentration of SHS as a function of distance from the source. Based on the results of
the controlled experiment of April 5
th
, to eliminate variation in concentration due to
changes in wind direction during the time it takes to smoke a cigarette, the source was
arrayed in a ring at 8 -10 points around the compass, so that no matter which way the
wind blew, the monitors would pick up the smoke-plume. Up to 10 smokers were
recruited by UMBC Health Services, and they smoked at 3 distances as shown in
Experiments I (1-2 smokers only), III (9-10 smokers), and IV (10 smokers). Experiments
II, V, and VI were conducted with smoldered Marlboro Medium Cigarettes only for
comparison. Initially (Experiment I) 2 smokers were set up upwind of the monitors at 2
compass points. The levels are little different from 8 smoldered cigarettes at the same
distance (Experiment II). Similarly, there is little difference between 8 smoldered
cigarettes at 1.5 meters and 9.4 smokers at 2 meters. Figure 4 shows the experimental
design overlaid on the smokers sitting in chairs around the centrally-located monitor.
-6-
radius:
1.5, 2, 3,
and 5 meters
(5 to 16 ft)
RESPIRABLE
PARTICLE &
CARCINOGEN
MONITORS
WIND
MONITORS WILL PICK UP SIGNAL FROM DIRECTION OF WIND
MONITORS WILL PICK UP SIGNAL FROM DIRECTION OF WIND
N
S
W
E
NW
SW SE
NE
April 14
th
Controlled Experiment
Figure 4. Controlled experiment of April 14
th
involved simulating an area source, by locating
smokers or smoldered cigarettes on chairs in a ring around the PAH and RSP monitors. The ring
radius was started at 1.5 meters, and increased in steps to 2, 3, and 5 meters. A meter represents 3.28
feet. No matter which direction the wind blows from, the receptor will always be downwind.
Repace Associates, Inc. 2005
0
50
100
150
200
0
50
100
150
200
RESPIRABLE PARTICLES (RSP),
µ
g/m
3
0 50 100 150 200 250 300 350 400 450 500 550 600 650 700
ELAPSED TIME, 10 second intervals
UMBC OUTDOOR SMOKING EXPERIMENT: APRIL 14, 2005 - COMMONS BUILDING PLAZA
RSP
PPAH
PARTICULATE CARCINOGENS (PPAH) ng/m
3
1.8
smokers
@ 1.5
meters
8 smoldered
cigarettes
@ 1.5
meters
9.4 smokers
@ 2 meters
10 smokers
@ 3 meters
8 smoldered
cigarettes
@ 3
meters
8 smoldered
cigarettes
@ 5
meters
12:00 PM
1:00 PM
12:30 PM
1:30 PM
1:55 PM
UMBC Physics Dept. Website:
62
o
F; 30% RH; Wind 11 mph (NE);
Gusts ENE @ 1:04 PM 23 mph
0-2
smokers
@ 6 m
Expt. I
Expt. II
Expt. III
Expt. IV
Expt. V
Expt. VI
Figure 5. April 14
th
field study. The diamonds represent the PPAH data in ng/m
3
, and the circles
represent the RSP data in µg/m
3
. One indoor location and several outdoor locations were sampled
with smokers in close and distant proximity. A controlled experiment with cigarettes located at a
point source was conducted for comparison.
-7-
Figure 5 shows the data for RSP and PPAH for each of the experiments as the ring
diameter is increased. Figure 5 shows the data for each of the experiments as a function
of time, numbers of smokers or cigarettes, and ring diameter. RSP is shown on the right-
hand vertical axis, PPAH on the left-hand vertical axis, and the ring-radius (i.e., the
smoker-to-monitor distance) is shown on the horizontal axis. Figure 6 shows a plot of the
3 smoldered cigarette experiments (II, V, and VI); an approximately inverse dependence
of SHS-RSP concentration with source-receptor distance is displayed, while the PPAH
concentration decays approximately as the square of the distance. In controlled
experiments indoors, Repace (2004) observed that PPAH concentrations decreased
approximately twice as fast as SHS-RSP. Figure 7 plots all of the experiments (I-VI)
together, adding the smokers to the smoldered cigarettes. There is considerably more
scatter in the data, likely due to the more erratic pattern of smoking by real smokers than
for smoldered cigarettes. Nevertheless the same dependence with distance emerges from
the curve fits. Neither concentration appears to get close to background until a distance of
greater than 7 meters is reached.
0
5
10
15
20
25
30
35
0
5
10
15
20
25
30
35
1 2 3 4 5 6 7
UMBC2 8-SMOLDERED CIGARETTE CONTROLLED EXPERIMENT
(background-subtracted data)
PPAH smolder
RSP smolder
y = 86.001 * x^(-2.4225) R
2
= 0.99977
y = 13.127 * x^(-1.1159) R
2
= 0.88175
Particle-bound Polycyclic Aromatic Hydrocarbons, ng/m
3
Monitor-to-Cigarette Radius, meters
Est. SHS Respirable Particulate Concentration, µg/m
3
Figure 6. April 15
th
Experiment. Smoldered cigarettes (Marlboro Medium 100s, filtered) located at
8 equally spaced compass positions at ring radii 1.5, 3, and 5 meters. Curve fits to the PPAH and
RSP curves are shown, and extrapolated to 7 meters (23 feet). PPAH declines as the inverse square
of the source-receptor distance x, whereas RSP declines inversely as the distance, as expected.
-8-
0
5
10
15
20
25
30
35
0
5
10
15
20
25
30
35
1 2 3 4 5 6 7
UMBC2 SMOKED & SMOLDERED CIGARETTE CONTROLLED EXPERIMENT
(background-subtracted data)
PPAH
RSP
y = 101.67 * x^(-2.3883) R
2
= 0.76007
y = 23.394 * x^(-1.1624) R
2
= 0.10124
Particle-bound Polycyclic Aromatic Hydrocarbons, ng/m
3
Monitor-to-Cigarette Radius, meters
Est. SHS Respirable Particulate Concentration,
µ
g/m
3
Figure 7. Smoked cigarettes at 1.5, 2, and 3 meters overlayed on the smoldered cigarette plot of
figure 5 with curve fits to the combined PPAH and RSP data, extrapolated to 7 meters (23 feet).
Although there is more scatter in the data when the smokers are added, approximately the same
dependence of PPAH and RSP with distance is seen.
Discussion. What levels of SHS constitute clean air? PM
2.5
is the RSP size range
that encompasses combustion-related fine particulate by-products such as tobacco smoke,
chimney smoke, and diesel exhaust. PM
2.5
is legally regulated in the outdoor air. In
1997, the EPA promulgated a 24-hour U.S. Annual National Ambient Air Quality
Standard (NAAQS) for RSP for particulate matter PM
2.5
. The NAAQS for PM
2.5
of 65
µg/m
3
, also limited by an annually averaged NAAQS for PM
2.5
of 15 µg/m
3
, based on
protecting human health. The NAAQS for PM
2.5
is designed to protect against such
respirable particle health effects as premature death, increased hospital admissions, and
emergency room visits (primarily the elderly and individuals with cardiopulmonary
disease); increased respiratory symptoms and disease (children and individuals with
cardiopulmonary disease); decreased lung function (particularly in children and
individuals with asthma); and against alterations in lung tissue and structure and in
respiratory tract defense mechanisms in all persons. PM
2.5
and PM
3.5
(measured in this
study) are closely-related RSP fractions, especially for the submicron SHS aerosol. Table
I shows the federal Air Quality Index and the associated color-coded advisories.
-9-
While these have averaging times associated with them, the levels may be used to
infer whether a given peak in figures 2 and 4 represent high or low levels of pollution.
Each of these figures shows levels as high as 100 to 150 µg/m
3
outdoors in proximity to
smokers, indicating that the air is in the unhealthy or Code Red range. Moreover,
secondhand smoke causes a number of acute symptoms (eye, nose, and throat irritation,
headaches, dizziness, and nausea) and chronic diseases (lung and nasal sinus cancer and
heart disease) (CARB, 2003). Levels of irritation begin as low as 4 µg/m
3
SHS-RSP and
levels of odor detection are as low as 1 µg/m
3
(Junker et al. 2001). Thus SHS odor
would be detectable in our experiments as far as 7 meters from the source, and levels of
irritation would begin at 4 meters from the source.
As for the PPAH carcinogens, Figures 2 through 6 show clearly that for this
pollutant, levels close to smokers are elevated above background by up to 2 orders of
magnitude (a factor of 100), relative to distances beyond 7 meters. Thus, it is clear that
tobacco smoke pollution outdoors at significant distances from smokers must be
considered as significantly unhealthy. Thus, while students or faculty asthmatics pass
through a cloud of smoke, levels might be sufficient to trigger an attack, and certainly are
high enough to pose a nuisance to all. Moreover, smoking in proximity to doorways or
air intakes might easily be inducted into the building through posing both acute and
chronic threats to building occupants.
Table 1. Levels of fine particulate (PM
2.5
) air pollution and corresponding federal
health advisory descriptors with accompanying simplified color code (US EPA,
1999).
PM
2.5
(µg/m
3
) AQI
Break-points
Air Quality Index
Category
Color Code
0.0 - 15.4
0 - 50
Good
Green
15.5- 40.4
51 - 100
Moderate
Yellow
40.5 - 65.4
101 -150
Unhealthy SG*
Orange
65.5 - 150.4
151 - 200
Unhealthy
Red
150.5 - 250.4
201 - 300
Very unhealthy
Violet
250.5 - 350.4
301 - 400
Hazardous
Maroon
350.5 - 500.4
401- 500
Very Hazardous
Maroon
> 505
500
(Significant Harm)**
*SG = sensitive groups; **exists, but is not a part of the AQI. Source U.S. EPA, 1999.
[GUIDELINE FOR REPORTING OF DAILY AIR QUALITY - AIR QUALITY INDEX (AQI) United
States Office of Air Quality EPA-454/R-99-010 Environmental Protection Planning and Standards July
1999 Agency Research Triangle Park, NC 27711].
Conclusions.
These experiments dispel the common misconception that smoking outdoors can
be ignored because smoke plumes immediately dissipate into the environment. These
controlled experiments with and without smokers show similar results: if a receptor such
as a doorway, air intake, or an individual is surrounded by an area source – and this
would include an entranceway with a group of smokers standing nearby – then regardless
of which way the wind blows, the receptor is always downwind from the source.
Cigarette smoke RSP concentrations decline approximately inversely with distance
downwind from the point source, as expected, whereas cigarette smoke PPAH
concentrations decline faster, at approximately inversely as the square of this distance.
-10-
Based on these measurements, which involve a single ring of cigarettes or
smokers, the smoke levels do not approach background levels for fine particles or
carcinogens until about 7 meters or 23 feet from the source, which is likely to be the
smoke from no more than 1 or 2 smokers. Greater numbers of smokers in the area could
lead to higher concentrations. because a crowd of smokers constitute an area source,
whose plumes may overlap downwind, potentially causing smoke concentrations to
increase locally before dissipating at greater distances. Secondhand smoke causes a
number of acute symptoms (eye, nose, and throat irritation, headaches, dizziness, and
nausea) and chronic diseases (lung and nasal sinus cancer and heart disease). Students or
faculty passing through the cloud of smoke would encounter detectable levels at about 7
meters (23 feet) from a smoker, and irritating levels at 4 meters (13 feet). Moreover,
smokers in proximity to a doorway as persons enter or depart, may result in smoke being
inducted into the building, posing a chronic threat as well as an acute one, to building
occupants. Therefore it makes sense to post signs warning smokers not to smoke closer
than about 20 feet from building entrances, and to place ashtrays at that distance and no
closer. Moreover, because some persons suffer from severe asthma, and secondhand
smoke is a known asthmatic trigger, this is another good reason to keep smokers from
congregating closer to building entrances than 20 feet.
References.
CARB (2003) "Technical Support Document for the Proposed Identification of
Environmental Tobacco Smoke as a Toxic Air Contaminant: Part A," Technical Report.
California Environmental Protection Agency, California Air Resources Board, Office of
Environmental Health Hazard Assessment, Chapter 5, pp. V6-V19.
Junker MH, Danuser B, Monn C, Koller T. Acute sensory responses of nonsmokers at
very low environmental tobacco smoke concentrations in controlled laboratory settings.
Environ Health Perspect 2001 Oct;109(10):1045-52.
Klepeis NE, Ott WR, Switzer P. Real-Time Monitoring of Outdoor Environmental
Tobacco Smoke Concentrations: A Pilot Study. Stanford University Department of
Statistics, Sequoia Hall, Stanford, California 94305-4065. University of California, San
Francisco Contract Number 3317SC, March 1, 2004
Repace JL. Banning outdoor smoking is scientifically justifiable. (Invited review)
Tobacco Control 9:98 (2000).
Repace JL. Respirable Particles and Carcinogens in the Air of Delaware Hospitality
Venues Before and After a Smoking Ban. Journal of Occupational and Environmental
Medicine, 46:887-905 (2004).
Williamson SJ. Fundamentals of Air Pollution. Addison-Wesley, Reading MA, 1973.