Tài liệu JISC: Learned Society Open Access Business Models ppt
Bạn đang xem bản rút gọn của tài liệu. Xem và tải ngay bản đầy đủ của tài liệu tại đây (1.8 MB, 83 trang )
CONFIDENTIAL
JISC: Learned Society Open Access Business Models
By
Mary Waltham
www.MaryWaltham.com
184 Springdale Road
Princeton
NJ 08540
USA
e-mail:
June 2005 CONFIDENTIAL
CONFIDENTIAL www.MaryWaltham.com
CONFIDENTIAL
Contents Page
1. Executive summary 1
2. Methodology and overview of the publishers in the study 4
3. Circulation patterns 6
• Print and online trends 6
• Subscribers
8
• Members 8
o Print and Online
• Institutions
9
o Print and Online
• Non-Member individuals
10
o Print and Online
4. The journals business 12
• What are the costs? 12
• Trends in cost categories 2002-2004
17
• Where do the journal revenues come from?
21
• Surplus 23
5. Open Access experiments 25
• What have we learned from the experiments so far? 25
• Is the Open Access model sustainable?
27
6. Steps towards Open Access 29
• Delayed Open Access 29
• Hybrid Open Access 30
o What if each of these publishers wanted to make a transition?
• Removing print
47
7. Conclusions and recommendations
48
Appendices
Appendix 1: Information gathering tools 51
• Authors and readers template
52
• Profit and Loss template
53
Appendix 2: Case Studies of 9 learned society publishers
56
• Publisher A:
• Publisher B:
• Publisher C:
• Publisher D:
• Publisher E:
• Publisher F:
• Publisher G:
• Publisher H:
• Publisher I:
CONFIDENTIAL www.MaryWaltham.com
CONFIDENTIAL
1. Executive Summary
• The annual world production of research results as peer-reviewed published
articles is increasing from the level estimated to be 1.2 million articles in 2003,
driven by growth in global research funding and in certain disciplines the
tendency to produce many more articles to describe one substantive research
finding (the least publishable unit {LPU} problem).
• Individual journal pricing and annual price increases have been driven by a
number of economic factors including the increasing numbers of articles and
pages published. The selection and production of more edited content drives up
the cost of both print and online versions of scholarly journals.
• Higher education is not in a position to provide the injection of funds required to
pay for increased print and online publishing costs as the volume of the research
literature grows.
• For these reasons alternative models for publishing peer-reviewed research are
required since existing business models for the scholarly communications system
which rely most heavily on subscription fees paid by institutions are becoming
unsustainable.
• Open Access
1
business models have been widely promoted within the scholarly
publishing community as the basis for transforming and resolving the funding
problems of the communication of research, however precise data on revenues
and costs of publishing peer-reviewed journals in print and online have been
difficult to access.
• Estimates of the cost per article for publication vary widely with sketchy or
incomplete data to support figures proposed and poor definition of which
elements of the publishing process are to be covered by OA author fees, for
example. The average cost to publish an article will depend on a number of
factors, which have not been addressed in much of the literature on the topic.
These include the overall rejection rate- the higher the rate the higher the cost
per published article. Length of article – long articles cost more to publish than
short articles since content creation costs are driven by volume of content
processed. The number and complexity of figures and illustrations and the
amount of colour- the more of any of these in general the more expensive the
article.
• The focus of this study is an in-depth exploration of nine learned society journal
business and pricing models in the context of their societies and the Open Access
business model (See Section 2
). Eight of the publishers are based in the UK and
one in the USA. The study considers whether and how OA can be adapted by the
representative sample of STM publishers who agreed to participate in the study
by providing full circulation, revenue and cost data for 2002-2004 inclusive.
• Circulation data (See Section 3
) for the three year period 2002-2004 provided
by the nine participating publishers shows that bundled subscriptions of print and
online accounted for 29% of total circulation and 75% of revenue in 2004. Print
subscription numbers fell by 43%. Online only subscriptions also fell by 6% but
1
Throughout this report Open Access is used to refer only to the situation where the
author pays the publisher a fee on acceptance of an article to cover the costs of
publication. There is no subscriber access control of the journal article and on
publication the article is available free of charge online to anyone.
CONFIDENTIAL www.MaryWaltham.com
2
CONFIDENTIAL
the notion of a single online subscription is artificial given that many of the
publishers are selling site wide licenses to use their online journals.
• Society member subscriptions, which account for two thirds of all subscribers, fell
by 3% but revenue was up by 6%. Institutional subscriptions, which account for
one third of all subscribers, fell by 22% but revenue was up by 9%. Revenue
from non-Member individual or personal subscriptions, which account for 2% of
subscribers, fell dramatically by 70% over the period 2002-2004.
• Article submissions to the journals combined increased by 35% and the number
of articles published by 25%. Total pages published for the 10 journals where
three consecutive years of complete data were available increased by 33% from
2002 to 2004
• The average cost per article for print and online publication (See Section 4)
for
all 13 journals in 2004 was £1,447 and per page was £144 but this average
covers a broad range including one journal that is online only.
• The life sciences journals included in the study were publishing more and shorter
articles than the physical sciences and technology journals, and these broad
differences have a significant impact on the “cost per article” which will vary by
discipline, by journal type and by editorial policy.
• Fixed costs of publishing the journals increased throughout the period. Variable
costs of print manufacturing fell modestly but print distribution and fulfilment
costs increased to more than offset this. Over the period under review the
revenue, costs and margin per page fell.
• Subscription revenue (See Section 4
) accounts for 88-89% of revenue to the 10
journals over the period 2002-2004 and this proportion is even higher if the two
US journals with author page charges are removed. Some 32% of the total
revenue for the two US journals combined comes from author payments which is
fairly typical of a US society journal.
• Institutional subscription revenue accounts for 97-98% of total subscription
revenue to the 10 journals reviewed 2002-2004, and 86-87% of the total journal
revenues. There is heavy reliance on institutional subscriptions which for all but
one journal fell in number through this period.
• Average revenue per article for all 13 journals in 2004 was £1,918 and per page
was £194.
• Net surplus/loss generated by each of the journals (See Section 4
) varied from
a surplus of 62% (£268,000) to a loss of £161,000 in 2004. The average net
surplus of 22% masks a wide divergence in business performance.
• A brief review of recent and current OA experiments (see Section 5
) is included
with some comments on what may prove to be emerging trends by discipline
(biomedicine versus chemistry) by richness of research funding source
(biomedicine versus ecology and environmental sciences) and by increased
online access to ‘good enough’ versions of research through pre-print and
institutional repositories.
• The key requirements for a society journal business model to be financially
sustainable are identified. These include covering costs and returning a modest
surplus to re-invest in innovation and ongoing support structures such as new
content and functionality, and archiving of existing content. The OA model as
currently construed is unlikely to meet all of these needs.
CONFIDENTIAL www.MaryWaltham.com
3
CONFIDENTIAL
• From the results reported by publishers across STM publishing including the
exclusively OA publishers, there is not yet a strong and positive ‘pull’ from the
author community for OA of their articles despite increased financial support
from funding agencies. Such a change may take a long time. Nevertheless a
market is emerging for the price of publishing an article OA within existing (and
newly launched) journals with OA fees ranging from $500 to $3,000 per article.
• Generic steps in considering a transition towards OA are presented (see Section
6). Key considerations and possible actions at the individual journal level are
proposed based on the detailed information provided by the publishers who
agreed to participate in the study.
• Opinions have been expressed that removing print would lower the costs of the
OA business model (and publication costs in general). Naturally this is true but
analysis of the purely print revenues and costs across 12 journals (see Section
6) included in the study show that revenues would fall more than costs and as a
result publishing surplus would fall based on 2004 figures if print subscriptions
no longer existed.
• If the variable costs of print are subtracted from 2004 costs then the average
publishing cost per article falls to £956 and per page to £97. Averages cover a
broad range across the journals analysed.
• Conclusions and recommendations arising from the results of the study are
included as Section 7
.
• Appendix 1
includes tools that publishers may find helpful in analysing
information about their journals as they consider a transition to OA or more
broadly the print to online transition that is underway.
• Appendix 2
includes brief Case Studies of each of the nine publishers who
participated in the study.
CONFIDENTIAL www.MaryWaltham.com
4
CONFIDENTIAL
2. Methodology and overview of the publishers in the study
Nine learned society publishers agreed to take part in this study by responding to an
invitation posted on two key list-servs as follows:
“JISC wishes to elucidate in detail if and how learned society publishers can consider
making a transition to a sustainable open access business model, and what the funding
sources and requirements would need to be in order to do so. JISC is seeking UK-based
societies to participate in a Business Model study by providing information which will be
used in complete confidence to develop a number of case s udies.”
t
t r
In subsequent communication by e-mail and by telephone to find out if participation
would be possible to the timescale required for this study all of the publishers were
assured that:
“All of the information you provide will be held in complete confidence and not divulged
to JISC. The publishers involved in this study will not be identified publicly and care will
be taken to ensure tha the identity of the journals on which the cases a e based cannot
be deduced.”
As a result the numbering system used to identify publishers in this report is deliberately
inconsistent; only the participating publishers themselves will know which columns of
figures and case studies refer to their own journals.
Eight of the publishers were based in the UK and one in the USA. In total these
publishers provided detailed circulation and profit and loss information about 13
journals. One journal is fully Open Access (producer pays) and so no circulation figures
are included and two publishers of the nine were unable to provide the full three years
of profit and loss data as requested.
All of the publishers can be described as not-for-profit and all use the surplus generated
by publishing to support other activities central to their mission as a learned society.
The nine publishers account for the circulation, revenue and costs of their journals in
quite different versions. In order to compare the overall changes taking place over the
past 3 complete fiscal years it was essential to establish a common approach and so
publishers were asked to supply information about one or more of their journals within
two templates (see Appendix 1
):
• Authors and Readers
• Profit and Loss
In addition face-to-face interviews were conducted with each of the publishers during
April and May 2005 and the responses to those interviews in combination with the
completed templates were used to develop a case study for each publisher, which is
included as Appendix 2.
Interviews also provided an opportunity to talk through and
clarify the information provided by the publisher.
CONFIDENTIAL www.MaryWaltham.com
5
CONFIDENTIAL
The nine study participants are active in the following areas of STM publishing:
Clinical medicine: 2 publishers
Biomedicine: 1 publisher
Applied Biology: 2 publishers
Science: 1 publisher
Technology: 2 publishers
Plus one publisher active in both the life and physical sciences.
About the sample of journals
Frequency
Number of journals
24 x year 1
12 x year 9
6 x year 2
4 x year 1
The content published varied as would be expected across traditional STM areas with
some journals including extensive mathematical setting, numerous graphs and charts
and very little colour and others frequently including illustrations such as half-tone
photomicrographs or four colour histopathology figures.
Length of article also varied by broad discipline (see Table 4.3) and within the
“Information for Authors” for each journal, maximum and optimal article lengths are
provided by the publishers.
One of the journals is already fully OA, and one has been experimenting with a hybrid
OA model where if authors wish to pay a fee their article is OA from the date of
publication. Several of the other participants are interested in experimenting although
justified nervousness about the impact of such an experiment on overall business
performance is likely to lead to more cautious experimentation with small and less
critical journals.
Four of the 13 journals publish considerable numbers of pages of specially
commissioned review and commentary about current research topics. The remaining
nine journals are more typically ‘learned journals’ in content and presentation with little
or no context or interpretation of the research provided explicitly for readers.
CONFIDENTIAL www.MaryWaltham.com
6
CONFIDENTIAL
3. Circulation patterns
Circulation data by subscriber category was available for 12 journals from 8 publishers.
Overview of circulation and pricing patterns
Feature: The number of publishers with:- N= 8
falling Member print subscriptions 8
online available to Members or individual
subscribers
3
increasing Member online subscriptions 0
falling institutional print subscriptions 4 out of 4 offering print only subs
increasing institutional online subscriptions 3 out of 4 offering online only subs
unbundled pricing 2002-2004 4
only bundled pricing 2002-2004 4
site licenses 7
Print and online trends
Publishers varied in their subscription offerings over the three year period reviewed-
some offering online only, some print
or
online and some print
and
online (bundled
subscription). All of the publishers were producing online versions of the journals
surveyed throughout the three-year period 2003-2004 and many have been full text
online since the mid-1990’s. Pricing models changed during the three years as did
purchasing behaviours as is clear from changes in circulation by version and by
customer segment described in this section.
• Print only subscription numbers (including Members) to the 12 journals for which
the complete three years of circulation data was available fell by 2,970 or 43%
between the end of 2002 and 2004.
• Online only subscription numbers fell by 1,070 or 6% between the end of 2002
and 2004.
• Print and online (bundled) subscription numbers fell by 4% from 2002 to the end
of 2004. In the UK and Europe the shift to unbundled pricing is being hampered
by Value Added Tax (VAT) which is payable at 17.5% on online subscriptions
sold separately from print. Several publishers viewed this additional tax as a
limiting factor in their switch to online only subscriptions and feel that VAT
effectively removes a large proportion of the cost savings that would be available
to institutions if they could purchase online only since VAT cannot be reclaimed
by these institutions. For the US publisher this is not an issue at the individual
publisher level and they have been selling unbundled online only access through
two aggregators throughout the three years.
• Site license numbers certainly grew through the period, but most of these
learned society publishers have limited sales and marketing resources of their
own and so site license sales are handled by a third party, either a publishing
partner or through agreements such as the ALPSP Learned Journal Collection
which is being sold by the subscription agent SWETS. Exact numbers of site
licensees were often not provided by the publisher as they may see these
incorporated within the total online subscription number reports provided or
simply have the name of consortia, which comprise many institutions served with
a journals collection.
CONFIDENTIAL www.MaryWaltham.com
7
CONFIDENTIAL
My impression is that the subscription pricing models for this sample of publishers often
did not reflect the added value and usage of an online site license because many priced
a license at the same price as a single online institutional subscription and this price was
in turn always based on the single subscription print price.
Subscribers
Members
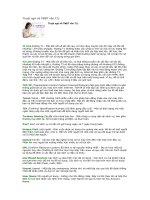
Chart 3.1: Total Member subscriptions by version: 2002-2004 (12 journals)
0
5000
10000
15000
20000
Number of subscribers
2174 1999 1792
Online
13938 13621 13801
Both
1740 1831 2115
Tot al
17852 17451 17708
2002 2003 2004
Member subscriptions account for almost two thirds of all subscriptions in terms of
numbers for the publishers. However there is a sharp difference between the UK and US
publishers with respect to policies on Member subscriptions. Of the 17,289 Member
subscribers in 2004, 13,616 (78% of the total Member subs) are to the two US journals.
Members of the US society received an online subscription as part of their Membership
throughout the period with no additional payment due; in addition a print subscription is
available at a very low Member price. In the UK all but one society publisher requires an
additional separate payment for a Member to receive a journal subscription whether it is
print or online, and this clearly affects total Member subscription numbers. See Table
3.2.
Table 3.2: Member subscriptions by country- 12 journals
Country of publisher End 2002 End 2004 Change % Change
US (2 journals)
14,250 13,616 -634 -4.4%
UK (10 journals)
3,602 3,673 +71 +2%
Total
17,852 17,289 -563 -3%
In 2004, Members accounted for 2% of the total subscription revenue received but were
63% of the total number of subscriptions fulfilled. The result is a clear imbalance
between revenue and costs of this subscriber segment. Several of the UK publishers
have recently started to offer online only subscriptions to Members often at a substantial
discount as part of their strategy to convert Members to online only access.
Member print copies fell by just 382 or 18% over the three years, while online only
subscriptions offered by just 3 publishers remained fairly flat down by just 137 (- 1%).
CONFIDENTIAL www.MaryWaltham.com
8
CONFIDENTIAL
Combined print and online subscriptions for Members grew by 375 (+22%) with losses
in this category by the US publisher being more than offset by gains from the UK
publishers.
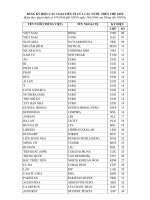
Institutions
Institutional subscriptions represent one third of all the subscriptions sold to the 12
journals whose business model includes subscription-controlled access. Institutional
subscription revenues provided 97% of total subscription revenues in 2004. The pattern
of change for all the institutional subscriptions to the 12 journals is shown in Chart 3.3
.
Chart 3.3: Total Institutional subscriptions 2002-2004 by version: (12 journals)
0
2000
4000
6000
8000
10000
12000
14000
Number of subscribers
4603 2863 2031
Online
1721 2247 2124
Print + Online
6323 6025 5723
Total Institutional subs
12647 11135 9878
2002 2003 2004
All versions of institutional subscriptions fell to account for the steep 22% drop overall.
The steepest was institutional print subscriptions, which fell by 2,031 (56%).
Of course it is impossible to consider individual subscription counts by institution as a
measure of access when most of the publishers offer site-wide access to the online
version. Adding in the number of site licenses sold would show an increase in the
numbers of institutions this group of publishers are reaching. Not all the publishers are
offering site licenses and several were not sure to what extent individual institutional
subscription sales are being cannibalized by sub-licensed third party aggregator sales of
online access to individual institutions and to consortia.
Four of the publishers were offering online only subscriptions and these increased by
403 (23%) in the three years. Although all of these publishers are experiencing a
downward trend in their overall institutional subscription numbers, for a sub-set this was
especially marked, notably in the life sciences. In contrast one technology society
CONFIDENTIAL www.MaryWaltham.com
9
CONFIDENTIAL
publisher has been developing their international sales to institutions and recorded a 7%
growth in institutional subscription numbers over the three years.
Table 3.4
compares changes in institutional subscriber numbers for the 10 UK based
journals with the two US based journals where overall the loss has been less steep.
Table 3.4: Institutional subscriptions by country
Country of
publisher
End 2002 End 2004 Change % Change
US (2 journals)
1108 1029 -79 -7%
UK (10 journals)
12,330 8,251 -4,079 -33%
Total
13,438 9,280 -4158 -31%
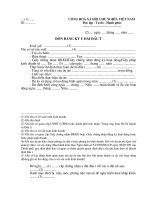
Non-Member individuals
Just 4 of the 8 publishers offered Non-Member individual or personal subscriptions and
this category represented just 2% of the total paid subscriptions in 2004. Typically a
learned society may not offer this price category preferring to focus on recruiting
Members and offering them discounted subscriptions as a benefit of Membership. Non-
Member individual subscription numbers fell dramatically (minus 70%) as shown in
Chart 3.5
. Three of the publishers offered online only to Non-Member individual
subscribers through the period.
Chart 3.5: Total Non-Member individual subscriber numbers 2002 to 2004 by version: 12
journals
0
500
1000
1500
2000
2500
Number of subscribers
111 92 95
Online
1646 1860 310
Both
307 318 220
Total
2064 2270 625
2002 2003 2004
Background
A steady fall in the numbers of print subscriptions to all journals has been taking place in
the past 25 years and most steeply in the past 5 years. The reasons for this are
numerous but include:
CONFIDENTIAL www.MaryWaltham.com
10
CONFIDENTIAL
• Increasing
price
of periodical subscriptions particularly to institutions.
• Increasing
numbe s
of journals with more “twigging” into specialist fields where the
potential number of subscribers is often small.
r
r r t
•
Fewer non-Membe personal subsc ip ions
since these subscribers are most sensitive
to pricing and most affected by the increase in publication prices and now also have
more widespread online institutional access.
• Increasing
availability of online versions
of print journals that because they are
immediate, searchable, and linked into other relevant online information sources
result in productivity gains for the end user.
• Libraries cancelling multiple print copies with the growth of online access.
• Libraries adopting a policy of online only if print and online are available, due both to
budgetary restraints and user preference, especially in science.
The current rate of attrition in periodicals subscriptions year on year is in the range of
3% to 5%. Many large publishers often actively promote more dramatic swings as they
make all their information available online at an institutional price that favours
purchasing the entire database versus individual titles. The current trend, which is also
driven by budget shortages, is for more customized groupings of titles rather than the
entire collection. However, researchers working within any institution, whether
academic, corporate or government lab, are now able to access all the information they
may have considered buying in print for themselves, through their library network.
CONFIDENTIAL www.MaryWaltham.com
11
CONFIDENTIAL
4. The journals business
What are the costs?
Publishing costs can be divided into two component categories:
fixed
costs that are
incurred regardless of the number of subscribers and
variable
costs that are associated
with each subscription.
Fixed costs
involve both content creation and publishing support activities:
• Content creation
costs are all the costs associated with preparing the editorial
content for publication. It includes the editorial office costs of salaries and space and
reviewing, editing, SGML/HTML/XML coding and composition of both articles and
non-article content such as letters to the editor, book reviews and advertising all in
preparation for print and online distribution.
• Publishing support
activities are journal costs such as marketing, advertising sales,
finance, and administration, including management costs and the office costs of
these activities.
Variable costs
include
• Manufacturing
and paper, printing, and binding. Production of the online version
including re-packaging of content.
• Distribution
costs of the physical publication or as an online product. Order fulfilment
- subscriber file maintenance and customer service for all subscriber types.
For reference
Incremen al costs
(or run-on costs) are those just attributable to each
additional subscription – such as the printing, distribution, and subscriber file
maintenance of one subscription. Societies often price their Member copies based on
incremental or run-on costs.
t
The costs for all the journals included in the study have been sorted as accurately as
possible from the data supplied by the publishers according to these fixed and variable
categories.
Note: One of the journals included is fully Open Access and online only and so there are
no print manufacturing, production or order fulfilment costs incurred. Two of the
publishers of two of the 13 journals were either unable to provide the full three years of
data or to separate content creation costs from manufacturing and production costs.
These two journals were therefore excluded from all the year on year cost (and
revenue) comparisons in the report. To make the cost analysis clear the number of
journals included in each part is provided here.
CONFIDENTIAL www.MaryWaltham.com
12
CONFIDENTIAL
Table 4.1: Total fixed and variable costs in 2004: All journals
2004: Costs in
£,000 to nearest
£1,000 Total Ave
Publisher 3 3 3 3 4 5 6 7 8 9 1 2 2
Frequency 12 x 12 x 12 x 24 x 12 x 4 x 12 x 12 x 12 x 24 x 6 x 6 x
Content creation 118 114 133 207 31 82 73 113 196 428 78 47 1,620 135
Manf & Prod
PRINT 89 115 79 162 65
online
only 31 125 80 418 8 25 1,197 100
Manf & Prod
ONLINE
2
n/a n/a n/a n/a 5 19 n/a 12 6 65 5 5 117 10
Distribution &
Fulfilment PRINT 30 33 39 76 23
online
only 15 77 61 161 18 10 543 45
Distribution &
Fulfilment
ONLINE
6 7 8 11 8 7 0 n/a 11 n/a 4 4 66.3 6
Publishing
Support
81 83 145 118 63 132 48 216 62 126 31 22 1,127 94
Total Costs 324 352 404 574 195 240 64 167 543 416 1198 144 113 4,734 364
Articles
published
155 182 181 507 140 203 66 129 317 233 631 292 165 3201 246
Cost/article (£) £2,090 £1,934 £2,232 £1,132 £1,393 £1,182 £970 £1,297 £1,713£1,785 £1,899 £493 £685 18,805 £1,447
Pages
published 2,788 1,871 3,611 2,944 1,632 3,695 912 1,593 1,511 2,048 6,546 2,220 1,212 32,583 2,506
Cost/page (£) £116 £188 £112 £195 £119 £65 £70 £105 £359 £203 £183 £65 £93 £1,874 £144
Table 4.1
shows total fixed and variable costs by publisher with publisher names
replaced by numbers for anonymity.
Notice the cost/journal/year in 2004 which ranges from £64,000 for a quarterly journal
from publisher 6 with a total print circulation of 700 of which 91% are industry
sponsored subscriptions, to £1.2 million for a journal from publisher 1 publishing just
under 1,000 print copies and publishing over 6,500 pages per year in 24 issues per year.
Analysis of these actual cost figures based on pages published shows a range of from
£65 per page for an online only journal to £359 per page for a print and online journal.
From this data the cost per article and cost per page appear also to be driven by journal
frequency because the quarterly and bimonthly titles have among the lowest total per
article and per page costs.
The variable costs of print as defined at the beginning of this section are shown for 11
of these journals in Table 4.2
.
2
n/a= separate costs not available - included within other lines
CONFIDENTIAL www.MaryWaltham.com
13
CONFIDENTIAL
Table 4.2: Variable costs of print manufacturing and production; distribution and fulfilment
per article and per page in 2004 for 11 journals (£)
Publisher V V V IV VII VIII X III VI V X Ave
Manf/prod/article
574 632 320 394 343
662
27 240 464 436 152 386
Print Dist
/fulfil/article
194 181 150 243
262
255 62 116 164 215 61 173
Total Print Manf &
Dist/article 768
813 469 637 605 918 89 357 629 652 212 559
Manf/prod/page
32 61 55 83 39
64
4 19 40 22 21 40
Print Dist
/fulfil/page
11 18 26 51
30
25 8 9 14 11 8 19
Total Print Manf &
Dist/page
43
79 81 134 69 88 12 29 54 33 29 59
In order to assess whether there may be different costs for the journals based on broad
discipline, the journal cost categories were sorted into life sciences and physical sciences
and technology and these are shown in Table 4.3.
Table 4.3: Total fixed and variable costs life sciences journals and physical sciences
journals in 2004 for 12 journals
Life Sciences (£)
% Total Phys Sci + tech (£) % Total
n=7 n=5
Content creation 1,183
35
437
33
Manf & prod PRINT 933
28
264
20
Manf &Prod ONLINE 93
3
24
2
Distribution and
Fulfilment PRINT 436
13
107
8
Distribution and
Fulfilment ONLINE
37
1
29
2
Publishing Support 658
20
469
35
Total Costs
3,340
100
1,330
100
Articles published
2,327 808
Cost/article
1,435 1,646
Pages published
18,352 13,319
Cost/page
182 100
The total number of articles published in the 7 life science journals well exceeds those in
physical sciences and the cost per article is lower for life sciences than physical sciences.
The reason for this lies in the cost per page data where the reverse is true reflecting the
longer articles published in this group of physical science and technology journals
(average 16pp/article) compared to the life sciences group (average 8pp/article).
CONFIDENTIAL www.MaryWaltham.com
14
CONFIDENTIAL
To develop a sense of how typical or representative these costs are, Table 4.4 gives
some comparisons based on my own experience and a model developed by Tenopir and
King (2000) and including a breakdown by broad discipline or country of publication for
the journals in this study.
CONFIDENTIAL www.MaryWaltham.com
15
CONFIDENTIAL
Table 4.4: Typical cost ratios
Cost
category
Learned
journal -
University
press
(2001)
Journal with
advertising-
commercial
publisher
(2003)
Biology
journals –
US society
publishers
(2003)
Biomedical
journals –US
society
publisher
(2004)
Science
journals
(2004)
JISC
study
life
science
journal
JISC study
physical
science
and
technology
journals
Average
scholarly
journal (after
Tenopir and
King 2000)
Fixed~
Content
creation
30% 26% 24% 57% 45% 35% 33% 37%
Fixed ~
Publishing
support
28% 33% 38% 7% 16% 20% 35% 30%
Variable
~Manufacturi
ng, paper
and printing:
Print + online
25% 26% 30% 23% 24% 31% 22% 19%
Variable~
Distribution
and
Fulfilment:
Print + online
17% 15% 7% 13% 15% 14% 10% 14%
Ref: Tenopir and King, Towards online journals: Realities for scientists, librarians and publishers ISBN 0-87111-507-7 (2000) and see also:
“Economic Cost Models of Scientific Scholarly Journals” by the same authors.
CONFIDENTIAL www.MaryWaltham.com
16
CONFIDENTIAL
The exact allocation of these costs will vary by publisher and by product type but these
average figures provide an independent sense of proportion to the major expenditures.
Print and online publications have distinctly different cost bases with some cost lines
irrelevant to print, such as online hosting and site maintenance - some only related to
print, such as print and mail costs - and some costs applying to both media, such as
content creation and customer service. The cost base is also changing as the online
version becomes the publication of record and additional or supplementary information
may be incorporated which increases content creation and archiving costs. The costs of
online archiving are not included within this analysis but clearly maintenance of an
online journal archive is an additional, growing and recurring cost of publishing any
journal.
Content creation costs sometimes called “first copy costs” are incurred irrespective of
whether the product is published in print or online or both. All publishing activity incurs
content creation costs. The cost base here will clearly change if the print and online
versions become distinct – as they are in a number of scholarly disciplines.
Publishing support activities will be incurred for both types of product. As online
increasingly and inevitably becomes the medium of choice for end users and the method
used for active promotion and selling of the publications, it is reasonable to presume
that like revenue, fixed costs must naturally make a transition from a predominantly
print cost base to a more balanced allocation.
Several of the publishers in the study do not allocate costs by version (print and online)
and so could only provide overall cost numbers, which relate to print and online versions
combined. Plainly this limits the ability to assess clearly the performance of the journals
according to version.
Trends in cost categories 2002 to 2004
Analysis of publishers’ expenditures based on the categories described here provides
insight into the overall cost base for the differing journals programs. Sketchy data on
version specific (i.e. print: online) costs were a feature of several of the publishers in
this study and so the analysis that follows focuses on information that was available.
Chart 4.5
provides an overview of total costs by category for the three-year period
under review for 10 journals published by 6 different publishers.
CONFIDENTIAL www.MaryWaltham.com
17
CONFIDENTIAL
Chart 4.5: Changes in costs (£): 2002-2004 for 10 journals
0
500,000
1,000,000
1,500,000
2,000,000
2,500,000
3,000,000
3,500,000
Total costs by category 2002-200
4
Content creation PRINT & ONLINE
924,883 1,082,362 1,079,419
Manf & Production PRINT
702,081 672,301 684,449
Manf & Production ONLINE
29,196 33,831 39,323
Distribution & Fulfilment PRINT
276,576 300,286 304,277
Distribution & Fulfilment ONLINE
42,720 100,169 66,354
Publishing Support PRINT &
ONLINE
683,942 727,439 784,766
Total all costs
2,659,398 2,916,388 2,958,587
123
The overall increase in costs was £300,000 or 11% with the steepest increases in the
fixed cost areas of content creation (up £155,000 or 17%) and publishing support (up
£101,000 or 15%). Print manufacturing costs fell a modest £18,000 but print distribution
and fulfilment increased by £28,000 to more than offset this. Online manufacturing costs
increased by £10,000 (35%) and distribution and fulfilment by £24,000 (55%).
Table 4.6: The costs of print (£): 2002 to 2004 for 10 journals
Year Print manf.
costs
Print manf. as %
total costs
distribution
and customer
service costs
Print dist &
cust. service
as % of total
costs
2002 702,081 26% 276,576 10%
2003 672,301 23% 300,286 11%
2004 684,449 23% 304,277 11%
While print manufacturing costs were relatively easy for the publishers to capture from
print bills supplied by their printer, these may also include some online preparation
costs, which it was not possible to extract for the individual publishers. It is
recommended that publishers keep print and online as separate cost lines going
forward, however this is not simple to do as third party suppliers frequently bundle the
price of services, which apply to both print and online versions. Print distribution
(postage) is also a discreet and accessible number. Customer service for the publishing
operations within a learned society is often part of a larger Member services centre and
so the costs for some of the society and association participants proved hard to isolate.
CONFIDENTIAL www.MaryWaltham.com
18
CONFIDENTIAL
Two of the publishers were able to supply an allocation of the proportion of customer
service costs to print and to online separately.
Print manufacturing and production in costs fell at the end of 2003 by 4% despite an
increase in pages published (see Table 4.7a
below) but rose again by 2% for this
group of 9 journals with a print version by the end of 2004. Distribution costs for print
increased sharply at the end of 2003 by some 9% compared with 2002 and then moved
up by another 1% at the end of 2004. Since print costs are strongly and directly
influenced by total pages published Table 4.7a
shows the change in pages published
over the three years for this group of journals. Note that the pages published in the
online only journal have been removed from this total figure.
Table 4.7a: Change in print pages published 2002-2004 for 9 journals
Year Total print pages published Change year/year
2002 16,185
2003 18,599 + 15%
2004 19,919 + 7%
Pages published in the 9 print and online journals have been increasing steeply and this
is mirrored in a considerable increase in the total articles published over the period as
shown in Table 4.7b.
Table 4.7b: Change in articles published 2002-2004 for 9 journals
Year Total articles published Change year/year
2002 1,664
2003 1,840 +11%
2004 1,984 +8%
Publishing support costs include much of the fixed publishing operation costs and there
was a broad range of cost levels attributed by the publishers for this area. Several of the
publishers operate the journals on a very low overhead or very little is in fact attributed
to the journals program and thus the costs are lower than a true accounting may
permit. This can make the journals’ performance look much better than it actually is, a
point that is shown further in analysis of the surplus generated.
Table 4.8: Change in costs, revenues and margin per page 2002-2004 for 10 journals
Year Pages published
(print/online and online
only)
Average
revenue
per page (£)
Average
cost
per page (£)
Average net margin
per page (£)
2002 17,700 194 150 44
2003 21,014 171 139 32
2004 23,614 160 125 34
Notice in Table 4.8
that as pages published increased by 33% over the three-year
period, the revenue, cost and margin per page all fell.
For many of these learned society publishers, the journals included in this study are
published as part of a portfolio of titles which will include some excellent performers and
CONFIDENTIAL www.MaryWaltham.com
19
CONFIDENTIAL
some much weaker that may be losing money but may make an important contribution
to the scholarly literature.
CONFIDENTIAL www.MaryWaltham.com
20
CONFIDENTIAL
Where do the journal revenues come from?
Total revenues for the 10 journals where three complete financial years of data were
available from the publishers are shown in Chart 4.9
Chart 4.9: Changes in revenue sources (£): 2002-2004 for 10 journals
0
500,000
1,000,000
1,500,000
2,000,000
2,500,000
3,000,000
3,500,000
4,000,000
Revenue
Total revenue
3,437,484 3,593,163 3,773,240
From Subscribers
3,049,023 3,194,634 3,334,958
From Others
241,147 221,993 217,447
From Authors
147,314 176,536 220,836
2002 2003 2004
Subscription revenue, revenue from authors and revenue from other sources
Chart 4.9
also shows the changes in three core categories of income to the 10 journals
over the period 2002-2004. Revenue from authors includes payments for their articles to
be made Open Access, page charges, and colour figure charges. Revenue from other
sources includes print advertising, reprint sales, back copy sales, photocopying fees (e.g.
from CLA), commercial supplement income, online pay-per-view and royalties from
online aggregators. A complete listing of revenue types included in these three
categories is shown in Appendix 1
within the profit and loss template.
Table 4.10: Revenue changes as a proportion of total revenue 2002-2004 for 10 journals
Year Revenue from
subscribers as % of total
revenue
Revenue from other
sources as % of total
revenue
Revenue from authors
as a % of total
revenues
2002 89 7 4
2003 89 6 5
2004 88 6 6
Two of the ten journals are published by a US learned society and this society publisher
derived 32% of the combined journal revenue from these two journals for 2004 from
CONFIDENTIAL www.MaryWaltham.com
21
CONFIDENTIAL
authors. This is a typical level of support from author payments to journals that charge
authors for pages published and for fees for colour figures.
One journal is fully Open Access and relies on author payments and independent
funding for all of its revenue.
Subscription revenue by subscriber category
Subscription revenue contributed 88-89% of the total income to the 9 journals selling
subscriptions through the period 2002-2004. Chart 4.11
shows the changes in the
sources of that revenue by subscriber category.
Chart 4.11: Subscription revenue (£) by subscriber category 2002-2004 for 9 journals
0
500,000
1,000,000
1,500,000
2,000,000
2,500,000
3,000,000
Revenue 2002-2004
Institutional Print
456,874 407,900 409,363
Institutional Online
49,486 47,187 43,691
Institutional P&O
2,461,400 2,661,705 2,783,707
Member Print
49,905 47,642 19,686
Member Online
000
Member P&O
13,608 15,529 47,664
Individual Non-Member Print
17,749 14,672 30,577
In
d
ivi
dua
l N
o
n-M
e
m
be
r
O
nlin
e
000
2002 2003 2004
Total revenue from institutional subscribers increased by 9% in this period with the
greatest increase from the bundled print and online subscription category. Total
revenues from Member subscriptions increased by 6% with a marked swing to Member
and
online subscriptions. Revenue per institutional subscriber across all versions in
2004 was £328 and per Member subscriber £3.80.
CONFIDENTIAL www.MaryWaltham.com
22
CONFIDENTIAL
Table 4.12: Total revenue in 2004: All journals
Publisher i i i i j k l m n o p q q Total Ave
Frequency 12 x 12 x 12 x 24 x 12 x 4 x 12 x 12 x 12 x 24 x 6 x 6 x
Total revenue
(£,000) to nearest
£1,000 443 516 515 535 323 79 36 436 813 567 1,448 209 117
Articles published 155 182 181 507 140 203 66 129 317 233 631 292 165 3201 246
Revenue/article (£) £2,858 £2,835 £2,845 £1,055 £2,307 £389 £545 £3,380 £2,565 £2,433 £2,295 £716 £709 24933 £1,918
Pages published 2,788 1,871 3,611 2,944 1,632 3,695 912 1,593 1,511 2,048 6,546 2,220 1,212 32,583 2,506
Revenue/page (£) £159 £276 £143 £182 £198 £21 £39 £274 £538 £277 £221 £94 £97 2,518 £194
Table 4.12
shows total revenue and revenue per page and per article for all 13 journals
where information was provided by publishers for 2004. Notice the range in revenue per
journal per year from £79,000 for one online only journal which relies on author fees
and grants for revenue, to £1.4 million for a journal published 24 times per year with
subscription revenues and a low level of OA author fees. Revenue per article is also
varied with the highest for two journals publishing entirely commissioned review articles
and the lowest for the online only OA journal. Per page revenues do not follow exactly
the same pattern with the highest revenue per page for the clinical journal.
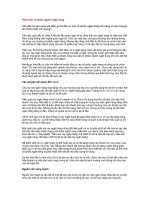
Surplus
In measuring overall journal publishing performance, generation of a net surplus/profit
year on year is viewed as a sign of success. As the case studies (see Appendix 2
) make
clear for learned societies their publishing surplus is used to support other activities.
Without this surplus additional activities would need to be at least reined in and in some
cases the society would cease to be able to exist without the injection of support from
publishing surpluses.
For the publishers included in this study average, high and low net surplus for 2002-
2004 are shown in Table 4.13
.
Table 4.13: Net contribution patterns – 10 journals
Year Highest net surplus Average net
surplus
Lowest net
surplus/loss
2002 60% (£240,000) 23% A loss of £220,000
2003 60% (£242,000) 19% A loss of £200,000
2004 62% (£268,000) 22% A loss of £161,000
Average figures plainly mask a wide divergence in business performance as is clear from
Chart 4.14
which shows the range of net margin/surplus for the 10 journals where 3
consecutive years of complete information was available.
CONFIDENTIAL www.MaryWaltham.com
23
CONFIDENTIAL
Chart 4.14: Changes in net surplus (£) for 10 journals 2002 to 2004
-300,000
-200,000
-100,000
0
100,000
200,000
300,000
2002 2003 2004
Net surplus/loss
CONFIDENTIAL www.MaryWaltham.com
24