Tài liệu Computer and Internet Use by Children and Adolescents in 2001: Statistical Analysis Report pptx
Bạn đang xem bản rút gọn của tài liệu. Xem và tải ngay bản đầy đủ của tài liệu tại đây (893.02 KB, 67 trang )
U.S. Department of Education
Institute of Education Sciences
NCES 2004–014
Computer and Internet
Use by Children and
Adolescents in 2001
Statistical Analysis Report
Matthew DeBell
Education Statistics
Services Institute/
American Institutes
for Research
Chris Chapman
National Center for
Education Statistics
U.S. Department of Education
Institute of Education Sciences
NCES 2004–014
Computer and Internet
Use by Children and
Adolescents in 2001
Statistical Analysis Report
October 2003
U.S. Department of Education
Rod Paige
Secretary
Institute of Education Sciences
Grover J. Whitehurst
Director
National Center for Education Statistics
Val Plisko
Associate Commissioner
The National Center for Education Statistics (NCES) is the primary federal entity for collecting, analyzing, and
reporting data related to education in the United States and other nations. It fulfills a congressional mandate
to collect, collate, analyze, and report full and complete statistics on the condition of education in the United
States; conduct and publish reports and specialized analyses of the meaning and significance of such statistics;
assist state and local education agencies in improving their statistical systems; and review and report on
education activities in foreign countries.
NCES activities are designed to address high priority education data needs; provide consistent, reliable, complete,
and accurate indicators of education status and trends; and report timely, useful, and high quality data to the
U.S. Department of Education, the Congress, the states, other education policymakers, practitioners, data users,
and the general public.
We strive to make our products available in a variety of formats and in language that is appropriate to a
variety of audiences. You, as our customer, are the best judge of our success in communicating information
effectively. If you have any comments or suggestions about this or any other NCES product or report, we would
like to hear from you. Please direct your comments to:
National Center for Education Statistics
Institute of Education Sciences
U.S. Department of Education
1990 K Street NW
Washington, DC 20006–5651
October 2003
The NCES World Wide Web Home Page address is:
The NCES World Wide Web Electronic Catalog is: />Suggested Citation
U.S. Department of Education, National Center for Education Statistics. Computer and Internet Use by Children
and Adolescents in 2001, NCES 2004–014, by Matthew DeBell and Chris Chapman. Washington, DC: 2003.
For ordering information on this report, write:
U.S. Department of Education
ED Pubs
P.O. Box 1398
Jessup, MD 20794–1398
Call toll free 1–877–4ED–Pubs; or order online at
Content Contact:
Chris Chapman
(202) 502–7414
Acknowledgements
The authors wish to thank John Bailey of the U.S. Department of Education’s Office of
Educational Technology for helping to make this report possible. The authors would also like to thank
Alex Janus of the U.S. Census Bureau, Nolan Bowie of the John F. Kennedy School of Government at
Harvard University, and Valena Plisko, Marilyn Seastrom, Jerry West, Bill Hussar, Edith McArthur, and
Lee Hoffman of the U.S. Department of Education’s National Center for Education Statistics, for their
detailed reviews and thoughtful comments. The authors would also like to thank staff from the Education
Statistics Services Institute (ESSI), including Sandy Eyster, who were instrumental in assuring the
technical quality of the report.
iii
Highlights
This report uses data from the September Computer and Internet Use supplement to the
2001 Current Population Survey to examine the use of computers and the Internet by American
children and adolescents between the ages of 5 and 17.
1
The report examines the overall rate of
use, the ways in which children and teens use the technologies, where the use occurs (home,
school, and other locations), and the relationships of these aspects of computer and Internet use
to demographic and socioeconomic characteristics such as children’s age and race/ethnicity and
their parents’ education and family income. All statistical comparisons in this report were tested
for significance at the 95 percent confidence level (p<.05), and all reported differences are
statistically significant, unless otherwise noted.
Key findings are as follows:
• Most children and adolescents use these technologies (table 1). About 90 percent
of children and adolescents ages 5–17 (47 million persons) use computers, and about
59 percent (31 million persons) use the Internet.
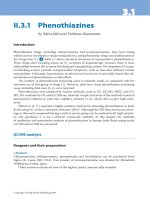
• Use begins at an early age (figure 1). About three-quarters of 5-year-olds use
computers, and over 90 percent of teens (ages 13–17) do so. About 25 percent of 5-
year-olds use the Internet, and this number rises to over 50 percent by age 9 and to at
least 75 percent by ages 15–17.
• There is a “digital divide” (table 1). Computer and Internet use are divided along
demographic and socioeconomic lines. Use of both technologies is higher among
Whites than among Blacks and Hispanics and higher among Asians and American
Indians than among Hispanics.
2
Five- through 17-year-olds living with more highly
educated parents are more likely to use these technologies than those living with less
1
Current Population Survey interviews were conducted in about 56,000 households in September 2001 and
collected information regarding 28,002 5- to 17-year-olds, including those enrolled in school and those not enrolled
in school. One respondent per household was interviewed and that respondent provided information about the
household and about individual household members, including information about computer and Internet use.
Because a household’s respondent may not have full information regarding computer and Internet use by other
members of the household, this method is a potential source of error in the data.
2
“White,” “Black,” “Asian,” and “American Indian” refer to White non-Hispanic; Black non-Hispanic; Asian or
Pacific Islander, non-Hispanic; and American Indian, Aleut, or Eskimo, non-Hispanic, respectively, and will be used
throughout this report for ease of presentation. Hispanics may be of any race.
iv
well educated parents, and those living in households with higher family incomes are
more likely to use computers and the Internet than those living in lower income
households.
• Disability, urbanicity, and household type are factors in the digital divide.
Consistent with the findings of previous research (U.S. Department of Commerce
2002), 5- through 17-year-olds without a disability are more likely to use computers
and the Internet than their disabled peers, and children and adolescents living outside
of central cities are more likely to use computers than those living in central cities.
When not controlling for other factors, children and adolescents from two-parent
households are more likely to use the computer and the Internet than those from
single-parent households,
3
and children and adolescents living outside of central cities
are more likely to use the Internet than those living in central cities. However, when
controlling for other factors such as family income and parent education, the
association of household type and of Internet use outside of central cities was not
statistically significant (table 2).
• There are no differences between the sexes in overall computer or Internet use
rates. In contrast to the 1990s, when boys were more likely to use computers and the
Internet than girls were, overall computer and Internet use rates for boys and girls are
now about the same.
• More children and adolescents use computers at school (81 percent) than at
home (65 percent) (table 3). The difference in school versus home computer use is
larger for groups of 5- through 17-year-olds who are generally less likely to use
computers. Computer use at school exceeds use at home by 30 percentage points or
more for Blacks and for Hispanics. Use at school also exceeds use at home by 30
percentage points or more for those whose parents did not complete high school, who
live with a single mother, who live in households where Spanish is the only language
spoken by household members age 15 or over, or who live in households where the
3
The categories for family structure include “male-headed single-householder” and “female-headed single-
householder.” “Single father” and “single mother” (or “single parent,” when referring to both) are used for ease of
presentation. Some single-householders include nonrelatives or relatives other than the father or mother such as a
grandfather or grandmother.
v
family income is under $20,000. However, home use is slightly more prevalent than
school use for two groups: (1) children and adolescents whose parents have at least
some graduate school education, and (2) children and adolescents who live in families
with incomes of $75,000 or more per year.
4
• Use of home computers for playing games and for work on school assignments
are common activities. A majority (59 percent) of 5- through 17-year-olds use home
computers to play games, and over 40 percent use computers to connect to the
Internet (46 percent) and to complete school assignments (44 percent) (table 4).
Middle-school-age and high-school-age youth (ages 11–17) use home computers to
complete school assignments (57–64 percent), to connect to the Internet (54-63
percent), and to play games (60-63 percent).
• Home is the most common location for Internet access, followed by school.
Although nearly all schools have Internet access, children and adolescents are more
likely to access the Internet from their homes (table 6). Of those children and
adolescents who use the Internet, 78 percent access it at home, compared to 68
percent who access it at school. Many of those who rely more on access at school
come from lower income families (less than $35,000 per year) or have parents who
have not earned at least a high school credential.
• Many disadvantaged children and adolescents use the Internet only at school.
Among the group of children and adolescents who access the Internet at only one
location, 52 percent of those from families in poverty and 59 percent of those whose
parents have not earned at least a high school credential do so at school. In
comparison, 26 percent of those from families not in poverty and 39 percent of those
with more highly educated parents do so only at school. This illustrates the role of
schools in bridging the digital divide (table 7).
• Considering all locations, use of the Internet for work on school assignments, e-
mail, and games are common activities. About 72 percent of Internet users ages 5–
17 (or 42 percent of all youth in this age range) use the Internet to complete school
4
The prevalence of the use of a technology is measured in this report by the percentage of 5–17 year-olds using the
technology. This report does not examine other aspects of the frequency of use, such as the number of incidents of
use or the amount of time spent using technologies, because the CPS does not include these data.
vi
assignments, while 65 percent of users (38 percent of all persons 5–17) use the
Internet for e-mail or instant messaging and 62 percent of users (36 percent of all
persons 5–17) use it to play games (tables 8 and 9).
vii
Contents
Acknowledgements iii
Highlights iv
List of Tables ix
List of Figures x
Introduction 1
Current Use and User Characteristics 3
Home and School Computer Use 11
Home Computer Activities 15
Internet Access Locations 22
Internet Activities 29
Conclusions 37
Methodological and Technical Notes 39
References 51
viii
List of Tables
Table 1. Percentage of children and adolescents age 5–17 who use computers and the
Internet, by child and family/household characteristics: 2001………………………… 4
Table 2. Logistic regression analyses of child and family/household characteristics and
computer and Internet use: 2001………………………………………………………… 9
Table 3. Percentage of children and adolescents age 5–17 using computers at home and at
school, by child and family/household characteristics: 2001……………………… … 12
Table 4. Percentage of persons age 5–17 using home computers for specific activities, by
child and family/household characteristics: 2001…………………………………….….16
Table 5. Percentage of home computer users age 5–17 who use home computers for
specific activities, by child and family/household characteristics: 2001……………… 19
Table 6. Percentage of Internet users age 5–17 who use the Internet at specific locations,
by child and family/household characteristics: 2001…………………………………….23
Table 7. Percentage of children and adolescents who use the Internet at only one location,
by child and family/household characteristics and by location of use: 2001……………26
Table 8. Percentage of persons age 5–17 using the Internet for specific activities, by
selected characteristics: 2001…………………………………………………….………30
Table 9. Percentage of Internet users age 5–17 using the Internet for specific activities, by
selected characteristics: 2001…………………………………………………………….33
Table A1. Percentage of children and adolescents age 5–17 who use computers and the
Internet, by age: 2001… …….……… … … … … ….…………………… ………53
Table A2. Percentage of adults who use computers and the Internet, by selected
characteristics: 2001……………………………………………………………….…… 54
Table A3. Characteristics of persons age 5–17: 2001……………………………………55
Table A4. Characteristics of persons age 5–17 using computers at home and at school:
2001………………………………………………………………………………………56
ix
List of Figures
Figure 1. Percentage of 5–17-year-olds using computers or the Internet, by age: 2001 5
Figure 2. Percentage of children and adolescents using computers at home and at school, by
parent educational attainment: 2001 13
Figure 3. Percentage of children and adolescents using computers at home and at school, by
family income: 2001 14
Figure 4. Percentage of children and adolescents using computers at home and at school, by
race/ethnicity: 2001 14
Figure 5. Percentage of children and adolescents age 5–17 who use the Internet at only one
location, by location and poverty status: 2001 28
x
Introduction
Computers and the Internet recently passed a milestone: both are now used by a majority
of Americans. Two-thirds of Americans used computers in 2001, up from about one-half in
1997, and 54 percent used the Internet, up from about a third in 1997. Comparable trend data
have not been published for 5- to 17-year-olds, but among those ages 9 to 17, Internet use has
increased from about one third in 1997 to about two thirds in 2001 (U.S. Department of
Commerce 2002). Currently, the use of these technologies is more widespread among children
and adolescents ages 5 through 17 than among adults: about 90 percent of 5- to 17-year-olds use
computers and 59 percent use the Internet (table 1).
This report describes computer and Internet use by children and teens ages 5–17. This
age range represents the modal ages for students in grades K-12, and has not been the focus of
previous reports using the 2001 Current Population Survey (CPS) data. The purpose of this
report is to provide interested researchers, policymakers, and the general public with a detailed
view of computer and Internet use, examining the rates of use, how these technologies are used,
where they are used, and the characteristics of users. This information provides a portrait of
those who are embracing these technologies in large numbers and those who have yet to do so.
This report is based on data collected in the September Computer and Internet Use
supplement to the 2001 Current Population Survey. Interviews were conducted in approximately
56,000 households. One respondent per household was interviewed and that respondent
provided information both about the household and about individual household members,
including information pertaining to their computer and Internet use.
1
Respondents provided
information about the computer and Internet use experiences of 28,002 5- to 17-year-olds. The
following questions are addressed using these data:
1. What percentage of children and adolescents use computers and the Internet?
1
Because a household’s informant may not have full information regarding computer and Internet use by other
members of the household (especially when that use occurs at school), this method is a potential source of error in
the data.
1
2. Is use by children and adolescents related to age, socioeconomic and demographic
characteristics such as race/ethnicity, family income, parents’ educational attainment,
and other factors?
3. How do children and adolescents use home computers and the Internet?
4. Where do children and adolescents use computers? Where do they use the Internet?
How many users use the Internet in only one place, and what locations do these users
favor?
5. Do the ways children and adolescents use computers and the Internet, and where they
use them, vary by children’s and adolescents’ demographic or socioeconomic
characteristics?
All statistical comparisons in this report were tested for significance at the 95 percent
confidence level (p<.05), and all reported differences are statistically significant, unless
otherwise noted.
2
Current Use and User Characteristics
Growth Over Time
Rates of computer and Internet use by children and adolescents have increased rapidly.
In 1984, data from the Current Population Survey indicated that 27 percent of students (from pre-
kindergarten through college) used computers at school. By 1989 this number had increased to
43 percent; by 1997 it was 69 percent. Student use of computers at home has also shown
increases, rising from 12 percent in 1984 to 19 percent in 1989, 27 percent in 1993, and 45
percent in 1997 (U.S. Department of Education 1999). Internet use by children and adolescents
of elementary and high school age has also increased rapidly, growing from about one third of 9-
through 17-year-olds in 1997 to about two thirds in 2001 (U.S. Department of Commerce 2002).
Current Use
Table 1 shows that about 90 percent of children and adolescents age 5 through 17 (47
million persons) use computers and about 59 percent (31 million persons) use the Internet.
Figure 1 graphs the relationship between age and the use of these technologies (data shown in
appendix table A1). About three quarters of children already use computers by the age of five,
and a majority use the Internet by the age of nine. Among high-school-age youth (ages 15–17),
more than 90 percent use computers and at least three quarters use the Internet.
3
4
Characteristics Percent s.e. Percent s.e.
Total (persons age 5–17) 53,013 89.5 0.30 58.5 0.49
Child characteristics
Age
5–7 11,990 80.5 0.83 31.4 0.97
8–10 12,455 90.5 0.60 53.5 1.02
11–14 16,493 92.6 0.47 68.3 0.83
15–17 12,075 93.4 0.52 77.1 0.87
Sex
Female 25,835 90.0 0.43 58.6 0.70
Male 27,178 89.1 0.43 58.3 0.68
Race/ethnicity
1
White 33,433 93.4 0.31 66.7 0.59
Black 8,275 85.0 1.07 45.3 1.50
Hispanic 8,400 78.7 1.59 37.2 1.87
Asian 2,268 89.7 1.46 64.6 2.29
American Indian 637 89.8 2.74 53.5 4.51
Disability status
Disabled 626 80.0 3.65 48.9 4.56
Not disabled 45,416 89.8 0.32 59.4 0.53
Family & household characteristics
Parent educational attainment
Less than high school credential 5,450 75.6 1.33 31.6 1.44
High school credential 13,611 87.2 0.65 50.2 0.98
Some college 15,665 92.0 0.49 63.2 0.88
Bachelor's degree 6,712 94.2 0.65 69.3 1.29
Graduate education 9,114 96.4 0.45 74.4 1.04
Family/household type
Two parent household 37,230 91.3 0.33 62.2 0.57
Male householder 2,715 86.9 1.48 54.3 2.18
Female householder 12,440 85.5 0.72 48.8 1.02
Other arrangement 628 75.2 3.94 48.8 4.56
Household language
Spanish-only 2,549 70.4 2.06 28.7 2.05
Not Spanish-only 50,464 90.5 0.30 60.0 0.50
Poverty status
In poverty 9,277 80.5 1.33 36.7 1.61
Not in poverty 36,904 92.6 0.44 65.3 0.80
Family income
Under $20,000 8,344 80.1 1.00 36.5 1.20
$20,000–$34,999 8,852 86.3 0.83 48.8 1.21
$35,000–$49,999 7,438 92.0 0.72 62.8 1.28
$50,000–$74,999 9,530 93.6 0.57 67.1 1.10
$75,000 or more 12,018 96.2 0.40 75.4 0.90
Urbanicity
Metropolitan, city center 12,249 84.6 0.74 49.5 1.03
Metropolitan, not city center 23,566 91.1 0.42 61.9 0.72
Non-metropolitan 9,609 91.4 0.80 59.7 1.40
Table 1. Percentage of children and adolescents age 5–17 who use computers and the Internet, by
SOURCE: U.S. Census Bureau, Current Population Survey, September 2001.
Percent using
computers
Percent using the
Internet
child and family/household characteristics: 2001
NOTE: s.e. is standard error. Detail may not sum to total due to rounding or missing data.
Number of
children
(in thousands)
1
White, Black, Asian, and American Indian respectively indicate White, non-Hispanic; Black, non-
Hispanic; Asian or Pacific Islander, non-Hispanic; and American Indian, Aleut, or Eskimo, non-
Hispanic.
5
Figure 1. Percentage of 5–17 year-olds using computers or the Internet, by age: 2001
SOURCE: U.S. Census Bureau, Current Population Survey, September 2001.
“Digital Divide”
Although the adoption of these technologies has been rapid, it has occurred at disparate
rates in different parts of American society. How computers and the Internet are used, and
whether they are used at all, often vary by socioeconomic status (assessed in this report with
measures of parent educational attainment, poverty status and/or family income) and other
characteristics such as race/ethnicity, household composition, and urbanicity, such that the
inequality of use has been termed a “digital divide” (U.S. Department of Commerce 1998; Norris
2001). This is particularly true of adults. While 82 percent of adults with an annual family
income over $75,000 used the Internet in 2001, only 24 percent of adults with an annual family
income below $20,000 did so (table A2). Large racial/ethnic and educational differences exist as
well. Sixty percent of White and Asian adults used the Internet, compared to 47 percent of
American Indians, 39 percent of Blacks, and 31 percent of Hispanics.
2
About 80 percent of
adult college graduates used the Internet, but 42 percent with only a high school education were
Internet users, and the rate of Internet use was only 17 percent among adults who had not
2
“White,” “Black,” “Asian,” and “American Indian” refer to White non-Hispanic; Black non-Hispanic; Asian or
Pacific Islander, non-Hispanic; and American Indian, Aleut, or Eskimo, non-Hispanic, respectively, and will be used
throughout this report for ease of presentation. Hispanics may be of any race.
0
25
50
75
100
5 6 7 8 9 10 11 12 13 14 15 16 17
Percent
Age
Computer
use
Internet
use
graduated from high school. This digital divide exists for children and adolescents as well
though many differences are smaller than those found between various groups of adults.
,
able 1 shows computer and Internet use rates by individual, family, and household
charact
re
lds
he family and household settings children and adolescents experience are also related to
compu
g
e
ore
closer look at these differences provides a better picture of the magnitude of the
differen ance,
T
eristics for 5–17-year-olds.
3
Looking at individual characteristics, older adolescents a
as much as 20 percentage points more likely to use computers than younger children and as
much as 50 percentage points more likely to use the Internet (table A1). White 5–17-year-o
are more likely to use these technologies than their Black or Hispanic counterparts. In addition,
those who are not disabled are more likely to use computers and the Internet than those with
disabilities.
T
ter and Internet use. Five- through seventeen-year-olds from two-parent households are
more likely to use these technologies than those from single-parent households,
4
and those livin
with more highly educated parents are more likely to use these technologies than those living
with less well educated parents. In addition, those living in households where Spanish is not th
only language spoken are more likely to use computers and the Internet than those living in
Spanish monolingual homes. Children and adolescents in families with higher incomes are m
likely to use computers and the Internet than those in families with lower incomes. Children and
adolescents who live outside of central cities are more likely to use computers and the Internet
than those living in central cities.
A
ces in technology use between certain groups of children and adolescents. For inst
the rate of computer use for Black 5–17-year-olds is 8 percentage points lower than that of their
White counterparts, and the difference in Internet use is even more pronounced at 21 percentage
points. Differences between Whites and Hispanics are even larger (15 percentage points and 30
3
Appendix table A3 shows the characteristics of users and non-users, indicating the number and percentage of all
users and non-users who belong to selected groups.
4
The categories for family structure in the CPS data are “two parent, male-headed single-householder, female-
headed single-householder, and other arrangement.” When referring to the single householder categories, we use
“single parent” or “single father” and “single mother” for ease of presentation. Some single-householders include
non-relatives or relatives other than the father or mother such as a grandfather or grandmother.
6
percentage points, respectively). Among all racial/ethnic groups, Hispanics have the lowest rates
of computer and Internet use, while Whites and Asians have the highest rates. Approximately 76
percent of children and adolescents from households where no parent has graduated from high
school use computers and 32 percent of them use the Internet. Approximately 96 percent of
children and adolescents from households where at least one parent attended graduate school
computers and 74 percent of them use the Internet. Eighty percent of poor 5- through 17-year-
olds use computers compared to 93 percent of non-poor children, and the difference in Internet
use is even larger.
use
here is also a clear difference in children’s and adolescents’ use in households where
Spanis
e is 20
lf
isabilities are another source of differences. Adults with a disability are roughly half as
likely t
r
One important difference in use has all but disappeared, however. In the past, males have
used co
es has
er
T
h is the only language spoken compared to other households. For children and
adolescents living in households that are Spanish-monolingual, the rate of computer us
percentage points lower than those in households where other languages (usually English) are
spoken. Internet use by 5-through 17-year olds in Spanish-monolingual households is about ha
that of 5-through 17-year olds in households where Spanish is not the only language spoken.
D
o use the Internet as non-disabled adults and even less likely to have ever used a computer
(U.S. Department of Commerce 2000). Adults with visual impairments use computers and the
Internet at significantly lower rates than the rest of the adult population (Gerber and Kirchner
2001). The differences between disabled and non-disabled 5- through 17-year-olds are smalle
than those found for adults, but they still exist. Comparing 5- through 17-year-olds with and
without disabilities, the rates of computer and Internet use are both about 10 percentage points
lower for those with disabilities.
mputers and the Internet at significantly higher rates than females (Clemente 1998;
Riccobono 1986) and have reported more experience and skill with these technologies
(Schumacher and Morahan-Martin 2001). More recently, as the use of these technologi
become more widespread, this gender gap has closed for both adults and children, and among
both adults and youths today there are now no differences between the sexes in overall comput
7
or Internet use rates (U.S. Department of Commerce 2002; Miller, Schweingruber, and
Brandenburg 2001, reporting on computers only). Figures in table 1 and appendix table
consistent with this pattern.
A2 are
to study how various factors related to computer and Internet use behave when
they ar
mily
able 2 shows the results of regression analyses of the characteristics associated with
compu
he
he
In order
e looked at simultaneously, multiple logistic regression analyses were performed.
Regressions can help answer questions such as, “If one controls for parent education, is fa
income still positively related to Internet use?”
T
ter and Internet use discussed to this point.
5
Table 2 verifies several of the key findings
about the digital divide that were shown in table 1. Increases in age,
6
parental education, and
family income are all associated with an increase in a child’s odds of using computers and the
Internet. Black and Hispanic children are less likely to use computers and the Internet than
White children, and Asian children are less likely to use computers than White children.
Children living in central cities are less likely to use computers (but not less likely to use t
Internet) than those living outside central cities. Those with disabilities are less likely to use t
technologies than their non-disabled peers, and those from Spanish monolingual households are
less likely to use the technologies than those from households where other languages are spoken.
Also, no differences between boys and girls are observed. In these respects, the overall picture
of technology use that is revealed by the regression analysis is essentially the same as the picture
suggested by the bivariate analyses in table 1.
5
Multiple regression is a statistical procedure that identifies the association between each independent variable and
the dependent variable while the other independent variables are held constant, or statistically controlled. This
statistical control reveals each independent variable’s association with the variable being predicted. For details, see
the Methodological and Technical Notes section.
6
Note that in the regression analyses, age is measured as a continuous variable. Age groupings were used in the
bivariate tables.
8
9
Independent variables
Parameter
estimate
Standard
error
Odds
ratio
Parameter
estimate
Standard
error
Odds
ratio
Child characteristics
Age 0.14
*
0.01 1.16 0.24
*
0.01 1.27
Sex
Female
Male -0.13 0.15 0.89 -0.03 0.05 0.98
Race/ethnicity
1
White
Black -0.45 * 0.10 0.64 -0.60
*
0.07 0.55
Hispanic -0.59 * 0.12 0.55 -0.69
*
0.09 0.50
Asian -0.35 * 0.16 0.71 0.00 0.11 1.00
American Indian -0.01 0.31 0.99 -0.12 0.20 0.89
Disability status
Not disabled
Disabled -0.74 * 0.26 0.48 -0.49 * 0.21 0.62
Missing disability status -0.17 0.10 0.84 -0.39 * 0.07 0.68
Family & household characteristics
Parent educational attainment
Less than high school credential
High school credential 0.43
*
0.12 1.54 0.46
*
0.10 1.58
Some college 0.79
*
0.12 2.20 0.89
*
0.10 2.42
Bachelor's degree 0.99
*
0.16 2.70 1.02
*
0.11 2.77
Graduate education 1.33
*
0.17 3.77 1.17
*
0.11 3.22
Missing parent education 0.06 0.16 1.06 0.27 0.14 1.31
Family/household type
Two parent household
Male householder -0.13 0.15 0.88 -0.11 0.11 0.89
Female householder 0.00 0.09 1.00 0.00 0.06 1.00
Other arrangement -0.84 * 0.24 0.43 -0.24 0.21 0.79
Household language
Not Spanish-only
Spanish-only -0.21 * 0.08 0.81 -0.16 * 0.08 0.85
Poverty status
Not in poverty
In poverty 0.02 0.16 1.02 -0.10 0.12 0.90
Family income
Under $20,000
$20,000–$34,999 0.29 0.16 1.34 0.27
*
0.12 1.31
$35,000–$49,999 0.61
*
0.19 1.85 0.68
*
0.14 1.97
$50,000–$74,999 0.64
*
0.19 1.90 0.65
*
0.14 1.92
$75,000 or more 0.90
*
0.20 2.45 0.90
*
0.14 2.47
Missing family income -0.04 0.18 0.96 0.18 0.14 1.20
Urbanicity
Metropolitan, city center
Metropolitan, not city center 0.21 * 0.09 1.23 0.09 0.06 1.10
Non-metropolitan 0.32 * 0.12 1.38 0.10 0.08 1.11
Missing urbanicity 0.21 0.12 1.23 0.16 * 0.08 1.17
Constant -0.29 0.24 0.75 -3.30
*
0.19 0.04
NOTE: The number of cases analyzed is 28,002. Missing data are modeled to retain 10,370 cases for which data are missing
for one or more independent variables.
SOURCE: U.S. Census Bureau, Current Population Survey, September 2001.
reference category reference category
reference category reference category
* p < .05
1
White, Black, Asian, and American Indian respectively indicate White, non-Hispanic; Black, non-Hispanic; Asian or
Pacific Islander, non-Hispanic; and American Indian, Aleut, or Eskimo, non-Hispanic.
Table 2. Logistic regression analyses of child and family/household characteristics and computer and Internet use: 2001
reference category reference category
reference category reference category
reference category reference category
reference category reference category
reference category
reference category
Internet Use
reference category
Computer Use
reference category
reference category
reference category
Other findings from table 1 do not appear significant in the regression analysis. Although
table 1 shows differences between children in single-parent households and children in other
family situations and between those living in poverty and those not in poverty, these results are
not observed in the regression analysis. When studied in isolation in table 1, these factors are
related to computer and Internet use, but when other factors are considered these relationships
are no longer significant. This suggests that other characteristics that were controlled for in the
regression model, such as income and parent education level, may account for the differences in
children’s odds of using computers and the Internet. Notwithstanding the non-significance of
certain variables in the regression analysis, it is still important to examine the bivariate statistics
for these variables because the bivariate statistics accurately describe the population.
7
Having looked at the overall rate of computer use among 5–17 year olds and the
characteristics of users, the next few sections describe where and how the children and
adolescents use computers and the Internet.
8
7
For example, after controlling for other factors such as household income, family structure is not significantly
related to computer and Internet use. However, it is the case that fewer children from single-parent families use
computers and the Internet.
8
This report does not examine the frequency of use or the amount of time spent using computers or the Internet
because the CPS does not collect such data.
10
Home and School Computer Use
Home and school are the primary locations where children and adolescents use
computers. Table 3 compares the rates of computer use at these two locations.
9
Eighty-one
percent of 5–17 year-olds use computers at school and 65 percent use computers at home.
10
In
general, more use computers at school than at home, but among those from households where the
highest parental education was a graduate education, and those from families with incomes
above $75,000, the rate of use at home (90 and 89 percent, respectively) was slightly higher than
the rate of use at school (85 percent).
11
Table 3 reveals demographic and socioeconomic differences in the use of home
computers that parallel those found in the overall use of computers. There are racial/ethnic gaps
in home use: 41 percent of Blacks and Hispanics use computers at home and 54 percent of
American Indians do so, compared to 76–77 percent of Whites and Asians. There is also a
difference in home use between children and adolescents from the lowest and highest family
incomes. Only 31 percent of those from families with incomes less than $20,000 use computers
at home, compared to 89 percent of those living in families with annual incomes over $75,000.
Larger still is the gap between children and adolescents whose parents have the least and the
most education: while 26 percent of those whose parents did not complete high school use
computers at home, 90 percent of those living with at least one parent who has attended graduate
school use a computer at home.
Table 3 also shows that differences between groups in home computer use are generally
not as pronounced when focusing on school computer use. While the gap in home computer use
by parental education level noted above is 64 percentage points, at school it is 14 percentage
points. While the differences in home computer use between 5–17-year-olds living in two-parent
households compared to those living in single father or single mother households was 20 and 29
9
For estimates of characteristics of persons using computers at home and at school, see appendix table A3.
10
Analyses in this report include children and adolescents who are enrolled in school and those who are not. About
93 percent of individuals age 5–17 in the 2001 September CPS are enrolled in school. Among those enrolled, 87
percent use computers at school and 67 percent use computers at home.
11
There is substantial overlap in these two populations; 63 percent of 5–17 year-olds who have a parent with a
graduate education also have a family income over $75,000 per year.
11
12
Characteristics Percent s.e. Percent s.e.
All persons age 5–17 53,013 65.2 0.47 80.7 0.39
Child Characteristics
Age
5–7 11,990 56.4 1.03 68.2 0.97
8–10 12,455 62.7 0.99 83.1 0.77
11–14 16,493 68.6 0.82 85.2 0.63
15–17 12,075 72.0 0.93 84.5 0.75
Sex
Female 25,835 65.7 0.67 81.6 0.55
Male 27,178 64.8 0.66 79.9 0.55
Race/ethnicity
1
White 33,433 76.9 0.53 83.5 0.46
Black 8,275 41.0 1.48 79.8 1.21
Hispanic 8,400 40.6 1.90 71.8 1.74
Asian 2,268 75.7 2.06 76.1 2.04
American Indian 637 54.1 4.51 83.0 3.40
Disability status
Disabled 626 58.4 4.50 71.5 4.12
Not disabled 45,416 65.7 0.51 81.4 0.42
Family & household characteristics
Parent educational attainment
Less than high school credential 5,450 26.2 1.36 70.6 1.41
High school credential 13,611 53.7 0.98 80.2 0.78
Some college 15,665 70.7 0.83 82.0 0.70
Bachelor's degree 6,712 80.8 1.10 84.8 1.00
Graduate education 9,114 90.2 0.71 85.0 0.85
Family/household type
Two parent household 37,230 73.3 0.52 81.5 0.46
Male householder 2,715 53.8 2.18 78.6 1.80
Female householder 12,440 44.1 1.02 79.6 0.82
Other arrangement 628 51.1 4.56 63.6 4.38
Household language
Spanish-only 2,549 29.2 2.06 64.2 2.17
Not Spanish-only 50,464 67.0 0.48 81.6 0.39
Poverty status
In poverty 9,277 31.9 1.56 75.2 1.44
Not in poverty 36,904 75.2 0.72 83.1 0.63
Family income
Under $20,000 8,344 31.2 1.16 75.3 1.08
$20,000–$34,999 8,852 50.9 1.21 78.3 1.00
$35,000–$49,999 7,438 70.7 1.20 83.1 0.99
$50,000–$74,999 9,530 80.1 0.93 83.9 0.86
$75,000 or more 12,018 89.3 0.64 85.4 0.74
Urbanicity
Metropolitan, city center 12,249 52.7 1.03 76.0 0.88
Metropolitan, not city center 23,566 71.9 0.67 81.4 0.58
Non-metropolitan 9,609 63.1 1.38 84.3 1.04
Table 3. Percentage of children and adolescents age 5–17 using computers at home and at
Number of
children
(in thousands)
Percent using
computers at
home
Percent using
computers at
school
school, by child and family/household characteristics: 2001
1
White, Black, Asian, and American Indian respectively indicate White, non-Hispanic; Black, non-
Hispanic; Asian or Pacific Islander, non-Hispanic; and American Indian, Aleut, or Eskimo, non-
Hispanic.
NOTE: s.e. is standard error. Detail may not sum to total due to rounding or missing data.
SOURCE: U.S. Census Bureau, Current Population Survey, September 2001.
13
percentage points, respectively, no differences are detectable between these groups in terms of
computer use at school. Although there are gaps in school computer use by race/ethnicity, home
language, and socioeconomic status (parental education, family income, and poverty), most of
these gaps are narrower than they are for home computer use.
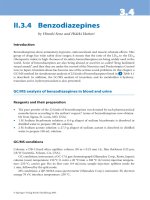
The narrowing of differences in use rates at school compared to home use is illustrated in
figures 2, 3, and 4. Figure 2 shows that the percentage of children and adolescents using
computers at home increases as their parents’ educational attainment increases, but that the
percentage using computers at school is more nearly equal across the levels of parental
education. Figure 3 shows the same pattern for family income: home computer use rates
increase as family income increases, but use of computers at school remains relatively high
across all levels of income. Similarly, figure 4 shows that differences in computer use between
some racial/ethnic groups are smaller at school than at home.
Figure 2. Percentage of children and adolescents using computers at home and at school, by
Figure 2. parent educational attainment: 2001
SOURCE: U.S. Census Bureau, Current Population Survey, September 2001.
23
51
69
80
89
69
79
82
84 84
0
25
50
75
100
Less than
high school
credential
High school
credential
Some college Bachelor's
degree
Graduate
education
Percent
Parent educational attainment
Home
use
School
use
14
Figure 3. Percentage of children and adolescents using computers at home and at school, by
Figure 3. family income: 2001
SOURCE: U.S. Census Bureau, Current Population Survey, September 2001.
Figure 4. Percentage of children and adolescents using computers at home and at school, by
Figure 4. race/ethnicity: 2001
SOURCE: U.S. Census Bureau, Current Population Survey, September 2001.
31
51
71
80
89
75
78
83
84
85
0
25
50
75
100
under
$20,000
$20,000-
$34,999
$35,000-
$49,999
$50,000-
$74,999
$75,000 or
more
Percent
Family income
Home
use
School
use
77
41 41
71
84
80
72
78
0
25
50
75
100
White Black Hispanic Other
Percent
Race/ethnicity
Home
use
School
use