Tài liệu Báo cáo khoa học: Investigation and prediction of the severity of p53 mutants using parameters from structural calculations pptx
Bạn đang xem bản rút gọn của tài liệu. Xem và tải ngay bản đầy đủ của tài liệu tại đây (335.15 KB, 14 trang )
Investigation and prediction of the severity of p53
mutants using parameters from structural calculations
Jonas Carlsson
1
, Thierry Soussi
2,3
and Bengt Persson
1,4
1 IFM Bioinformatics, Linko
¨
ping University, Sweden
2 Department of Oncology-Pathology, Cancer Center Karolinska (CCK), Karolinska Institutet, Stockholm, Sweden
3 Universite
´
Pierre et Marie Curie-Paris6, France
4 Department of Cell and Molecular Biology, Karolinska Institutet, Stockholm, Sweden
Introduction
Recently, several large-scale screens for genetic altera-
tions in human cancers have been published [1,2]. The
identification of novel genes associated with tumour
development will provide novel insight into the biology
of cancer development, but should also identify
whether some of these mutated genes could be efficient
targets for anticancer drug development. Analysis of
these screens has led to the finding that the prevalence
of missense somatic mutations is far more frequent
than expected. Moreover, this observation has been
complicated by the discovery that the genome of
cancer cells is polluted by somatic passenger mutations
(or hitchhiking mutations) that have no active role in
cancer progression and are coselected by driver muta-
tions, which are the true driving force for cell transfor-
mation [3].
Passenger mutations can be found in coding or non-
coding regions of any gene, and distinguishing them
from driving mutations is a difficult but necessary task
in order to obtain an accurate picture of the cancer
genome. Several statistical approaches have been devel-
oped to solve this problem, such as comparing the
Keywords
cancer; molecular modelling; mutations;
p53; structural prediction
Correspondence
J. Carlsson, Department of Physics,
Chemistry, and Biology (IFM
Bioinformatics), Linko
¨
ping University,
SE-581 83 Linko
¨
ping, Sweden
Fax: +4613137568
Tel: +4613282423
E-mail:
Re-use of this article is permitted in
accordance with the Terms and Conditions
set out at erscience.
wiley.com/authorresources/onlineopen.html
(Received 23 December 2008, revised
3 April 2009, accepted 29 May 2009)
doi:10.1111/j.1742-4658.2009.07124.x
A method has been developed to predict the effects of mutations in the p53
cancer suppressor gene. The new method uses novel parameters combined
with previously established parameters. The most important parameter is
the stability measure of the mutated structure calculated using molecular
modelling. For each mutant, a severity score is reported, which can be used
for classification into deleterious and nondeleterious. Both structural fea-
tures and sequence properties are taken into account. The method has a
prediction accuracy of 77% on all mutants and 88% on breast cancer
mutations affecting WAF1 promoter binding. When compared with earlier
methods, using the same dataset, our method clearly performs better. As a
result of the severity score calculated for every mutant, valuable knowledge
can be gained regarding p53, a protein that is believed to be involved in
over 50% of all human cancers.
Abbreviations
MCC, Matthews’ correlation coefficient; PLS, partial least squares; ROC, receiver operating characteristic.
4142 FEBS Journal 276 (2009) 4142–4155 ª 2009 The Authors Journal compilation ª 2009 FEBS
observed to expected ratios of synonymous to nonsyn-
onymous variants. Alternatively, various bioinformatics
methods can be used to provide an indication of
whether an amino acid substitution is likely to damage
protein function on the basis of either conservation
through species or whether or not the amino acid
change is conservative [4].
Predicting the effects of amino acid substitutions
on protein function can be a powerful method, and
several algorithms have been developed recently [4–7].
The major drawback of these analyses is the lack of
information regarding the activity or loss of activity
of the target protein, as only a few variants (< 100)
have been fully analysed. In this regard, analysis of
the p53 gene can be a paradigm for this type of anal-
ysis. First, p53 gene mutations are the most common
genetic modifications found in more than 50% of
human cancers [8]. Almost 80% of p53 mutations are
missense mutations, leading to the synthesis of a sta-
ble protein lacking its specific DNA binding activity.
The latest version of the UMD_p53 database contains
28 000 p53 mutations, corresponding to 4147 mutants
that were found with a frequency ranging from once
(2218 mutants) to 1264 times (one mutant, R175H)
[9]. A second advantage of p53 mutation analysis,
and a unique feature of this database, is the availabil-
ity of the residual activity of the majority of p53 mis-
sense mutants. The biological activity of mutant p53
has been evaluated in vitro in a yeast system using
eight different transcription promoters [10]. Third, the
three-dimensional structure of the p53 core domain,
where the majority of p53 mutations are located, has
been solved, which allows the inclusion of structural
data in a predictive algorithm. Last, phylogenetic
studies of p53 have been extensive, and more than 50
sequences from p53 or p53 family members are avail-
able in various species, ranging from Caenorhabditis
elegans and Drosophila to a large number of verte-
brates [11].
With all this information on p53, there is an excel-
lent opportunity for structural calculations and the
development of methods to predict the severity of
p53 mutations. In a recent study, we have successfully
used structural calculation techniques in studies of
mutants in human steroid 21-hydroxylase (CYP21A2),
causing congenital adrenal hyperplasia [12]. Using
structural calculations of around 60 known mutants,
we managed in all cases but one to explain why spe-
cific mutations belonged to one of four different
severity classes. This was accomplished by investigat-
ing several parameters, in combination with the
inspection of the structural models. In the light of
this achievement, we have applied a similar approach
to p53 to arrive at an automated method for the pre-
diction of mutant severity. In this paper, we show
that this is possible and that we can achieve a predic-
tion accuracy of 77%.
Results
In this study, we have investigated correlations
between human p53 mutants found in cancer patients
and the corresponding activity of promoter binding.
The aim was to obtain a better understanding of
molecular mechanisms to explain why certain muta-
tions cause more severe effects than others and to be
able to predict the severity of new, hitherto uncharac-
terized mutants.
Initial parameter investigation
For the initial development of the PREDMUT
method, two parameters were investigated: sequence
conservation and in silico-calculated molecular stability
for a specific mutant, which are described in more
detail later. Correlations between these two parameters
and impaired transactivating activity of mutants were
searched for in order to identify important regions of
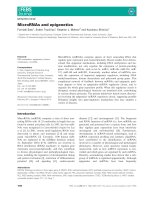
p53. This is illustrated by projection of the properties
onto the three-dimensional structure of the p53 core
domain (Fig. 1). In Fig. 1A, it can be seen that posi-
tions with residue exchanges having high energy are
present in every part of the protein, with a slight pref-
erence for the core b-sheet structures. In Fig. 1B, it
can be seen that many of the highly conserved residues
(red) are located in the core b-region, but also in the
DNA binding loops. When comparing these figures,
there are many similarities, but also some disagree-
ment. Examples of disagreement are residues R156,
with high energy but low conservation, and G244, with
low energy but high conservation. In these cases, it is
hard to determine which of the observations best cor-
respond to reality. Figure 1C shows the experimentally
determined activity, illustrating that, for R156, the
energy property correlates with the activity, whereas,
for G244, the conservation parameter correlates. Thus,
these two parameters alone are not sufficient to make
accurate predictions about the severity of a mutant,
even though they contain useful information. There-
fore, the PREDMUT algorithm was developed based
on a much larger set of parameters.
PREDMUT prediction algorithm
The PREDMUT prediction algorithm is described in
detail in Materials and methods. Using 12 different
J. Carlsson et al. Prediction of p53 mutant severity
FEBS Journal 276 (2009) 4142–4155 ª 2009 The Authors Journal compilation ª 2009 FEBS 4143
and complementary parameters (Table 1), the predic-
tion algorithm manages to classify the training data
with, on average, 79% accuracy, and to classify the
test data with, on average, slightly lower than 77%
accuracy and Matthews’ correlation coefficient (MCC)
of 0.52. Individual results from the six controlled test
runs are shown in Table 2. The total accuracy is in the
range 74–81% in total, 72–85% for severe mutants
and 70–79% for nonsevere mutants. The prediction
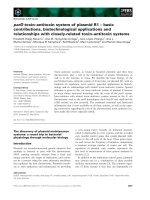
power of the algorithm can also be viewed in the
form of a receiver operating characteristic (ROC)
curve, which is shown in Fig. 2. Here, the severity
Calculated energy Conservation
Activity
AB
C
Fig. 1. Comparison of calculated energy (A), positional conservation (B) and transactivating activity (C) of p53 mutants. The structure is
based on the 1tsr crystal structure of p53. In (A), p53 is coloured according to the calculated energy for mutants at each position. Red
indicates high energy and blue low energy. In (B), the colours illustrate conservation, where red corresponds to highly conserved and blue
to nonconserved residues. In (C), the positions are colour coded from red to blue, where red indicates most severe and blue wild-type
activity.
Table 1. Description of the 12 parameters used to predict the severity of p53 mutants. Asterisks denote parameters calculated using ICM.
Parameter Explanation
Accessibility* Percentage of amino acid residues buried inside the protein when a sphere
with the size of a water molecule van der Waals’ radius is rolled over the protein surface
Similarity of the surroundings* Measure of the percentage of amino acid residues inside a sphere of 5 A
˚
that have
the same polarity or charge as the wild-type
DNA ⁄ zinc If the amino acid residue is, according to Martin et al. [38], involved in DNA or zinc binding
Pocket ⁄ cavity* A cavity is a volume inside the protein that is not occupied by any atom from the protein
and not accessible from the outside. A pocket is a cleft into the protein with volume
and depth above default values in
ICM. For an amino acid residue to be a cavity or pocket,
it must have at least one atom involved in defining the surface of the cavity or pocket
Calculated energy* The calculated energy of the protein after residue exchange
Average calculated energy* The average calculated energy of all 19 possible residue exchanges at a given position
Secondary structure* If the exchanged residue is located in a regular secondary structure element,
determined by the DSSP algorithm [39]
Hydrophobicity difference Change in hydrophobicity value according to the Kyte and Doolittle scale [40]
Size difference Change in size between native and new amino acid residue as defined in Protscale [41]
Amino acid similarity The amino acid similarity between native and mutated residues, as classified in C
LUSTALX [42].
‘:’ corresponds to residues with conserved properties and has a value of 0; ‘.’ corresponds to
semiconserved properties and has a value of 0.5; if no similarity exists, the parameter has a
value of 1
Polarity change If the mutant causes polarity or charge changes. Change equals unity and no change equals zero
Conservation Percentage conservation at each position using p53 homologues of the vertebrate subphylum.
The species included are listed in Table S1.
Table 2. Prediction accuracy (%) for each of the six test runs on
p53 cancer mutants, where each run was trained on five-sixths of
the mutants and tested on the remaining one-sixth.
Test
run Total
Class 1
(< 25% activity)
Class 2
(> 25% activity)
18174 85
27673 77
37979 79
47570 78
57670 82
67477 72
Total 77 74 79
Prediction of p53 mutant severity J. Carlsson et al.
4144 FEBS Journal 276 (2009) 4142–4155 ª 2009 The Authors Journal compilation ª 2009 FEBS
cut-off value is varied, which, when increased, raises
the accuracy for severe mutations and decreases the
accuracy for nonsevere mutations, and vice versa when
decreased.
We also tested the algorithm on a subset of breast
cancer-specific mutations with a prediction accuracy
of 88% (Table S2). Only mutants with an observed
frequency over five in cancer were included in this
dataset, resulting in 342 mutations. The nonsevere
mutations are classified correctly in 85% of cases and
the severe mutations in 89% of cases, giving an
MCC value of 0.66. If mutations are sorted according
to frequency, the 49 most frequent mutations are pre-
dicted correctly. For the 12% that are not correctly
classified, we found some common properties. Among
the 31 wrongly predicted severe mutations, 20 corre-
spond to residue side-chains exposed to the surface
(65% versus 13% for correctly predicted mutations)
and 17 correspond to residue exchange with similar
properties (55% versus 24%). Together, these two
properties explain why 29 of the 31 wrongly predicted
mutations are hard to predict. Among the nine
wrongly predicted nonsevere mutations, two are
DNA ⁄ zinc binding (22% versus 0%) and six are com-
pletely conserved (67% versus 15%). Together, this
explains the difficulty in predicting seven of the nine
wrongly classified nonsevere mutations.
25% activity delineates severe and nonsevere
mutants
The limit between the classes was set to the activity
value of 25%, because this value was observed to be a
natural divider of the data. The algorithm was also
evaluated with other separation limits between the
classes (1%, 2%, 3%, 5%, 10%, 15%, 20%, 30% and
40% activity) but, in all of these cases except for the
1% value, the data were always harder to separate (see
Table 3). In the case of the 1% limit, the distribution
between the two classes is highly skewed. A prediction
stating that all mutations were nonsevere would result
in 89% prediction accuracy. However, the MCC of
such a prediction is zero. Thus, the 25% value seems
to be an optimal class divider.
Biological support of the 25% activity limit can be
found by looking at the frequency distribution of the
Table 3. Effect of cut-off value on the prediction accuracy. The prediction accuracy, specificity, sensitivity, number of mutants classified and
MCC values on training data using different activity thresholds to delineate between severe and nonsevere mutants.
Activity cut-off
value
(%)
Prediction
accuracy
(%)
Class 1 Class 2
MCC
Specificity
(%)
Sensitivity
(%)
Number of
mutants
Specificity
(%)
Sensitivity
(%)
Number of
mutants
1 78.9 73.1 31.5 130 79.7 95.9 1018 0.38
2 78.4 76.1 35.9 155 78.8 95.5 993 0.42
3 76.1 78.4 36.2 172 75.7 95.2 976 0.41
5 73.9 81.5 39.1 206 72.2 94.7 942 0.43
10 72.3 83.4 51.7 336 67.7 90.8 812 0.47
15 78.1 79.6 75.1 541 76.5 80.8 607 0.56
20 78.4 79.3 80.8 642 77.5 75.9 524 0.57
25 78.7 81.0 82.3 669 75.6 74.1 479 0.57
30 77.8 78.0 84.6 706 77.4 68.8 442 0.54
40 76.9 75.2 88.8 773 80.5 61.2 375 0.53
Fig. 2. ROC curve. True positive rate (TPR) and false positive rate
(FPR) depending on the cut-off value used to discriminate between
the two severity classes in the test data. The broken line repre-
sents prediction on test data and the full line on training data. The
straight line represents a random classification and the cross indi-
cates the cut-off value used in PREDMUT.
J. Carlsson et al. Prediction of p53 mutant severity
FEBS Journal 276 (2009) 4142–4155 ª 2009 The Authors Journal compilation ª 2009 FEBS 4145
mutations. Mutations found with high frequency in
humans should also be those that cause cancer,
whereas the low-frequency mutations often are passen-
ger mutations. As can be observed in Fig. 3, almost all
of the high-frequency mutations have an average activ-
ity of less than 25%. In total, there are 15 272 muta-
tions found with lower than 25% activity and only 888
mutations found with over 25% activity. This corre-
sponds to an average mutation frequency of 47 versus
8. In addition, the average frequency of mutations with
20–25% activity is still high, with a value of 24,
whereas the frequency decreases to 13 for mutants with
25–30% activity.
Parameter weights
The different parameter weights in the prediction algo-
rithm can provide crucial information. In Table 4, the
parameters and their corresponding weights are listed
for the WAF1 promoter. As WAF1 has well-defined
binding characteristics [13], it was chosen as the first
promoter for the development of PREDMUT. The
parameters are divided into three classes: general prop-
erty, position specific and mutant specific. The general
property class contains parameters that are protein
independent, but mutant dependent. The position-
specific class includes parameters that are protein
dependent, but does not reflect the resulting amino acid
residue after mutation. Finally, the mutant-specific
class, including only one parameter, contains informa-
tion dependent on both protein and mutant.
Not surprisingly, conservation is found to be a very
important factor for the severity of a mutant. Accessi-
bility is also shown to be important; this is natural as
side-chains at the surface possess fewer spatial
restraints and are thereby less often correlated with
severe mutations. Other intuitively important factors
are the similar amino acid variable and size change
variable, as large changes in property and size of an
amino acid residue could affect the protein negatively.
The novel variables, the calculated energy for a spe-
cific residue exchange and for the average of all amino
acid substitutions at one position, are the third and
fourth (see Table 5A) most important variables,
respectively. The combined weight of the two energy
variables is even larger than the individual weights for
both conservation and accessibility (see Table 5B),
making it possible to increase the prediction accuracy
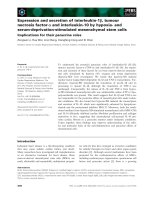
compared with earlier prediction algorithms. In Fig.4,
the energy parameter is studied in more detail. Here,
all mutants of the two classes are ranked according to
their average calculated energy. The diagram shows
decreasing energy on the x-axis, and the number of
mutations with this or higher energy on the y-axis. For
severe mutants, the number of mutants increases at
high energy values, causing a gap between the curves
representing severe and nonsevere mutants. The sepa-
ration is not complete between the two classes, but
there is a clear difference. One can, for example,
observe that, if a mutant has a normalized energy of
Activity vs frequency
0
20
40
60
80
100
120
140
0 50 100 150 200
Frequency
Activity
Fig. 3. Activity versus frequency. The
WAF1 activity of p53 mutations is plotted
against the number of times they are found
in human cancer patients. The most fre-
quent mutations, the hotspot mutations, are
not included. However, they all have activity
below 25%.
Table 4. Parameter weights calculated by PREDMUT and PLS for
the WAF1 promoter, together with parameter classification. Gen-
eral property parameters are completely protein nonspecific, posi-
tion-specific parameters are dependent on the position in the
protein and mutant-specific parameters depend on the position and
type of amino acid residue substitution.
Parameter
Weight
PREDMUT
Weight
PLS Class
Accessibility 22 20 Position specific
Conservation 16 24 Position specific
Average calculated energy 13 14 Position specific
Size change 12 6 General property
Calculated energy 11 8 Mutant specific
Similar amino acids 8 9 General property
Hydrophobicity difference )7 3 General property
Secondary structure )4 )1 Position specific
Polarity change )2 0 General property
Pocket ⁄ cavity 2 )6 Position specific
Surrounding amino acids )1 )1 Position specific
Prediction of p53 mutant severity J. Carlsson et al.
4146 FEBS Journal 276 (2009) 4142–4155 ª 2009 The Authors Journal compilation ª 2009 FEBS
0.5 or more, it is extremely likely to be a severe
mutant, as only 2.7% of the nonsevere mutants possess
such high energy compared with 18.6% of severe
mutants, or a 1 : 7 ratio. If we look at the energy
value 0.325, we still have a ratio of 1 : 2.5, or 71%
probability in favour of a severe mutant. At the other
end of the spectrum, where we have low energy, there
is 75% probability for the mutation to be nonsevere if
the energy is 0.125 or lower. Thus, on the basis of this
variable alone, we can make reasonably accurate pre-
dictions on 35% of the severe mutations and on 20%
of the nonsevere mutations. Even in the most difficult
case, an energy value of 0.225, the variable provides
useful information, as we have a prediction accuracy
of 58%. This result is similar to those in earlier studies
on steroid 21-hydroxylase, CYP21A2 [12]. The calcu-
lated energy is the only parameter that is specific to
both position in the protein and the type of residue
exchange. This adds valuable information when dis-
criminating between two similar mutations at different
positions in the protein.
The weights for the parameters extracted from the
partial least-squares (PLS) method (Table 4) show
good agreement with those for our PREDMUT
method: the six most important parameters are the
same, with a total weight of 82% for our method and
81% for the PLS method.
Analogous to the prediction of the WAF1 promoter,
we developed prediction schemes for seven other pro-
moters (MDM2, BAX, 14-3-3-r, AIP, GAD45,
NOXA, p53R2). These classifications were shown to
perform with similar prediction scores (Table 6).
The parameter weights used in the predictions of all
eight promoters are shown in Table 5A. Every column
Table 5. Parameter weights for all promoters. (A) Average and individual weights for all parameters for each promoter. Values are sorted in
descending order according to the absolute value of the average weight. (B) Average and individual weights for the grouped parameters for
each promoter. Values are sorted in descending order according to the absolute value of the average weight. Parameters that are similar
are grouped together. Energy = Energy of mutant + Average energy of mutant. General properties = Similar amino acids + Size change +
Hydrophobicity difference + Polarity change. Other = Surrounding amino acids + Two-dimensional structure + Pocket ⁄ cavity.
Parameter WAF1 MDM2 BAX 14-3-3-r AIP GAD45 NOXA p53R2 Average
A
Conservation 16 24 25 30 27 21 15 21 22
Accessibility 22 15 7 14 16 27 31 43 22
Average calculated energy 13 10 28 14 24 25 12 11 17
Calculated energy 11 10 14 18 8 8 23 0 11
Similar amino acids 8 7 6 9 4 3 6 8 7
Size change 12 15 )1 )59)3 516
Hydrophobicity difference )7 )1027 03 074
Surrounding amino acids ) 1510)16)2 )6 ) 14
Two-dimensional structure )42)2 )1232)22
Polarity change )2022 430)42
Pocket ⁄ cavity 2 2 2 0 1 1 0 2 1
B
Energy 24 20 42 32 32 33 35 11 29
Conservation 16 24 25 30 27 21 15 21 22
Accessibility 22 15 7 14 16 27 31 43 22
General properties 30 32 11 23 16 13 11 20 19
Other 7 10 15 2 9 6 8 5 8
Energy diagram
0%
10%
20%
30%
40%
50%
60%
70%
80%
90%
100%
0.8 0.75 0.7 0.65 0.6 0.55 0.5 0.45 0.4 0.35 0.3 0.25 0.2 0.15 0.1 0.05 0
Normalized energy
Cumulative frequency
Severe (< 25%)
Non-severe (> 25%)
Fig. 4. Energy diagram. Cumulative fre-
quency of severe and nonsevere mutants,
respectively, plotted against the normalized
average calculated energy for all mutants.
J. Carlsson et al. Prediction of p53 mutant severity
FEBS Journal 276 (2009) 4142–4155 ª 2009 The Authors Journal compilation ª 2009 FEBS 4147
sums to 100, using absolute values, so the weights are
directly comparable. The DNA ⁄ zinc parameter is not
included in the table as its weight, for technical rea-
sons, was limited to few values in the algorithm, and it
only contains information for a few mutants.
In Table 5B, similar properties are grouped together.
The weights are added using absolute values in order
to be able to judge the importance of all parameters,
regardless of their signs. We see that the energy
parameter is, on average, responsible for almost one-
third of the information used in the prediction. Con-
servation, which is commonly used in predictions, and
accessibility contain almost one-quarter each of the
information, which is only slightly more information
than can be gathered from just looking at the general
properties of the residue replacement.
The weights are generally stable, with mutual
parameter rankings possessing only a few swaps in
position. This indicates that the algorithm provides a
classification that is optimal or at least close to opti-
mal using linear separation.
The differences in weight for the promoters could be
interpreted as reflecting differences in the mode of
binding. The promoter p53R2 seems to be less depen-
dent on the stability of the protein, indicating that it
either possesses more relaxed binding that tolerates
small changes in structure, or that it binds harder and
thereby stabilizes the protein. BAX, however, seems to
be very sensitive to structural changes.
Cross-correlation between parameters
When applying the Pearson product-moment correla-
tion coefficient [14] on all possible pairs of parameters,
we can see that a few of the parameters show some
correlation. In Table 7, we highlight the parameters
with the highest correlation. The two energy parame-
ters are partly correlated, as are conservation and
accessibility, and secondary structure and accessibility.
The four parameters that reflect amino acid properties
are also correlated. This explains how the hydropho-
bicity difference can be negative for some promoters,
as it is the total weight (as shown in Table 5B) of these
four parameters that best describe this phenomenon.
However, when testing to remove any of the parame-
ters, the prediction became slightly worse, showing
that all parameters are necessary and that they comple-
ment each other.
Other classification techniques
Other classification techniques were investigated to
evaluate whether they could add improvements to the
new method. To further investigate differences between
the two classes, the data were analysed using principal
component analysis in SIMCA-P 11 [15,16]. However,
the data could only be partially separated when con-
sidering the first two components. Thus, using only
principal component analysis on the data is not suffi-
ciently powerful to provide an accurate prediction.
Another popular method for classification is support
vector machines (SVMs) [17], and several kernels
Table 7. Cross-correlation between parameters. Parameters that
show the highest pairwise correlation coefficients are shown. All
other correlation coefficients are below 0.3, with the majority
below 0.1.
Parameter Calculated
energy
Average
calculated energy
0.48
Parameter Conservation
Two-dimensional
structure
Accessibility 0.45 0.46
Parameter Hydrophobicity
difference
Similarity
change
Size
change
Polarity change 0.43 0.47 0.25
Hydrophobicity
difference
0.63 0.34
Similarity change 0.43
Table 6. Promoter prediction results (%) for eight p53-related pro-
moters.
Promoter Training set Test set
WAF1 79 77
MDM2 76 72
BAX 77 74
14-3-3-r 77 74
AIP 78 75
GAD45 80 74
NOXA 80 75
p53R2 80 75
Table 8. Prediction accuracy (%) for the best of the methods
tested and their respective MCC values.
Prediction
method
Total
prediction
accuracy
Class 1
(< 25% activity)
Class 2
(> 25% activity) MCC
SVM (p = 5) 76.7 82.5 68.6 0.52
PLS 73.3 86.7 63.0 0.50
PREDMUT 76.6 73.7 78.7 0.52
Prediction of p53 mutant severity J. Carlsson et al.
4148 FEBS Journal 276 (2009) 4142–4155 ª 2009 The Authors Journal compilation ª 2009 FEBS
[radial, dot, sigmoid and polynomial (using values of
two to six as the polynomial)] were tested using the
SVM implementation in icm. The best SVM used the
polynomial kernel with a value of five as the polyno-
mial (see Table 8). The total prediction accuracy is
similar to that of PREDMUT. However, the weights
for the individual parameters are not known, making
it impossible to determine the contributions of each
parameter to the final classification.
Furthermore, PLS was investigated using SIMCA-P
11 [16]. This method performed with slightly lower
prediction quality than PREDMUT. In addition, the
nonsevere classification of only 63% is on the low side
and the MCC value of 0.50 is slightly lower than that
of PREDMUT (see Table 8).
Cut-off safety margin
Sometimes, when the algorithm decides whether or not
a mutation is severe, the severity score is very close to
the cut-off, making the prediction of that particular
mutant uncertain. By introducing a small safety mar-
gin around the cut-off value, the prediction results out-
side this margin can be improved. The mutants that
possess a score within the safety margin are classified
as having unknown severity. In Table 9, the prediction
accuracy is shown using difference sizes of the safety
margin. By increasing the safety margin, we can go
from 77% accuracy and an MCC value of 0.52 to
88% accuracy and an MCC value of 0.74. The draw-
back is that, in the latter case, only 45% of the
mutants are classified.
Hotspot mutants
There are several p53 mutants that are extremely over-
represented in human cancers, for example three lung
cancer mutants induced by smoking described by
Denissenko et al. [18]. It was therefore interesting to
investigate how these mutants score using our predic-
tion algorithm. In the case of R273C, R273H, R248W
and R248Q, they are fairly easy to predict as they are
involved in DNA binding. However, if the information
about DNA binding is removed, all but R248Q are
still correctly classified, mostly depending on their high
conservation, but the high energy and low accessibility
are also important factors. Looking at nonDNA bind-
ers, R175H, G245S, R249S and R282W, they are also
highly conserved, but here the high energy and low
accessibility of the mutants contribute equally to the
total severity score. The above examples of eight fre-
quent mutants are all correctly predicted with the new
method. Indeed, the prediction accuracy greatly
increases with mutation frequency, even though this
information is not included in the data. The low-fre-
quency mutants (frequency below six) have a 75% pre-
diction accuracy on the training data, whereas the
high-frequency mutants have 84% prediction accuracy.
If the frequency cut-off is further increased to 10, the
accuracy increases to 88%, 95% at frequency 40, and
100% at frequency 80. Thus, all very frequent mutants
are correctly predicted using PREDMUT.
Thermally sensitive mutants
In contrast with initial beliefs, thermally sensitive
mutants were only slightly harder to predict than the
others, with 76% correctly predicted. To be able to
discriminate this type of mutant from the rest, we
looked for special characteristics that were common
for most of these mutants. The only overall difference
found was an increased number of changes in polarity
(51% versus 23%). Mutants that have a polarity
change are correctly classified in 91% of cases, and so
these are very easy to spot. The remaining mutants are
harder to predict (60% correct), and thus require
further experimental tests in order to explain their
behaviour.
Web server
A web server has been developed with the purpose of
displaying information about p53 mutations. It shows
information on molecular properties for all single-
nucleotide mutations affecting the central domain of
p53. For each variant, the values of all parameters used
in the severity prediction are given. On the basis of
these values, a severity score is presented, in addition
to a class prediction and the activity values from Kato
et al. [10]. Furthermore, the protein structure is shown
as an interactive three-dimensional display based on
Table 9. Prediction accuracy (%) depending on the size of the
safety margin (%) used around the cut-off value. Mutants with a
severity score inside the safety margin were classified as
unknown.
Safety
margin
Total
prediction
accuracy
Class 1
(< 25%
activity)
Class 2
(> 25%
activity) Unknown MCC
0 76.6 78.7 73.6 0 0.52
5 78.3 80.4 75.3 11.4 0.55
10 80.2 83.4 75.8 23.3 0.59
15 82.6 85.6 78.3 34.9 0.64
20 85.5 89.1 80.5 46.0 0.70
25 87.6 91.1 82.6 54.9 0.74
J. Carlsson et al. Prediction of p53 mutant severity
FEBS Journal 276 (2009) 4142–4155 ª 2009 The Authors Journal compilation ª 2009 FEBS 4149
the KiNG 3D viewer [19]. The amino acid residue
exchanged is highlighted in red. In the interactive view,
it is possible to zoom, rotate, change colours, save
viewpoints, and so on. The server is available via
under ‘Services’.
Discussion
Parameters
The prediction method described uses 12 parameters,
each assigned a weight, reflecting the contribution of
that parameter. The parameter representing the indi-
vidual molecular free energy has a relatively large
weight and gives a direct indication of the severity of a
mutant. This is also the only parameter that is com-
pletely specific to a given mutant. The average calcu-
lated energy at each position could be interpreted as a
measure of the structural robustness. If this measure is
mapped onto the three-dimensional structure, structur-
ally important regions can be discerned that could not
be found by considering conservation alone. This can
be useful in further studies of proteins with known
three-dimensional structures, when evaluating new
mutants or designing mutants in a protein that should
not affect the stability of the protein. It might also be
used to understand protein folding mechanisms. In
Table 4, the parameters were categorized into general,
position specific and mutant specific. Almost three-
quarters of the information content originates from
position-specific and mutant-specific parameters, show-
ing that the structural context is very important.
Comparison with earlier prediction methods
The prediction of the severity of p53 mutants has been
attempted several times before. A direct comparison is
difficult to make as different mutation datasets have
been used. Many have (as have we) focused on the muta-
tion dataset of Kato et al. [10]. However, different filter-
ing and limitations to this dataset have been applied.
As we use structural information, we can only pre-
dict 1148 (codons 95–288) of 2314 (codons 2–393)
mutations. However, without any filtering, our method
has an MCC value of 0.52 and an accuracy of 77%.
In Align-GVGD [6,20], the mutations in which the
promoters behaved differently were filtered out. In
addition, a different activity cut-off of 45% was used
versus 25% in our study. In this way, nonfunctional
and functional mutations were predicted with 64.6%
and 95% prediction accuracy, equalling an MCC value
of 0.57 for 1514 mutants. If the same filtering is used
on the 1148 mutations with structural information, we
obtain 652 mutants and an MCC value as high as 0.64
(86% for nonfunctional and 79% for functional).
When SIFT [4,5] was compared with Align-GVGD
by Mathe et al. [20], it performed slightly worse
(MCC = 0.47), whereas Dayhoff’s classification [21]
made inferior predictions (MCC = 0.19).
To determine how effective our structural parameters
are at predicting mutation severity, we compared them
with CUPSAT [22]. By choosing the optimal cut-off
value of )0.37 kcalÆmol
)1
for stability changes, CUP-
SAT managed to obtain an MCC value of 0.19, with
slightly higher prediction accuracy for nonsevere muta-
tions. In the same way, we chose optimal cut-off values
of 0.35 and 0.30 for the two energy parameters used in
PREDMUT: the average calculated energy and the cal-
culated energy for a specific mutation. With these cut-
off values, we obtained MCC values of 0.26 and 0.18.
The parameters have high prediction accuracy on nonse-
vere mutations, making them a valuable complement to
conservation analysis which performs well when predict-
ing severe mutations. A 25% delineation between classes
is used in this comparison, whereas, if 45% is used to
delineate the classes, as in Mathe et al. [20], the results
are slightly worse for both methods (MCC values of
0.16 for CUPSAT and 0.23 and 0.18 for the respective
PREDMUT energy parameters).
Interpretation of mutant severity
From the prediction algorithm, each mutant is given a
severity score. This total score carries information on
how much the mutant affects the activity of the pro-
tein. Further information can be gathered by consider-
ing which parameters have the largest contribution
to the total score. If the most strongly contributing
parameters are predominantly structurally related, the
low activity probably is caused by a destabilization of
the protein, whereas, if most contributions come from
functionally related parameters, residues critical for the
function can be expected.
An example of a structurally related mutant is one
with low energy and large changes in amino acid prop-
erties, whereas a functionally related mutant could be
one with rather high energy that is conserved and sur-
face exposed. Which of the prediction parameters
belongs to which group is not easily distinguished;
instead, the complete picture is needed to make a
correct prediction.
Correlation between severity and frequency
The mutants show a clear correlation between severity
and frequency for most of the parameters. If the
Prediction of p53 mutant severity J. Carlsson et al.
4150 FEBS Journal 276 (2009) 4142–4155 ª 2009 The Authors Journal compilation ª 2009 FEBS
high-frequency half of the mutants is compared with
the low-frequency half, the high-frequency mutants are
found to be more conserved (95% versus 87%), to
have more deeply buried residues (84% versus 75%),
to more often be DNA ⁄ zinc binders (25% versus 9%),
to have higher normalized energy (0.36 versus 0.26).
and so on. From this, it can be concluded that the
more frequent is a mutant, the more severe it is, which
is confirmed by the difference in average activity
between the two groups (7.9% versus 23.7%). There-
fore, it can be assumed that the less frequent mutants
need some additional trigger or factor to be able to
cause human cancer, whereas the high-frequency
mutants can cause cancer by themselves. Thus, the
consequence is that the severe mutants appear more
frequently in cancer patients, whereas the nonsevere
mutants may exist in similar quantity but are not
found as frequently as they do not cause cancer.
In addition, there are relatively few mutants with
only a small decrease in p53 activity found in cancer.
From the p53 mutation database [9], it can be seen
that the average number of cancer patients having a
certain p53 mutation with a corresponding activity of
over 50% is only 5.7, whereas it is as high as 40 on
average for mutations with a corresponding activity of
below 50%. This indicates that, in general, cancer-
causing p53 mutations are associated with low activity.
Infrequent and high-activity mutations
In the p53 mutation database, there are few mutations
with high activity and also some mutations found only
once. Some of these mutations may not be causative
agents of cancer, but may only be found in cancer
patients by coincidence. As cancer is such a common
disease, there are bound to be some patients having a
p53 mutation that has nothing to do with the cause of
their cancer. Alternatively, the effect of the mutation
alone is not sufficient to cause cancer without additional
help from other factors. These aspects are important to
bear in mind when considering p53-specific treatments.
Difference in promoter binding
For most of the mutants, the promoters behave in simi-
lar ways, although WAF1 and MDM2 seem to be
slightly more sensitive to mutations and NOXA and
p53R2 slightly less so. This is indicated by the average
activity of mutants in the central domain of 26% for
WAF1 and 34% for MDM2, 71% for NOXA and 61%
for p53R2, and around 45% for the other four promot-
ers. For some specific mutants, the differences in activity
are very large (Table 10). These mutants are therefore
expected to be involved in the binding of the promoters.
If the activity is comparatively low, the residue
exchanges should be of special importance for the spe-
cific promoters. If the activity is comparatively high, it
can be concluded that this promoter does not bind to
this amino acid residue, at least not in the same way as
the others. From Table 10, it can be seen that p53R2
possesses a few mutants that behave differently from the
rest of the promoters. Of these, amino acid residues 243
and 275 are involved in DNA binding and 244 and 246
are in very close proximity to DNA binding. This indi-
cates that p53R2 either does not use these residues for
binding or that they are not necessary for binding as the
DNA binds sufficiently hard to the other DNA binding
residues. For the WAF1 and MDM2 promoters, the sit-
uation is opposite with extra high sensitivity towards
certain mutants. Of these, only residue 283 is involved in
DNA binding. However, residues 272 and 276 are close
to DNA binding. The other four residues are further
away, but at the same side of the protein, indicating a
possible additional binding site needed for the WAF1
promoter.
Prediction of the severity of mutants in other
proteins
All parameters used for the predictions of p53 could
be used for any protein with known structure. How-
ever, without sufficient training data, an automated
prediction is not possible. Nevertheless, if the same
Table 10. Mutants with very different behaviour depending on
which promoter is measured. The top half shows mutants in which
the activity for the p53R2 and NOXA promoters is similar to that of
the wild-type, whereas the activity for all the other promoters mea-
sured is almost zero. The bottom half shows mutants that affect
WAF1 and MDM2 more severely than the other promoters.
Mutant Promoter
Activity
(%)
Activity for
the other
promoters
(%)
M243T p53R2 ⁄ NOXA 82–128 0–27
G244D p53R2 131 0–2
M246I p53R2 143 0–2
M246L p53R2 97 0–1
M246V p53R2 56 0–1
C275S p53R2 223 0–1
Q192R WAF1 32 67–135
D208E WAF1 ⁄ MDM2 2–12 36–96
T256A WAF1 11 40–86
N263D WAF1 ⁄ MDM2 1–18 54–108
V272A WAF1 ⁄ MDM2 1–3 32–49
A276T WAF1 ⁄ MDM2 2–20 53–221
R283C MDM2 0 25–153
J. Carlsson et al. Prediction of p53 mutant severity
FEBS Journal 276 (2009) 4142–4155 ª 2009 The Authors Journal compilation ª 2009 FEBS 4151
weights are used as for p53, possibly somewhat tuned
according to biological knowledge of the protein in
question, a relative score between different mutants
can be produced. This has been tested on human ste-
roid 11-b-hydroxylase with good results (J. Carlsson,
A. Wedell and B. Persson, unpublished results). The
initial investigation of a number of additional proteins
adds further evidence that the method generalizes well
on other, nonrelated proteins.
If the purpose is to find residue exchanges that do
not impair stability, the individual severity scores can
be calculated for several candidate mutants and, subse-
quently, the mutant(s) with the lowest score(s) can be
selected. If, on the other hand, the aim is a prediction
of the activity, the scores are less valuable. However, if
the mutants are split into three groups with the lowest
scores in one group indicating wild-type activity, the
intermediate scores in a middle group and the high-
severity scores and thereby low activity in a third
group, the mutants placed in the first and third groups
can be expected to correlate well with high and low
activity, respectively, if the intermediate group is suffi-
ciently large. For the conservation score, it is important
to base this on a good multiple sequence alignment
with many sequences. All other parameters are inde-
pendent of such ‘environmental’ effects.
Materials and methods
p53 activity data
Activity data are available for all single-nucleotide mutants
with eight different promoters (WAF1, MDM2, BAX, 14-3-
3-r, AIP, GAD45, NOXA, and p53R2) and were taken from
the work by Kato et al. [10], where 2314 p53 mutants were
expressed (on average, 5.9 mutants per residue) and their
activity measured. Data are available from the p53 website
( Among
the 2314 mutants, 1148 were localized in the central core
domain of the protein and were used for training and evalua-
tion of our prediction algorithm. Of the eight promoters, we
studied the WAF1 promoter in greatest detail with additional
testing and usage of different training methods. We also
developed similar prediction schemes for the remaining
promoters and evaluated them in the same way as for
WAF1.
Training and testing sets
The mutants were divided into two classes. Mutants with
an activity above 25% were considered to be less severe
and were denoted class 1 mutants (524 mutants), whereas
those with lower activity were considered to be severe and
were denoted class 2 (624 mutants).
To evaluate the performance of the algorithm, test sets
were created. We used five-sixths of the data for training
and the remaining one-sixth for evaluation. This was per-
formed for all six combinations. Data were sorted accord-
ing to activity and then evenly distributed into six
representative test groups by letting the first mutant go into
the first training set, the second mutation into the second
training set, and so on.
Development of the prediction method
PREDMUT
A two-state classification algorithm, called PREDMUT
(PREDict MUTants), was developed for prediction of the
severity of p53 mutants. The method was trained on a set
of known mutants and subsequently evaluated on another
set.
The method is based on parameters reflecting the bio-
chemical and structural properties of the amino acid resi-
dues affected by the mutations. In total, 12 different and
complementary parameters were considered, as detailed in
Table 1. A test of systematically removing one parameter
at a time resulted in impaired prediction accuracy in all
cases. As a preprocessing step, input data for each para-
meter were normalized to a value ranging from zero to
unity.
In the prediction method, each of the 12 parameters was
assigned a weight. These weights were optimized during the
training phase (see below). To obtain the severity score for
a specific mutant, the values for each of the 12 parameters
were multiplied by the respective parameter weight and
then summed. If this score was above a threshold calculated
by the algorithm, the mutant was predicted to be severe
and thereby belonging to class 2 and, if it was below, it was
predicted to be nonsevere and thereby belonging to class 1.
During training of PREDMUT, a Monte Carlo tech-
nique was employed to optimize the parameters used in the
prediction [24]. Initially, weights of zero were assigned to
all parameters. Subsequently, an iterative process was
undertaken in which a parameter weight was increased or
decreased randomly by a fixed value. After each random
change, the parameter settings were evaluated. If the score
was improved, the parameters were retained; if the score
was impaired, the recent change was rejected. However, if
no improvements were found after a predefined number
of iterations, one of the parameters causing impairment
was randomly changed in order to determine the global
optimum.
As there are many random steps involved, the algorithm
can traverse the multidimensional parameter landscape in
an infinite number of ways, at least in a practical sense.
The predictions were improved by performing multiple
training runs and, subsequently, by selecting the run that
resulted in the best prediction on the training data.
However, often several runs resulted in a similar set of
Prediction of p53 mutant severity J. Carlsson et al.
4152 FEBS Journal 276 (2009) 4142–4155 ª 2009 The Authors Journal compilation ª 2009 FEBS
parameter weights and thresholds, indicating a stable
solution which is likely to correspond to the optimal. If
infinite loops of increments and decrements of the same
parameter without improvement were detected, the algo-
rithm made a random change of another parameter in
order to circumvent the problem.
When evaluating the PREDMUT algorithm, the goal
was to arrive at as accurate a prediction as possible without
being biased towards the larger class 2. This was obtained
by minimizing the sum of the individual prediction error
percentage for the two classes.
Structural modelling and energy calculations
The three-dimensional structure of p53 was taken from the
PDB entry 1tsr chain 1 [25] in the RCSB protein data bank
(), as a basis for all measurements and
simulations. For each mutant, the residue exchange was
inferred to the structure, whereafter its energy was mini-
mized using the Monte Carlo method implemented in icm
[26,27], similar to that described for CYP21A2 [12].
The structure was repeatedly minimized, alternating
between local and global procedures. In the local minimiza-
tion, the sum of the energy terms was minimized locally in
the direction in which the total energy gradient was the steep-
est. In the global energy minimization, a stochastic method
was used where random changes, biased towards high-energy
regions, were made. Changes which decreased the energy
were always retained, whereas changes that increased the
energy were kept with a probability that decreased exponen-
tially with increasing energy difference. For each local
minimization, we used five times 1000 iterations and, for the
global minimization, we used 3000 iterations for each
variable that was changed from the original structure.
The energy values obtained were subsequently used as
parameters in the prediction algorithm. The energy was
minimized on the basis of the following energy terms: elec-
trostatic interactions, hydrogen bonds, van der Waals’
interactions and torsion energy with parameters from the
ECEPP ⁄ 3 force field [28]. The water in the simulation was
treated implicitly in order to considerably reduce the simu-
lation time.
For each mutant, the energy value of its corresponding
structure was calculated, using the program icm. Further-
more, for each position, the average energy value for 19
structures, representing all possible amino acid residue
exchanges, was also calculated. As the central domain of
the p53 domain (positions 94–289) contains 196 amino acid
residues, a total of 3724 possible mutants was simulated.
Each mutant was simulated four times to obtain representa-
tive sampling, decreasing the risk of inappropriate energy
values as a result of calculations becoming stuck in local
minima.
Stability changes on mutation have been investigated
previously [29–34] as a complement to other prediction
parameters. However, we used a physical effective energy
function to calculate the stability changes on mutation,
whereas the methods mentioned use either statistical poten-
tials, constructed from atom contact in existing protein
structures, or empirical models, based on protein experi-
ments. To speed up calculations, we used an implicit water
solvent, which, combined with modern multicore CPUs,
makes it possible to simulate all possible mutants in the pro-
tein. Yip et al. [7] have also used a physical effective energy
function simulation, but with a completely different tech-
nique, molecular dynamics, compared with our Monte Car-
lo-based molecular modelling method. They also used a
different approach in which they predicted functionally
important residues and not the effect of mutations.
Methods have also been developed to predict mutant
severity without stability parameters [4,35,36], as have
methods that look only at stability changes of the mutation
compared with the wild-type protein [22,31].
Matthews’ correlation coefficient
Matthews’ correlation coefficient (MCC) [37] was used to
estimate the performance of the classifications. Values can
range from )1 to 1, where 1 is a perfect classification. To
obtain a high MCC value, the classification needs to be
accurate for both classes. This makes the value unbiased in
relation to the difference in class sizes. It also has the effect
that it is hard to achieve a high value. For example, a classifi-
cation with a total accuracy of 85% (90% true positives and
75% true negatives) will only produce an MCC value of 0.66.
The MCC value is calculated using the following formula:
TP Â TN À FP Â FN
ffiffiffiffiffiffiffiffiffiffiffiffiffiffiffiffiffiffiffiffiffiffiffiffiffiffiffiffiffiffiffiffiffiffiffiffiffiffiffiffiffiffiffiffiffiffiffiffiffiffiffiffiffiffiffiffiffiffiffiffiffiffiffiffiffiffiffiffiffiffiffiffiffiffiffiffiffiffiffiffiffiffiffiffiffiffiffiffiffiffiffiffiffiffiffiffiffiffiffiffiffiffiffiffiffiffiffiffiffi
TP þ FNðÞÂTP þ FPðÞÂTN þ FPðÞÂTN þ FNðÞ
p
where TP denotes true positives, TN true negatives, FP
false positives and FN false negatives.
Cross-correlation between parameters
To measure the similarity between parameters, we used
Pearson’s product-moment correlation coefficient [14]
described by the following equation:
r ¼
P
x À
xðÞy À yðÞ
ffiffiffiffiffiffiffiffiffiffiffiffiffiffiffiffiffiffiffiffiffiffiffiffiffiffiffiffiffiffiffiffiffiffiffiffiffiffiffiffiffiffiffiffiffi
P
x À
xðÞ
2
P
y À
yðÞ
2
q
where x and y are values from the two parameters mea-
sured, and
x and y are the mean values for the respective
parameters.
Thermally sensitive mutants
There are several p53 mutants whose activity varies con-
siderably depending on the temperature. Under normal
J. Carlsson et al. Prediction of p53 mutant severity
FEBS Journal 276 (2009) 4142–4155 ª 2009 The Authors Journal compilation ª 2009 FEBS 4153
conditions, they have no or very low activity but, if the
temperature is lowered by just 7 °C, they behave almost as
the wild-type protein. This dataset should be very hard to
predict correctly as the stabilities of the mutated proteins
are very close to those of the wild-type, yet they have low
activity.
References
1 Sjoblom T, Jones S, Wood LD, Parsons DW, Lin J,
Barber TD, Mandelker D, Leary RJ, Ptak J, Silliman
N et al. (2006) The consensus coding sequences of
human breast and colorectal cancers. Science 314,
268–274.
2 Greenman C, Stephens P, Smith R, Dalgliesh GL,
Hunter C, Bignell G, Davies H, Teague J, Butler A,
Stevens C et al. (2007) Patterns of somatic mutation in
human cancer genomes. Nature 446, 153–158.
3 Chanock SJ & Thomas G (2007) The devil is in the
DNA. Nat Genet 39, 283–284.
4 Ng PC & Henikoff S (2001) Predicting deleterious
amino acid substitutions. Genome Res 11, 863–874.
5 Ng PC & Henikoff S (2002) Accounting for human
polymorphisms predicted to affect protein function.
Genome Res 12, 436–446.
6 Tavtigian SV, Deffenbaugh AM, Yin L, Judkins T,
Scholl T, Samollow PB, de Silva D, Zharkikh A & Tho-
mas A (2006) Comprehensive statistical study of 452
BRCA1 missense substitutions with classification of
eight recurrent substitutions as neutral. J Med Genet 43,
295–305.
7 Yip YL, Zoete V, Scheib H & Michielin O (2006) Struc-
tural assessment of single amino acid mutations: appli-
cation to TP53 function. Hum Mutat 27, 926–937.
8 Soussi T & Beroud C (2001) Assessing TP53 status in
human tumours to evaluate clinical outcome. Nat Rev
Cancer 1, 233–240.
9 Soussi T, Dehouche K & Beroud C (2000) p53 website
and analysis of p53 gene mutations in human cancer:
forging a link between epidemiology and carcinogenesis.
Hum Mutat 15, 105–113.
10 Kato S, Han SY, Liu W, Otsuka K, Shibata H,
Kanamaru R & Ishioka C (2003) Understanding the
function–structure and function–mutation relationships
of p53 tumor suppressor protein by high-resolution
missense mutation analysis. Proc Natl Acad Sci USA
100, 8424–8429.
11 Greenblatt MS, Beaudet JG, Gump JR, Godin KS,
Trombley L, Koh J & Bond JP (2003) Detailed compu-
tational study of p53 and p16: using evolutionary
sequence analysis and disease-associated mutations to
predict the functional consequences of allelic variants.
Oncogene 22, 1150–1163.
12 Robins T, Carlsson J, Sunnerhagen M, Wedell A & Pers-
son B (2006) Molecular model of human CYP21 based
on mammalian CYP2C5: structural features correlate
with clinical severity of mutations causing congenital
adrenal hyperplasia. Mol Endocrinol 20, 2946–2964.
13 el-Deiry WS, Tokino T, Velculescu VE, Levy DB,
Parsons R, Trent JM, Lin D, Mercer WE, Kinzler KW
& Vogelstein B (1993) WAF1, a potential mediator of
p53 tumor suppression. Cell 75, 817–825.
14 Rodgers JL & Nicewander WA (1988) Thirteen ways to
look at the correlation coefficient. Am Stat 42,8.
15 Daffertshofer A, Lamoth CJ, Meijer OG & Beek PJ
(2004) PCA in studying coordination and variability: a
tutorial. Clin Biomech (Bristol, Avon) 19, 415–428.
16 Eriksson L, Johansson E, Kettaneh-Wold N & Wold S
(2001) Multi- and Megavariate Data Analysis – Princi-
ples and Applications. Umetrics, Umea
˚
.
17 Vapnik VN (1975) The Nature of Statistical Learning
Theory, 2nd edn. Springer, New York, NY.
18 Denissenko MF, Pao A, Tang M & Pfeifer GP (1996)
Preferential formation of benzo[a]pyrene adducts at
lung cancer mutational hotspots in P53. Science 274
,
430–432.
19 Richardson DC & Richardson JS (1992) The kine-
mage: a tool for scientific communication. Protein Sci
1, 3–9.
20 Mathe E, Olivier M, Kato S, Ishioka C, Hainaut P &
Tavtigian SV (2006) Computational approaches for pre-
dicting the biological effect of p53 missense mutations:
a comparison of three sequence analysis based methods.
Nucleic Acids Res 34, 1317–1325.
21 Dayhoff MO (1978) Atlas of Protein Sequence and
Structure. National Biomedical Research Foundation,
Washington DC.
22 Parthiban V, Gromiha MM & Schomburg D (2006)
CUPSAT: prediction of protein stability upon point
mutations. Nucleic Acids Res 34, W239–W242.
23 Reference withdrawn.
24 Tom E & Schulman KA (1997) Mathematical models in
decision analysis. Infect Control Hosp Epidemiol 18,
65–73.
25 Cho Y, Gorina S, Jeffrey PD & Pavletich NP (1994)
Crystal structure of a p53 tumor suppressor–DNA com-
plex: understanding tumorigenic mutations. Science 265,
346–355.
26 Abagyan R & Totrov M (1994) Biased probability
Monte Carlo conformational searches and electrostatic
calculations for peptides and proteins. J Mol Biol 235,
983–1002.
27 Abagyan R, Totrov M & Kuznetsov D (1994) icm –a
new method for protein modeling and design: applica-
tions to docking and structure prediction from the
distorted native conformation. J Comput Chem 15,
488–506.
28 Nemethy G, Gibson KD, Palmer KA, Yoon CN,
Paterlini G, Zagari A, Rumsey S & Scheraga HA
(1992) Energy parameters in polypeptides. 10.
Prediction of p53 mutant severity J. Carlsson et al.
4154 FEBS Journal 276 (2009) 4142–4155 ª 2009 The Authors Journal compilation ª 2009 FEBS
Improved geometrical parameters and nonbonded
interactions for use in the ECEPP ⁄ 3 algorithm, with
application to proline-containing peptides. J Phys
Chem 96, 6472–6484.
29 Saqi MA & Goodfellow JM (1990) Free energy changes
associated with amino acid substitution in proteins.
Protein Eng 3, 419–423.
30 Wang Z & Moult J (2001) SNPs, protein structure, and
disease. Hum Mutat 17, 263–270.
31 Guerois R, Nielsen JE & Serrano L (2002) Predicting
changes in the stability of proteins and protein com-
plexes: a study of more than 1000 mutations. J Mol
Biol 320, 369–387.
32 Capriotti E, Fariselli P, Calabrese R & Casadio R
(2005) Predicting protein stability changes from
sequences using support vector machines. Bioinformatics
21(Suppl 2), ii54–ii58.
33 Feyfant E, Sali A & Fiser A (2007) Modeling mutations
in protein structures. Protein Sci 16, 2030–2041.
34 Barenboim M, Jamison DC & Vaisman II (2005) Statis-
tical geometry approach to the study of functional
effects of human nonsynonymous SNPs. Hum Mutat
26, 471–476.
35 Chasman D & Adams RM (2001) Predicting the
functional consequences of non-synonymous single
nucleotide polymorphisms: structure-based assess-
ment of amino acid variation. J Mol Biol 307, 683–
706.
36 Xue D, Yin J, Tan M, Yue J, Wang Y & Liang L
(2008) Prediction of functional nonsynonymous single
nucleotide polymorphisms in human G-protein-coupled
receptors. J Hum Genet 53, 379–389.
37 Matthews BW (1975) Comparison of the predicted and
observed secondary structure of T4 phage lysozyme.
Biochim Biophys Acta 405, 442–451.
38 Martin AC, Facchiano AM, Cuff AL, Hernandez-Bous-
sard T, Olivier M, Hainaut P & Thornton JM (2002)
Integrating mutation data and structural analysis of
the TP53 tumor-suppressor protein. Hum Mutat 19,
149–164.
39 Kabsch W & Sander C (1983) Dictionary of protein
secondary structure: pattern recognition of hydrogen-
bonded and geometrical features. Biopolymers 22, 2577–
2637.
40 Kyte J & Doolittle RF (1982) A simple method for dis-
playing the hydropathic character of a protein. J Mol
Biol 157, 105–132.
41 Zimmerman JM, Eliezer N & Simha R (1968) The
characterization of amino acid sequences in proteins by
statistical methods. J Theor Biol 21, 170–201.
42 Chenna R, Sugawara H, Koike T, Lopez R, Gibson TJ,
Higgins DG & Thompson JD (2003) Multiple sequence
alignment with the Clustal series of programs. Nucleic
Acids Res 31, 3497–3500.
Supporting information
The following supplementary material is available:
Table S1. p53 sequences.
Table S2. Breast cancer mutations.
This supplementary material can be found in the
online version of this article.
Please note: As a service to our authors and readers,
this journal provides supporting information supplied
by the authors. Such materials are peer-reviewed and
may be re-organized for online delivery, but are not
copy-edited or typeset. Technical support issues arising
from supporting information (other than missing files)
should be addressed to the authors.
J. Carlsson et al. Prediction of p53 mutant severity
FEBS Journal 276 (2009) 4142–4155 ª 2009 The Authors Journal compilation ª 2009 FEBS 4155