Tài liệu Báo cáo khoa học: Identification, sequencing, and localization of a new carbonic anhydrase transcript from the hydrothermal vent tubeworm Riftia pachyptila docx
Bạn đang xem bản rút gọn của tài liệu. Xem và tải ngay bản đầy đủ của tài liệu tại đây (1.56 MB, 14 trang )
Identification, sequencing, and localization of a new
carbonic anhydrase transcript from the hydrothermal
vent tubeworm Riftia pachyptila
Sophie Sanchez, Ann C. Andersen, Ste
´
phane Hourdez and Franc¸ois H. Lallier
Equipe Ecophysiologie: Adaptation et Evolution Mole
´
culaires, UMR 7144 CNRS UPMC, Station Biologique, Roscoff, France
Vestimentiferan tubeworms (Polychaeta; Siboglinidae)
often represent a major component of the endemic
fauna at hydrothermal vents and cold seeps. These
annelid worms are devoid of mouth, digestive tract,
and anus [1], relying completely on their autotrophic
sulfide-oxidizing symbionts to fulfill their metabolic
needs [2]. These symbionts are located deep inside the
body of the host, in a specialized organ called the
trophosome. This location, remote from the environ-
ment that contains all the necessary nutrients for the
bacteria, implies that the tubeworm host needs to
transport oxygen, hydrogen sulfide and inorganic car-
bon compounds in large quantities for the bacteria to
produce organic matter [3].
CO
2
is acquired from the environment by diffusion
through the branchial plume [4,5], the respiratory-
exchange organ, where it is immediately converted
into bicarbonate through high activities of carbonic
Keywords
chemoautotrophy; differential expression;
messenger RNA; symbiosis; Siboglinidae
Correspondence
F. H. Lallier, Equipe Ecophysiologie:
Adaptation et Evolution Mole
´
culaires,
UMR 7144 CNRS UPMC, Station
Biologique, Place Georges Teissier,
BP 74, 29682 Roscoff Cedex, France
Fax: +33 29829 2324
Tel: +33 29829 2311
E-mail:
Database
Nucleotide sequence data are available in
the GenBank database under the accession
numbers EF490380 (RpCAbr) and EF490381
(RpCAbr2)
(Received 22 March 2007, revised 24 July
2007, accepted 20 August 2007)
doi:10.1111/j.1742-4658.2007.06050.x
The vestimentiferan annelid Riftia pachyptila forms dense populations at
hydrothermal vents along the East Pacific Rise at a depth of 2600 m. It
harbors CO
2
-assimilating sulfide-oxidizing bacteria that provide all of its
nutrition. To find specific host transcripts that could be important for the
functioning of this symbiosis, we used a subtractive suppression hybridiza-
tion approach to identify plume- or trophosome-specific proteins. We
demonstrated the existence of carbonic anhydrase transcripts, a protein
endowed with an essential role in generating the influx of CO
2
required by
the symbionts. One of the transcripts was previously known and sequenced.
Our quantification analyses showed a higher expression of this transcript in
the trophosome compared to the branchial plume or the body wall. A sec-
ond transcript, with 69.7% nucleotide identity compared to the previous
one, was almost only expressed in the branchial plume. Fluorescent in situ
hybridization confirmed the coexpression of the two transcripts in the bran-
chial plume in contrast with the trophosome where only one transcript
could be detected. An alignment of these translated carbonic anhydrase
cDNAs with vertebrate and nonvertebrate carbonic anhydrase protein
sequences revealed the conservation of most amino acids involved in the
catalytic site. According to the phylogenetic analyses, the two R. pachyptila
transcripts clustered together but not all nonvertebrate sequences grouped
together. Complete sequencing of the new carbonic anhydrase transcript
revealed the existence of two slightly divergent isoforms probably coded by
two different genes.
Abbreviations
BP, bootstrap value; CA, carbonic anhydrase; FISH, fluorescent in situ hybridization; HB, hybridization buffer; IRES, internal ribosome entry
site; MP, maximum parsimony; NJ, Neighbour-joining; RpCAtr, Riftia pachyptila carbonic anhydrase trophosome; RpCAbr, Riftia pachyptila
carbonic anhydrase branchial plume; SSH, subtractive suppression hybridization.
FEBS Journal 274 (2007) 5311–5324 ª 2007 The Authors Journal compilation ª 2007 FEBS 5311
anhydrase (CA) [6,7]. Inorganic carbon accumulates
up to very high concentrations in the body fluids (up
to 30–60 mmolÆL
)1
[4,5]). The pH values of these fluids
remain stable and alkaline relative to the surrounding
environment thus maintaining an inward CO
2
gradient
[4,6,8]. Kochevar and Childress [7] also measured high
CA activities in the trophosome. Indeed, once near the
bacteriocytes (the cells housing the bacteria in the
trophosome), a reconversion of bicarbonate into CO
2
is necessary because the bacterial symbionts only use
molecular CO
2
[9] to enter the Calvin–Benson cycle or
the reverse tricarboxylic acid cycle [10]. In this context,
high activities of CA may represent an adaptation for
providing the symbionts with a suitable chemical form
of CO
2
.
CAs are zinc-containing enzymes catalyzing the
reversible hydration of CO
2
to bicarbonate. Ubiqui-
tous in a wide range of eukaryotic organisms, they are
also widespread in the Archaea and Bacteria domains
[11]. Among the broad range of physiological processes
in which they participate, CA can play a significant
role in autotrophic organisms, serving as an inorganic
carbon-concentrating component [12]. In symbiosis
involving metazoa and autotrophic organisms, the host
CA may help to provide a sufficient CO
2
flow to the
symbionts, as shown for example in algal–cnidarian
symbioses [13]. In the same way, measurements of CA
activity in several chemosynthetic clam and vestimen-
tiferan species indicate that CA facilitates inorganic
carbon uptake, with high activities reported from
clam gill, vestimentiferan plume and trophosome
tissues [6,7].
Biochemical studies on Riftia pachyptila [14,15]
revealed two main forms of cytosolic CA, with differ-
ent kinetics and apparent molecular weight; one pres-
ent in the branchial plume and the other in the
trophosome. A complete cDNA was obtained by De
Cian et al. [15] from the trophosome tissue. Further
functional and histological studies suggested the exis-
tence of several carbonic anhydrase isoforms in the
trophosome tissue [16,17], indicating the possible exis-
tence of various CA isoforms in groups other than
vertebrates. Earlier studies [3] addressed the central
role of the branchial plume in oxygen, CO
2
and sulfide
acquisition, as well as blood transport of these meta-
bolites to the trophosome where symbionts are housed.
However, this review [3] highlighted several points that
remain to be elucidated regarding the different path-
ways involved in these transport processes.
In an attempt to identify yet unknown host proteins
involved in branchial and trophosome functions associ-
ated with the symbiotic mode of life of R. pachyptila,
we constructed subtractive tissue-specific cDNA
libraries (subtractive suppression hybridization, SSH).
Among other cDNAs, we obtained a new CA tran-
script from the branchial tissue that is different from
the one previously sequenced. In the present study, we
show that the two CA sequences are differentially
expressed in tissues of the worm. These sequences are
also compared with other CA sequences from verte-
brates and nonvertebrates.
Results
CA sequences from the SSH libraries
From the body wall-subtracted trophosome cDNA
library, we recovered a 3¢ coding sequence fragment of
174 nucleotides and a partial 3¢ untranslated region
(3¢ UTR) sequence of 234 nucleotides. These two frag-
ments were strictly identical to the sequence already
found by De Cian et al. [14] (accession number
Q8MPH8), hereafter referred to as R. pachyptila car-
bonic anhydrase trophosome (RpCAtr).
From the body wall-subtracted branchial plume
cDNA library, we obtained a carbonic anhydrase tran-
script of 171 nucleotides, with only 66% nucleotide
identity to the RpCAtr sequence, followed by a partial
3¢ UTR of 364 nucleotides radically different from
RpCAtr. This new sequence is hereafter referred to as
R. pachyptila carbonic anhydrase branchial plume
(RpCAbr).
Tissue-specific expression
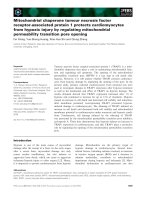
The amount of each transcript that is amplified is
quantitatively correlated to the fluorescence intensity
emitted by the SYBR Green fluorochrome when it was
incorporated in double-stranded cDNA. The number
of PCR cycles required to amplify each CA transcript
to the same level of fluorescence, relative to the
amplification of the reference transcript (18S rRNA
transcript), is shown in Fig. 1. RpCAbr amplifi-
cation reaches a fluorescence threshold after 8.49 ±
2.68 cycles for branchial plume cDNA and after
17.80 ± 4.02 cycles for trophosome cDNA (Fig. 1).
Similarly, RpCAtr amplification reaches a fluorescence
threshold after 14.24 ± 2.33 cycles and 9.11 ±
1.91 cycles for branchial plume and trophosome
cDNA, respectively. Nearly ten fewer cycles are
required to reach the threshold for the RpCAbr tran-
script in the branchial plume compared to the tropho-
some whereas approximately five fewer cycles are
required to reach the threshold for RpCAtr in the
trophosome compared to the branchial plume. Levels
in the body wall are comparatively low (20.76 ±
Carbonic anhydrase transcripts in Riftia S. Sanchez et al.
5312 FEBS Journal 274 (2007) 5311–5324 ª 2007 The Authors Journal compilation ª 2007 FEBS
5.55 cycles and 20.14 ± 0.34 cycles are required to
obtain the same quantities of RpCAbr and RpCAtr,
respectively).
Average values of relative expression levels resulted
in a 636-fold higher expression of RpCAbr in the
branchial plume compared to the trophosome (tissue-
pair comparisons within a single individual resulted in
a 1000-fold higher mean expression according to indi-
viduals for which we analysed the two tissues) and a
4950-fold higher expression of RpCAbr in the bran-
chial plume compared to the body wall (109-fold
higher mean expression for paired tissues). The
RpCAtr transcript showed a 184-fold higher expres-
sion in the trophosome compared to the branchial
plume (12-fold higher mean expression for paired tis-
sues) and a 2098-fold higher expression in the tropho-
some compared to the body wall (2500-fold higher
mean expression for paired tissues). Thus, the expres-
sion pattern of CAs appears to be tissue-specific.
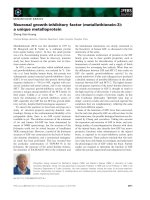
In situ hybridization
In situ hybridizations were performed on cross sections
of the branchial plume and of the trophosome as
shown in Fig. 2A. The branchial plume is composed of
a central obturaculum, mainly made of extracellular
matrix, supporting many branchial filaments at its
periphery. The branchial filaments are composed of a
single layer of epidermal cells, on top of a myoepitheli-
um that surrounds a central coelomic cavity and the
two blood vessels that it contains (Fig. 2B). The cyto-
plasm of the branchial epithelial cells is clearly stained
with the RpCAbr cDNA probe (Fig. 2C). The staining
is cytoplasmic because it generally corresponds to the
rough reticulum area around the nucleus and is maxi-
mal in the cytoplasmic apex of the branchial epidermis.
By contrast, the staining is very weak basally along the
myoepithelium that lines the internal coelomic cavity.
Although nuclei appear clustered on one side of each
filament (Fig. 2D), a homogenous fluorescence was
observed in the cytoplasm of the cells. The staining
appears to be specific of the probe sequence because
the staining is clear with the complementary sequence
to RpCAbr, but not with the sense probe (negative
control; Fig. 2E). The same hybridization procedure
with the antisense RpCAtr cDNA probe on gill fila-
ments sections resulted in similar staining and localiza-
tion than the RpCAbr probe (Fig. 2F). The sense
probe to the RpCAtr transcript did not give any signal
above background level (Fig. 2G).
The trophosome tissue is composed of bacteriocytes
grouped in lobules surrounding a central efferent ves-
sel, and lined by peritoneal cells that are supplied with
many small afferent blood capillaries (Fig. 2H). The
bacteriocytes house the bacterial symbionts inside vac-
uoles of their cytoplasm. RpCAbr antisense probe did
not stain the trophosome lobule more than its negative
control (Figs 2I,J). With the tissue specific RpCAtr, an
intense staining is observed in the cytoplasm of all the
bacteriocytes (Figs 2K,L) compared to its negative
control (Fig. 2M).
Full-length sequencing
The complete RpCAbr sequence (accession num-
ber EF490380) was obtained from the branchial plume
cDNA with an open reading frame of 726 nucleotides
and 5¢- and 3 ¢ UTR sequences of 171 and 442 nucleo-
tides, respectively. Positions of the primers on the com-
plete cDNA are given in Table 1. A poly(A) tail signal
(AAUAAA) occurred 405 nucleotides downstream
from the in-frame stop codon and 19 nucleotides
upstream from the poly(A) tail. Search of motifs with
the PROSITE server (ScanProsite) [18] showed
the presence of an a-CA signature from amino
acids 96–112: S-E-[HN]-x-[LIVM]-x(4)-[FYH]-x(2)-E-
[LIVMGA]-H-[LIVMFA](2). The new RpCAbr
sequence is 69.7% identical in nucleotides (and 66.8%
in amino acids) to the previously known RpCAtr
sequence (accession number Q8MPH8). The best
results of blastx on NCBI server are shown in
supplementary Table S1. In addition to RpCAtr, five
out of 15 most closely related protein sequences that
matched with our sequence belonged to nonvertebrates
0
5
10
15
20
25
branchial plume
n = 4
Number of cycles
RpCAbr amplification normalized with 18S amplification
RpCAtr amplification normalized with 18S amplification
trophosome
n = 4
body wall
n = 4
Fig. 1. Normalized amplifications of RpCAbr and RpCAtr with 18S
amplification. The number of cycles on the y-axis is the difference
between the number of cycles required to amplify each transcript
and the number of cycles required to amplify 18S. The number of
tissue replicates (n) is indicated under each histogram.
S. Sanchez et al. Carbonic anhydrase transcripts in Riftia
FEBS Journal 274 (2007) 5311–5324 ª 2007 The Authors Journal compilation ª 2007 FEBS 5313
Carbonic anhydrase transcripts in Riftia S. Sanchez et al.
5314 FEBS Journal 274 (2007) 5311–5324 ª 2007 The Authors Journal compilation ª 2007 FEBS
(supplementary Table S1). The blast analysis shows
that RpCAbr appears close both to CAI and CAII
Mus musculus isoforms sequences.
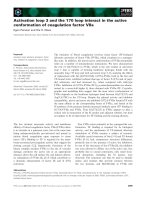
Alignment
Full-length RpCAbr and RpCAtr were aligned with
other metazoan sequences (Fig. 3). A noteworthy dif-
ference between RpCAbr and RpCAtr is the deletion
of one amino acid (proline) in the RpCAbr sequence
at position 85, whereas a majority of the aligned
sequences exhibit a proline. The three histidine residues
(named H94, H96 and H119 in reference to posi-
tions 94, 96 and 119 in CAII from Homo sapiens)
which are directly involved in binding the zinc cofac-
tor, are conserved in the two R. pachyptila sequences
(positions labeled ‘Z’ in Fig. 3). These residues are
hydrogen bond donors to Q92 (position 129, shared by
all organisms of Fig. 3 with the exception of Riftia
and Caenorhabditis sequences where it is replaced by a
serine residue), N244 (position 297, conserved) and
E117 (position 156, conserved), respectively. Other
amino acids involved in the hydrogen bond network
surrounding the active site are also conserved (posi-
tions labeled with an asterisk in Fig. 3) with few excep-
tions. For example, at position 98, the two Riftia
sequences exhibit a hydrophobic amino acid (leucine)
instead of the histidine that is shared by almost all
other sequences. The same amino acid replacement
occurs in the two isoforms CAa and CAb of Droso-
phila melanogaster.
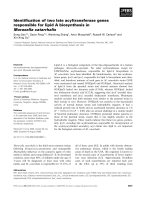
Phylogenetic analyses
Neighbour-joining (NJ) and maximum parsimony
(MP) trees produced similar topologies. Only the NJ
tree is presented in Fig. 4 but bootstrap values (BP)
for both NJ and MP analyses are shown near the
recurrent nodes found in both distance and parsimony
methods. Given the high number of taxa used in these
reconstructions, BP values are generally low, and lower
in MP tree than in the NJ one.
Nonvertebrate CA sequences are clearly polyphy-
letic. Some nonvertebrate CA sequences form a single
Table 1. Primers sequences for Riftia pachyptila carbonic anhydrase transcripts: RpCAbr and RpCAtr. Positions on the transcripts are given
using the initiation codon as a reference.
Primers Sequence (5¢-to3¢) Position
Amplification of RpCAbr and RpCAtr by quantitative PCR
RpCAbrFq
a
TGG TTT CAC CCC GTC GAA 932–949
RpCAbrRq
a
GGT CTG GTC TTT TCT CGC CAT A 966–987
RpCAtrFq
a
GCC AGG TGT CGT CCT CGT T 710–728
RpCAtrRq
a
TCA CAA ATG TCC AGT GCC AGT T 757–778
Full-length sequencing of RpCAbr
RpCAbrF TAC AAG GAT GCC ATT AGC 613–630
RpCAbrR1 CGT AGC AGT ATC AGC AGT 822–839
RpCAbrR2 AGA GCA GCA GAC CTT ACG 706–723
RpCAbrR3 GTT ACT TCC GCA GCT AGG 466–483
Probe amplification for FISH
RpCAbrF TAC AAG GAT GCC ATT AGC 613–630
RpCAbrR1 CGT AGC AGT ATC AGC AGT 822–839
RpCAtrFprobe TAC AAA GAT CCA ATC CAG C 616–634
RpCAtrRprobe TAA GAT TAC CAG AAT TGC 844–861
a
Primers designed by Primer Express software (ABI PRISM
TM
).
Fig. 2. (A) Morphological representation of an adult Riftia pachyptila removed from its tube. Histological sections performed in this study are
located at the levels indicated by shaded boxes on the drawings. t, trophosome; vs, ventral side; ds, dorsal side; o, obturaculum; c, cuticle; bf,
branchial filament; bl, branchial lamellae. (B) Transverse section showing the morphological structure of a branchial filament with cuticle (c),
tufts of cilia (cil), epithelial cells (ep), myoepithelium (my), blood vessels (bv) and coelome (coe). (C–G) FISH results on the branchial plume
sections with RpCAbr probe (C–E, green FISH) and with RpCAtr probe (F, G, red FISH). Nuclei are stained in blue. (C, D) Positive staining
with the antisense RpCAbr probe. (E) Negative control with the sense RpCAbr probe. (F) Positive staining with the antisense RpCAtr probe.
(G) Negative control with the sense RpCAtr probe. (H) Transversal section of a trophosome lobule showing peritoneal cells (pt), bacteriocytes
(b), afferent blood vessel (av) and efferent blood vessel (ev). (I–M) FISH results on the trophosome with the RpCAbr probe (I, J, green FISH)
and with the RpCAtr probe (K–M, red FISH). Nuclei are stained in blue. (I) Positive staining with the antisense RpCAbr probe. (J) Negative
control with the sense RpCAbr probe. (K) and (L) Positive staining with the antisense RpCAtr probe. (L) Higher magnification of the lobule
showing the intensity of the labeling throughout the bacteriocytes. (M) Negative control with the sense RpCAtr probe.
S. Sanchez et al. Carbonic anhydrase transcripts in Riftia
FEBS Journal 274 (2007) 5311–5324 ª 2007 The Authors Journal compilation ª 2007 FEBS 5315
Carbonic anhydrase transcripts in Riftia S. Sanchez et al.
5316 FEBS Journal 274 (2007) 5311–5324 ª 2007 The Authors Journal compilation ª 2007 FEBS
clade (Fig. 4, clade I) comprising cnidarian, protosto-
mian and deuterostomian sequences. Although sup-
ported by very low bootstrap values (BP
NJ
¼ 15 and
BP
MP
¼ 5), this clade is found in both NJ and MP
analyses. In this clade, RpCAbr is most closely related
to the previously sequenced RpCAtr (BP
NJ
¼ 100 and
BP
MP
¼ 99). Fungia scutaria (FCA-a and FCA-b) and
Caenorhabditis elegans (CA1 and CA2) sequences fall
outside of clade I and are more closely related to each
other (BP
NJ
¼ 51) (Fig. 4, clade II). Although not sup-
ported by high bootstrap values, we believe that the
isolation of clade I from the rest of nonvertebrate
sequences is well supported because the group consist-
ing of clade I, vertebrate cytosolic, and vertebrate
mitochondrial sequences is found in both NJ and MP
analyses (BP
NJ
¼ 50 and BP
MP
¼ 19). We note that
Drosophila spp. sequences form three distinct groups:
the first one (CA D. melanogaster +CAD. pseudoobs-
cura +CAD. simulans) belongs to clade I; the second
one (CA D. melanogaster-2) belongs to clade III and
the third one (CAa D. melanogaster + CAb D. mela-
nogaster +CA D. melanogaster-3) forms clade IV.
This latter clade is most closely related to the nonver-
tebrate clam Tridacna gigas and the CAVI vertebrate
sequences in both NJ and MP analyses but with very
low support (BP
NJ
¼ 15 and BP
MP
¼ 4).
RpCAbr isoforms
In addition to RpCAbr, amplification with RpCAbrR3
primer (Table 1) gave another partial cDNA with
an open reading frame of 483 nucleotides and a
175 nucleotide-long 5¢ UTR. RpCAbr and the partial
coding region of this other transcript (RpCAbr2,
accession number EF490381) are very similar to each
other and exhibited only three nonsynonymous substi-
tutions (99.38% nucleotides identity and 98.14%
amino acids identity). However, the two transcripts
strongly differ in their 5¢ UTR sequence from nucleo-
tides 18–140, although a fragment of 35 nucleotides is
very well conserved at the end of both 5¢ UTR
sequences. This latter fragment may have important
properties because investigations on 5¢ UTR regions
by the search engine UTRscan [19] revealed the
presence of an internal ribosome entry site (IRES) for
both 5¢ UTR of RpCAbr (nucleotides 83–171) and
RpCAbr2 (nucleotides 82–175) transcripts.
A phylogenetic analysis with this partial sequence
(data not shown) revealed that, as expected, RpCAbr
and RpCAbr2 grouped together and were a sister group
of RpCAtr. Other analyses (data not shown) showed
that the adult F. scutaria CA sequence (only partial and
therefore not used in our phylogenetic construction) was
most closely related to CA Anthopleura elegantissima.
Discussion
Differential expression
We demonstrated that the RpCAbr gene is highly, and
preferentially, expressed in the branchial plume tissue
whereas the RpCAtr gene is preferentially expressed in
the trophosome but significantly expressed in the bran-
chial plume tissue as well. Fluorescent in situ hybrid-
ization on histological sections corroborated these
findings with the detection of RpCAtr mRNA in both
the epidermal cytoplasm of the branchial filaments and
in the cytoplasm of the trophosomal bacteriocytes. We
could only detect RpCAbr mRNA in the epidermal
cytoplasm of the branchial filaments (we could not
detect this transcript in the trophosome probably
because of high signal background noise).
This is the first report of tissue-specific expression of
cytosolic CAs in a nonvertebrate species. Such a pro-
tein is essential for the symbiotic association of the
worms with their bacteria. Studies on A. elegantissima,
a cnidarian with symbiotic dinoflagellate, already
showed that CA expression is enhanced in the presence
of symbionts [20]. We could not reproduce such an
approach on Riftia because the aposymbiotic stage is
limited to the larval phase of its life cycle [21]. Thus, it
is first difficult to obtain these stages in the hydrother-
mal vent environment and, second, the aposymbiotic-
specific expression condition could be masked by the
developmental condition.
Comparison with western blots and CA activities
studies
Previous studies by western blots and SDS ⁄ PAGE on
cytosolic fractions [14,15] concluded that there were
two CA proteins: one of 27 kDa in the branchial
plume, and another of 28 kDa in the trophosome.
From the differential expression results we obtained,
Fig. 3. Alignment of complete RpCAbr and RpCAtr amino acids sequences with some representative metazoan CA protein sequences. Iden-
tical and similar amino acids shared by at least 50% of the isoforms are shown in black and grey, respectively. Histidine residues involved in
zinc binding in the catalytic site are indicated by a ‘Z’; important amino acids involved in the hydrogen bond network are indicated by an
asterisk; framed amino acids are commented in the ‘Results’ section and positions indicated above the frame refer to the reference posi-
tions in CAII Homo sapiens sequence. The last few amino acids of the alignment have been omitted.
S. Sanchez et al. Carbonic anhydrase transcripts in Riftia
FEBS Journal 274 (2007) 5311–5324 ª 2007 The Authors Journal compilation ª 2007 FEBS 5317
RpCAbr could correspond to the 27 kDa protein and
RpCAtr to the 28 kDa one. However, from our trans-
lated sequences, we calculated the total molecular mass
of each translated transcripts and found 26 973 Da for
RpCAbr and 27 084 Da for RpCAtr. The difference of
almost 1 kDa obtained for the trophosome CA protein
Fig. 4. NJ tree obtained after a multiple alignment of 40 complete metazoan CA amino acids sequences. Four bacterial a-CA sequences
from Nostoc sp., Klebsiella pneumoniae, Erwinia carotovora ssp. atroseptica and Neisseria gonorrhoeae are used as outgroups. Some nodes
were also recovered from MP analysis. Numbers are BP calculated from 1000 replicates from NJ (BP
NJ
) and MP (BP
MP
) analyses and are
represented as (BP
NJ
⁄ BP
MP
). Nodes with only one number (BP
NJ
) are only found from NJ analysis.
Carbonic anhydrase transcripts in Riftia S. Sanchez et al.
5318 FEBS Journal 274 (2007) 5311–5324 ª 2007 The Authors Journal compilation ª 2007 FEBS
(observed on gel) could be attributed to a differential
migration behavior of the protein in the SDS ⁄ PAGE
gel or to post-translational modifications such as phos-
phorylations. For example, three glycosylation, three
phosphorylation, and six myristyl sites were found in
the translated RpCAbr transcripts using Motif Scan
[22] (MyHits Swiss Institute of Bioinformatics; http://
myhits.isb-sib.ch). In the RpCAtr protein sequence,
ten more phosphorylation sites were found (one glyco-
sylation, 13 phosphorylation, and three myristyl sites).
Different CA activities were previously measured in
R. pachyptila [6,14,15]. In these studies, high affinities
and activities of CA had been found in the plume and
in the trophosome. CA from the branchial plume tis-
sue had an affinity of 13.9 mmolÆL
)1
and an activity of
253.7 lmol CO
2
Æmin
)1
Æg
)1
wet weight. CA from the
trophosome tissue had an affinity of 7.2 mmolÆL
)1
and
an activity of 109.4 lmol CO
2
Æmin
)1
Æg
)1
wet wt. Given
our results of differential expression, RpCAbr and
RpCAtr could be the transcripts coding for the two
different CAs identified by Kochevar et al. [14] based
on a biochemical study. However, in the protein
extracts analyzed by these authors [14] in the branchial
plume, only one CA form had been identified. There-
fore, Kochevar et al. [14] may not have detected the
second CA form (corresponding to RpCAtr transcript)
because its protein concentration was below the detec-
tion threshold. However, we do not know exactly in
what proportions the two different CA proteins are
present because we only have indications about the
expression level of their genes, which may not reflect
protein levels.
Branchial plume CA isoforms
From the full-length sequences, it appears that two
isoforms (RpCAbr and partial RpCAbr2) could corre-
spond to two different genes expressed in the branchial
plume. It is unlikely that the two sequences correspond
to different alleles of the same gene as the divergence of
the 5¢ UTRs is high. No eukaryotic specific splicing
consensus sequences could be found in either RpCAbr
or RpCAbr2 5¢ UTR sequences. These two transcripts
have different 3¢ UTRs (data not shown), which
strongly supports the existence of two distinct genes.
These transcripts are thus likely to be the result of
the transcription of two different genes that evolved
independently after a duplication event. This possible
duplication event may illustrate a strategy to increase
the number of transcripts instead of having a strong
transcription promoter. The fact that several genes can
be the source of several isoforms in the branchial plume
could increase global carbonic anhydrase activity.
The two isoforms possess a relatively well conserved
region in their 5¢ UTRs. This conserved region con-
tains IRES motifs. This IRES sequence is an alterna-
tive mode of 40S recruitment to the mRNA instead of
5¢ capping recruitment [23]. The occurrence of such a
mechanism could enhance the regulation capacity for
CA translation and may be correlated to an inhibition
of cap-dependant translation in the branchial plume
tissue. Indeed, some IRES are only active in specific
tissues [24]. However, we cannot draw any conclusion
with respect to any IRES activity here, because an
IRES prediction based on the 5¢ UTR sequence needs
to be checked by further studies of the structural ele-
ments (such as enzymes and translation factors) that
drive this mechanism. Interestingly however, RpCAtr
did not exhibit any IRES in its 5¢ UTR.
A membrane-bound CA in R. pachyptila?
Two models exist for CO
2
-concentrating mechanisms
in autotrophic organisms [12]. Bicarbonate ions may
enter the cells through specific anionic exchangers and
then be converted to CO
2
intracellularly with the help
of cytosolic CA; alternatively, membrane-bound CA
can catalyze bicarbonate conversion to CO
2
extracellu-
larly in the boundary layer and thereby locally increase
CO
2
gas diffusion into the cells. The existence of a
membrane-bound CA has been postulated in Riftia
bacteriocytes on the basis of inhibitor experiments per-
formed on isolated cells [17]. The two Riftia sequences
presented in this study (RpCAbr and RpCAtr) do not
appear to be membrane-bound isoforms. The RpCAbr
and the RpCAtr transcripts are phylogenetically
related and both distant from the vertebrate mem-
brane-bound (CAIV) isoforms, and from the larval
F. scutaria sequences (FCA-a and FCA-b), which may
be membrane-bound isoforms [25]. Moreover, as
shown in the alignment, R. pachyptila CAs do not
share any specific feature with CAIV isoforms when
FCA-a and FCA-b do [25]. The Riftia sequences are
also phylogenetically distant from the mosquitoes
Aedes aegypti and Anopheles gambiae CA sequences,
and do not contain any GPI-anchored site (tested with
the psort ii server; binding the
protein to the membrane, whereas the mosquitoe
sequences do [26]. In addition, no evidence of signal
peptide in 5¢ coding regions of R. pachyptila CA
sequences could be found.
Catalytic mechanism
The zinc catalytic active site works in two main steps.
During the first step, the zinc-bound hydroxide reacts
S. Sanchez et al. Carbonic anhydrase transcripts in Riftia
FEBS Journal 274 (2007) 5311–5324 ª 2007 The Authors Journal compilation ª 2007 FEBS 5319
with CO
2
forming a zinc-bound bicarbonate, which is
then replaced by water. During the second step of cat-
alytic activity, a proton is transferred from the zinc-
bound water to the external buffer via a shuttle group,
H64 (using amino acids positions in CAII H. sapiens
sequence as a reference from here on; Fig. 3). This
proton transfer is necessary to regenerate the zinc-
bound hydroxide, which is the catalytically active spe-
cies [27,28]. This H64 (position 98 in the alignment,
Fig. 3) combined with a histidine cluster consisting of
residues H3, H4, H10, H15 and H17, explains the gen-
eral high efficiency of CAII isoforms as a catalyst
[27,29] because it could constitute a very appropriate
channel to efficiently transfer protons from the active
site to the reaction medium [30]. H64 can be replaced
by less efficient proton shuttle groups such as K64 (in
CAIII Rattus norvegicus for example) or Y64 (in CAV
M. musculus,CAA. elegantissima,CAD. melanogaster
and CA D. pseudoobscura).
Among nonvertebrates sequences, Strongylocentrotus
purpureus and F. scutaria larvae sequences have a
H64 also shared by A. gambiae, A. aegypti, T. gigas,
D. melanogaster-2 and D. melanogaster-3 sequences
(data not shown). By contrast, R. pachyptila amino
acid sequences do not have any of these CAII features.
Indeed, they have neither H64 nor any specific histi-
dine cluster. Besides, the two R. pachyptila sequences
exhibit a hydrophobic amino acid (leucine) instead of
H64. That point is problematic since this amino acid
cannot receive any proton. D. melanogaster CAa and
CAb sequences also share this peculiar trait. To our
knowledge, there has been no study on specific CA
activity in this latter species. CA activity is however,
present in R. pachyptila, and, if these transcripts
encode for functional proteins, a possibility of replace-
ment of H64 could be the involvement of another
group, E106, which, although a less likely candidate,
has been suggested to be able to transfer protons [31].
However, without an overexpression approach of
RpCAbr and RpCAtr, we cannot know the functional
effect of changes of some key amino-acids.
Origin and number of nonvertebrate CAs
Although the bootstrap values of the deep branches are
low, we can draw some tentative conclusions from the
phylogeny. The present study cannot exclude that
clades I and II could have a common origin with
cytosolic CAI, CAII, CAIII, CAVII and mitochondrial
CAV vertebrate isoforms, as previously suggested [15].
The two clades could have a common ancestor being
either a CAII-like [32] or a CAVII-like [33] protein. By
contrast to the phylogenetic analysis of De Cian et al.
[15], where only three nonvertebrate sequences were
included, the extended set of invertebrate sequences
now available in the present study did not strictly group
together. Our phylogenetic reconstruction shows, on
the one hand, a close relationship of R. pachyptila CA
sequences with one of the CA D. melanogaster
sequences and, on the other hand, the other
D. melanogaster sequences more closely related to the
CAVI vertebrate isoforms (CAa, CAb and D. melano-
gaster-3) or to the mosquitoe sequences (D. melano-
gaster-2). Del Pilar Corena et al. [34] suggested that
several CA isoforms also exist in A. aegypti. The
cnidarian F. scutaria also possesses multiple CA
transcripts [25]. The adult F. scutaria sequence is more
closely related to R. pachyptila and A. elegantissima CA
transcripts (data not shown). By contrast, the two larval
Fungia CA transcripts included in our phylogenetic
reconstruction appear to be evolutionarily distant from
clade I, as previously reported [25]. Vertebrate cyto-
plasmic CAs could have evolved through duplication
events over the course of 600 million years [33]. In the
study by De Cian et al. [15], the three nonvertebrate
sequences analyzed (RpCAtr, CA A. elegantissima and
CA D. melanogaster) formed a distinct cluster apart
from the secreted (CAVI) and membrane-bound
(CAIV) isoforms. The present study could support the
existence of a more ancient a
-CA-like ancestor for both
vertebrate and nonvertebrate CAs.
Experimental procedures
Animals and sampling
Specimens of R. pachyptila were collected at the Rehu
Marka (17°25¢S, 113°12¢W), Susie and Miss WormWood
(17°35¢S, 113°14¢W) sites at a depth of 2600 m along the
South-east Pacific Rise during the BIOSPEEDO 2004
cruise. For each individual, parts of the branchial plume,
trophosome and body wall tissues were isolated on ice,
placed in RNAlater (Ambion, Austin, TX, USA) for 24 h
at 4 °C and frozen in liquid nitrogen.
RNA extraction
Plume, trophosome and body wall tissue samples were
pulverized individually in liquid nitrogen under Rnase-free
conditions. For each tissue, total RNA was extracted using
the RNAble solution (Eurobio, Courtaboeuf, France)
following the manufacturer’s instructions. Then, both for
libraries constructions and complete sequencing, messenger
poly(A) RNAs were purified using the oligo-dT resin
column of the mRNA Purification Kit (Amersham, Little
Chalfont, UK).
Carbonic anhydrase transcripts in Riftia S. Sanchez et al.
5320 FEBS Journal 274 (2007) 5311–5324 ª 2007 The Authors Journal compilation ª 2007 FEBS
Construction of subtractive tissue-specific cDNA
libraries
Libraries were constructed from tissues belonging to one
individual therefore representing one organism transcrip-
tome. A total of four libraries were obtained: branchial
plume versus body wall subtracted library (and its recipro-
cal) and trophosome versus body wall subtracted library
(and its reciprocal).
For all tissue pairs, cDNA synthesis as well as SSH)
[35,36], comprising steps of adaptor ligation, subtractive
hybridization and selective amplification were performed
following the protocol of the Clontech PCR-Select
TM
cDNA
Subtraction Kit (BD Biosciences, Palo Alto, CA, USA). For
each SSH procedure, the whole amplification product was
cloned in TOPOÒ-TA cloning vector (Invitrogen, Carlsbad,
CA, USA), giving a range of cDNA fragment sizes. Nearly
200 cDNA fragments were sequenced for each library.
SYBR Green quantitative PCR
Reverse transcription
From each total RNA sample (branchial plume, tropho-
some and body wall) fresh reverse transcription was con-
ducted with a random primer. Each reaction mixture was
composed of 2 lL of Moloney murine leukemia virus
reverse transcriptase buffer; 0.5 lL of BSA (10 mgÆmL
)1
),
1 lL of total RNA (1.24 lgÆlL
)1
), 2.5 lL of dNTP (4 mm
total), 1.5 lL of Random Primer 9 (Ozyme, St-Quentin-
en-Yvelines, France) (100 ngÆlL
)1
), 3 lL of diethylpyro-
carbonate. Then, reaction mixtures were incubated at
80 °C for 5 min and placed on ice. Moloney murine leuke-
mia virus reverse transcriptase was added (1 lL) to each
reaction mixture and all reactions were incubated at 42 °C
for 1 h and finally placed on ice.
Amplification
Specific pairs of CA primers (Table 1) located in the
3¢ untranslated region of each transcript were designed
using the software primer express (Applied Biosystems,
Foster City, CA, USA). 18S rRNA transcript was chosen
as a reference gene for the normalization of expression data
and was amplified with the 18 h and 18L primers [37]. For
amplifications, the Power SYBR Green PCR master mix
(Perkin Elmer, Waltham, MA, USA) was used with 23 lL
reaction mixtures in a Chromo4
TM
System CFB-3240 (Bio-
Rad, Hercules, CA, USA). PCR reactions were performed
in triplicates. Amplification conditions were 40 cycles with
the following profile: 95 °C for 30 s, 60 °C for 30 s, and
72 °C for 1 min. For each kind of tissue, standard curves
were generated for 18S and the CA transcripts over a large
range of template cDNA quantity to calculate the PCR
efficiencies, which are critical for correct quantification.
Data analysis
For each transcript, the efficiency (E) was calculated from
the slope (S) of the standard curve using the formula:
E ¼ 10
À1=s
À 1
Once differences between efficiencies of reference gene and
target gene amplifications were approximately equal (i.e.
did not exceed 5% difference in each tissue), we first
looked at the normalizations of the CA transcripts ampli-
fications compared to the endogenous control amplifica-
tion for each tissue to obtain the normalized number of
cycles (NNC):
NNC ¼ Ct target À Ct 18S
where Ct is the threshold cycle (i.e. the number of cycles
required to reach a same quantity of amplified cDNA dur-
ing the exponential phase).
Then, for relative quantification measurement, we used
the 2
–DDCt
method [38]. For each transcript, the relative
quantification result was obtained by comparing the level
of expression in each tissue with the level of expression in
the calibrator tissue, with the latter being chosen as the tis-
sue for which the better expression was observed, using:
Relative expression level ¼ 2
ÀðNNC
sample
ÀNNC
calibrator
Þ
We also calculated the relative expression level of the tran-
scripts in the tissues of a whole individual and performed
the calculation over several individuals. This could only be
performed in individuals for whom we had at least two tis-
sues to be compared.
RACE
Full-length cDNA was obtained by RACE-PCR from a
branchial plume poly(A) RNA sample. 3¢ Amplification
was conducted according to the manufacturer’s instructions
(Roche Diagnostics, Mannheim, Germany). For the
5¢amplification, the protocol was modified as follows:
poly(A) tailing of first-strand cDNA was replaced by
poly(C) tailing. As a consequence, for the next PCR ampli-
fication, the oligo-dT anchor primer was replaced by an oli-
go-dG primer. Specific internal primers used for the 5¢ and
3¢amplifications and their positions are shown in Table 1.
Sequencing
Plasmid DNA from individual colonies were purified with a
FlexiPrep kit (Amersham) and used in a dye-primer cycle
sequencing reaction with universal primer T3 or T7 and the
Big DyeÒ Terminator V3.1 Cycle Sequencing kit (Applied
Biosystems). Reactions were then run on a 16-capillary
3130 Applied Biosystems sequencer.
S. Sanchez et al. Carbonic anhydrase transcripts in Riftia
FEBS Journal 274 (2007) 5311–5324 ª 2007 The Authors Journal compilation ª 2007 FEBS 5321
Preparation of histological sections
Pieces of branchial plume- and trophosome-tissues were
cryo-embedded in Tissue-teck (Sakura Finetek, Torrence,
CA, USA) and conserved in liquid nitrogen. Sections (5–
7 lm) were made at )25 °C on a Leica CM3050S cryo-
microtome (Leica, Wetzlar, Germany). The sections were
collected on glass slides coated with 2% Biobond (Electron
Microscopy Sciences, Hatfield, PA, USA; supplied by EMS,
Euromedex, Mundolsheim, France). They were deprotei-
nized for 10 min with 0.2 molÆL
)1
HCl at room temperature,
treated for 10 min in 2 · NaCl ⁄ Cit at 70 °C, and rinsed twice
in NaCl ⁄ Pi (0.1 m, pH 7.5, 1100 mOsm) for 5 min. The slides
were then incubated with 50 lgÆmL
)1
Proteinase K (Sigma,
St Louis, MO, USA) for 15 min at 37 °C in a moist chamber
and rinsed twice in cold NaCl ⁄ Pi for 5 min.
Production of the probes for in situ hybridization
Specific oligonucleotides primers (Table 1) were designed
on the basis of the alignment of the two sequences RpCAbr
and RpCAtr. These primers were chosen to amplify a
region overlapping the coding and 3¢ UTR regions for best
specificity (hybridization specificity was checked by dot-
blots; data not shown).
Once fragments of RpCAbr and RpCAtr transcripts were
amplified from branchial plume and trophosome cDNAs,
respectively, migration of PCR products on agarose gel
allowed us to check the size of the amplicons. Then these
PCR products were purified with the High Pure PCR Puri-
fication Kit (Roche Diagnostics) following the manufac-
turer’s instructions.
Different fluorochrome labeling of the probes was chosen
to detect RpCAbr mRNAs and RpCAtr mRNAs by green
and red fluorescence, respectively. The antisense RpCAbr
probe was synthesized by incorporation of DIG-conjugated
UTP from the purified PCR product by a linear amplifica-
tion with reverse primer (RpCAbrR1) with the PCR DIG
Probe Synthesis Kit (Roche Diagnostics). The sense probe
(negative control) was produced with the RpCAbrF primer
by the same procedure. The antisense RpCAtr probe was
synthesized in two steps. First, linear amplification of the
purified PCR product was performed with the reverse
primer RpCAtrR probe only to enrich the PCR product
for antisense RpCAtr fragments. Then, addition of biotin-
16-ddUTP to the 3¢ OH ends of 100 pmol of this cDNA
amplification was performed with the Terminal Transferase
Recombinant (Roche Diagnostics). The sense probe
(negative control) was produced with the RpCAtrF probe
following the same procedure.
In situ hybridization
Sections were prehybridized at 44 °C for 30 min in hybrid-
ization buffer [HB: 0.9 m NaCl, 20 mm Tris-HCL, pH 7.5,
0.01% SDS, 10% dextran sulfate, 2% Blocking Reagent
(BR, Roche Diagnostics), 40% deionized formamide] in a
moist chamber. Then, the probe (15 ngÆlL
)1
in prewarmed
HB) was added to each slide and the hybridization was con-
ducted for 20 h at 44 °C. After three stringent washes with
HHB buffer (20 mm Tris ⁄ HCl pH 7.5, 28 mm NaCl, 0.01%
SDS, 5 mm EDTA) at 46 °C (20 min), 52 °C (20 min) and
46 °C (20 min), hybridizations were blocked with 100 lLof
TNB buffer (0.1 m Tris ⁄ HCl pH 7.5, 0.15 m NaCl, 0.5%
BR) in a moist chamber for 30 min at room temperature.
Fluorescence detection
The Tyramide Amplification Signal (TSA) system (Perkin
Elmer) with the use of horseradish peroxidase gave the best
signal ⁄ background ratio results. To detect the DIG-labeled
RpCAbr probe, anti-DIG-POD (Roche Diagnostics) was
added at a 1 : 100 concentration in TNB buffer. To detect
the biotin-labeled RpCAtr probe, streptavidin- horseradish
peroxidase was added at a 1 : 100 concentration in TNB
buffer. Slides were incubated for 2 h in a moist chamber at
room temperature. Then, they were washed twice for 10 min
each in fresh TNT buffer (0.1 m Tris ⁄ HCl pH 7.5, 0.15 m
NaCl, Tween 20) at room temperature and for 15 min in
TNT buffer at room temperature in the dark. RpCAbr was
detected by a TSA reaction that took place for 30 min at
room temperature in a 1 : 50 dilution of fluorescein tyramide
[green fluorescent in situ hybridization (FISH)] in equal vol-
umes of 1 · Amplification buffer (Perkin Elmer) and 40%
dextran sulfate. RpCAtr was similarly detected in a 1 : 50
dilution of tetramethyl rhodamine (red FISH) in equal
volumes of 1 · Amplification buffer (Perkin Elmer) and
40% dextran sulfate for 30 min at room temperature. Slides
were then washed twice for 20 min each at 55 °C in new pre-
warmed TNT buffer to stop the enzymatic reaction and to
remove dextran sulfate [39]. The nuclei were counter-stained
with a 2 lgÆmL
)1
4¢,6-diamidino-2-phenylindole solution for
10 min. Sections were mounted in Citifluor antifading
reagent (Electron Microscopy Sciences EMS), covered with
coverslips and sealed with nail varnish.
Homologies search, alignment, and phylogenetic
analyses
blast analyses (blastx and blastn) of the cDNA libraries
sequences were conducted on the NCBI server (http://
www.ncbi.nlm.nih.gov/BLAST/). Accession numbers (NCBI
Entrez Proteins) of the sequences used in the phylogenetic
reconstruction are given on the tree presented in Fig. 4. All
metazoan protein sequences used by De Cian et al. [15] for
phylogenetic reconstruction were also used in the present
study. To test the hypothesis of the ‘nonvertebrate’ clade
previously observed by De Cian et al. [15], we added CA
protein sequences from our newly identified RpCAbr trans-
lated sequence as well as sequences from the sea urchin
Carbonic anhydrase transcripts in Riftia S. Sanchez et al.
5322 FEBS Journal 274 (2007) 5311–5324 ª 2007 The Authors Journal compilation ª 2007 FEBS
Strongylocentrotus purpuratus, the nematode C. elegans, the
fruitflies D. melanogaster and D. pseudoobscura, the mos-
quitoes A. aegypti and A. gambiae, the clam T. gigas and
larval sequences from the cnidarian F. scutaria. Finally, we
chose an outgroup comprising a-CAs from a cyanobacteria
(Nostoc sp.) and three proteobacteria (Klebsiella pneumo-
niae, Erwinia carotovora ssp. atroseptica and Neisseria
gonorrhoeae).
All the 44 complete sequences were first automatically
aligned with clustalw [40] in mega 3.1 [41] and the align-
ment was then adjusted visually. The NJ tree was con-
structed under the Dayhoff matrix model (PAM matrix)
[42] and the MP tree was constructed with the close-neigh-
bor-interchange search option. For each method, bootstrap
tests were conducted over 1000 replicates.
Acknowledgements
We wish to thank Dr D. Vaulot’s research group for the
use of their microscope and their useful advice on
FISH-TSA experiments (UMR 7144 CNRS-UPMC
Roscoff, France). We also are grateful to Dr Didier Jol-
livet, chief scientist of the BIOSPEEDO cruise (2004)
and to the crews of the N. O. L’Atalante and the sub-
mersible Nautile for providing the samples used in this
study. We also thank three referees whose remarks have
considerably improved this paper. Funding for this
project was provided by the Re
´
gion Bretagne (PRIR
Symbiose) and by ANR (Deep Oases project # ANR-
06-BDIV-005).
References
1 Jones ML (1985) On the Vestimentifera, new phylum:
six new species, and other taxa, from hydrothermal
vents and elsewhere. Biol Soc Wash Bull 6, 117–158.
2 Childress JJ & Fischer CR (1992) The biology of hydro-
thermal vent animals: physiology, biochemistry and
autotrophic symbioses. Oceanogr Mar Biol Annu Rev
30, 337–441.
3 Goffredi SK, Childress JJ, Lallier FH & Desaulniers
NT (1998) How to be the perfect host: CO
2
and HS
–
accumulation and H
+
elimination in the hydrothermal
vent tubeworm R. pachyptila. Cah Biol Mar 39,
297–300.
4 Childress JJ, Lee RW, Sanders NK, Felbeck H, Oros
DR, Toulmond A, Desbruye
`
res D, Kennicut IIMC &
Brooks J (1993) Inorganic carbon uptake in hydrother-
mal vent tubeworms facilitated by high environmental
pCO
2
. Nature 362, 147–149.
5 Goffredi S, Childress J, Desaulniers N, Lee R, Lallier F
& Hammond D (1997) Inorganic carbon acquisition by
the hydrothermal vent tubeworm Riftia pachyptila
depends upon high external PCO
2
and upon proton-
equivalent ion transport by the worm. J Exp Biol 200,
883–896.
6 Goffredi SK, Girguis PR, Childress JJ & Desaulniers
NT (1999) Physiological functioning of carbonic anhy-
drase in the hydrothermal vent tubeworm Riftia pachyp-
tila. Biol Bull 196, 257–264.
7 Kochevar RE & Childress JJ (1996) Carbonic anhydrase
in deepsea chemoautotrophic symbioses. Mar Biol 125,
375–383.
8 Toulmond A, Lallier FH, De Frescheville J, Childress
JJ, Lee R, Sanders NK & Desbruye
`
res D (1994) Unu-
sual carbon dioxide-combining properties of body fluids
in the hydrothermal vent tubeworm Riftia pachyptila.
Deep Sea Res 10, 1447–1456.
9 Scott KM, Bright M, Macko SA & Fisher CR (1999)
Carbon dioxide use by chemoautotrophic endos-
ymbionts of hydrothermal vent vestimentiferans: Affini-
ties for carbon dioxide, absence of carboxysomes, and
delta super(13)C values. Mar Biol 135, 25–34.
10 Markert S, Arndt C, Felbeck H, Becher D, Sievert SM,
Hu
¨
gler M, Albrecht D, Robidart J, Bench S, Feldman
RA et al. (2007) Physiological proteomics of the uncul-
tured endosymbiont of Riftia pachyptila. Science 315,
247–250.
11 Smith KS, Jakubzick C, Whittam TS & Ferry JG (1999)
Carbonic anhydrase is an ancient enzyme widespread
in prokaryotes. Proc Natl Acad Sci USA 96, 15184–
15189.
12 Raven JA (1991) Implications of inorganic carbon utili-
zation: ecology, evolution, and geochemistry. Can J Bot
69, 908–924.
13 Weis VM, Smith GJ & Muscatine L (1989) A ‘CO
2
supply’ mechanism in zooxanthellate cnidarians: role of
carbonic anhydrase. Mar Biol 100, 195–202.
14 Kochevar RE, Govind NS & Childress JJ (1993)
Identification and characterization of two carbonic
anhydrases from the hydrothermal vent tubeworm
Riftia pachyptila Jones. Mol Mar Biol Biotechnol 2,
10–19.
15 De Cian MC, Bailly X, Morales J, Strub JM, Van
Dorsselaer A & Lallier FH (2003) Characterization of
carbonic anhydrases from Riftia pachyptila , a symbiotic
invertebrate from deep-sea hydrothermal vents. Proteins
51, 327–339.
16 De Cian MC, Andersen AC, Bailly X & Lallier FH
(2003) Expression and localization of carbonic anhydr-
ase and ATPases in the symbiotic tubeworm Riftia
pachyptila. J Exp Biol 206, 399–409.
17 De Cian MC, Andersen AC, Toullec JY, Biegala I,
Caprais JC, Shillito B & Lallier FH (2003) Isolated bac-
teriocyte cell suspensions from the hydrothermal-vent
tubeworm Riftia pachyptila, a potent tool for cellular
physiology in a chemoautotrophic symbiosis. Mar Biol
142, 141–151.
S. Sanchez et al. Carbonic anhydrase transcripts in Riftia
FEBS Journal 274 (2007) 5311–5324 ª 2007 The Authors Journal compilation ª 2007 FEBS 5323
18 Gattiker A, Gasteiger E & Bairoch A (2002) ScanPro-
site: a reference implementation of a PROSITE scan-
ning tool. Appl Bioinf 1, 107–108.
19 Pesole G & Liuni S (1999) Internet resources for the
functional analysis of 5¢- and 3 ¢ end untranslated
regions of eukaryotic mRNA. TIG 15, 378.
20 Weis VM & Reynolds WS (1999) Carbonic anhydrase
expression and synthesis in the sea anemone Anthople-
ura elegantissima are enhanced by the presence of dino-
flagellate symbionts. Physiol Bioch Zool 72, 307–316.
21 Nussbaumer AD, Fisher CR & Bright M (2006) Hori-
zontal endosymbiont transmission in hydrothermal vent
tubeworms. Nature 441, 345–348.
22 Falquet L, Pagni M, Bucher P, Hulo N, Sigrist CJ,
Hofman K & Bairoch A (2002) The PROSITE data-
base, its status in 2002. Nucleic Acids Res 30, 235–238.
23 Vagner S, Galy B & Pyronnet S (2001) Irresistible
IRES. EMBO Rep 2, 893–898.
24 Cre
´
ancier L, Morello D, Mercier P & Prats AC (2000)
Fibroblast growth factor 2 internal ribosome entry site
(IRES) activity ex vivo and in transgenic mice reveals a
stringent tissue-specific regulation. J Cell Biol 150, 275–
281.
25 deBoer ML, Krupp DA & Weis VM (2006) Two atypi-
cal carbonic anhydrase homologs from the planula larva
of the scleractinian coral Fungia scutaria. Biol Bull 211,
18–30.
26 Seron TJ, Hill J & Linser PJ (2004) A GPI-linked car-
bonic anhydrase expressed in the larval mosquito mid-
gut. J Exp Biol 207, 4559–4572.
27 Silverman DN & Lindskog S (1988) The catalytic mech-
anism of carbonic anhydrase: implications of a rate-lim-
iting protolysis of water. Acc Chem Res 21, 30–36.
28 Tu C, Silverman DN, Forsman C, Jonsson BH & Lind-
skog S (1989) Role of histidine 64 in the catalytic mech-
anism of human carbonic anhydrase II studied with a
site-specific mutant. Biochemistry 28, 7913–7918.
29 Liang J-Y & Lipscomb WN (1987) Hydratation of carbon
dioxide by carbonic anhydrase: internal proton transfer
of Zn
2+
-bound HCO
À
3
. Biochemistry 26, 5293–5301.
30 Briganti F, Mangani S, Orioli P, Scozzafava A, Verna-
glione G & Supuran CT (1997) Carbonic anhydrase
activators: X-ray crystallographic and spectroscopic
investigations for the interaction of isozymes I and II
with histamine. Biochemistry 36, 10384–10392.
31 Silverman DN (1991) The catalytic mechanism of car-
bonic anhydrase. Can J Bot 69 , 1070–1078.
32 Hewett-Emmett D, Hopkins PJ, Tashian RE & Czelus-
niak J (1984) Origins and molecular evolution of the
carbonic anhydrase isozymes. Ann NY Acad Sci 429,
388–358.
33 Hewett-Emmett D & Tashian RE (1996) Functional
diversity, conservation, and convergence int he evolu-
tion of the alpha-, beta-, and gamma-carbonic anhydr-
ase gene families. Mol Phylogenet Evol 5, 50–77.
34 del Pilar Corena M, Seron TJ, Lehman HK, Ochrietor
JD, Kohn A, Tu C & Linser PJ (2002) Carbonic
anhydrase in the midgut of larval Aedes aegypti:
cloning, localization and inhibition. J Exp Biol 205,
591–602.
35 Diatchenko L, Lau Y-FC, Campbell AP, Chenchik A,
Moqadam F, Huang B, Lukyanov S, Lukyanov K,
Gurskaya N, Sverdlov ED et al. (1996) Suppression
substractive hydridization: a method for generating dif-
ferentially regulated or tissue-specific cDNA probes and
libraries. Proc Natl Acad Sci USA 93, 6025–6030.
36 Gurskaya NG, Diatchenko L, Chenchik A, Siebert PD,
Khaspekov GL, Lukyanov SA & Sverdlov ED (1996)
Equalizing cDNA subtraction based on selective sup-
pression of polymerase chain reaction: cloning of Jurkat
cell transcripts induced by phytohemaglutinin and phor-
bol 12-myristate 13-acetate. Anal Biochem 240, 90–97.
37 Halanych KM, Lutz RA & Vrijenhoek RC (1998) Evo-
lutionary origins and age of vestimentiferan tube-
worms. Cah Biol Mar 39, 355–358.
38 Livak KJ & Schmittgen TD (2001) Analysis of relative
gene expression data using real-time quantitative PCR
and the 2
–DDCT
method. Methods 25 , 402–408.
39 Not F, Simon N, Biegala IC & Vaulot D (2002) Appli-
cation of fluorescent in situ hybridization coupled with
tyramide signal amplification (FISH-TSA) to assess
eukaryotic picoplankton composition. Aquat Microb
Ecol 28, 157–166.
40 Thompson JD, Higgins DG & Gibson TJ (1994) CLUS-
TAL W: improving the sensitivity of progressive multi-
ple sequence alignment through sequence weighting,
position-specific gap penalties and weight matrix choice.
Nucleic Acids Res 22, 4673–4680.
41 Kumar S, Tamura K & Nei M (2004) MEGA3: inte-
grated software for molecular evolutionary genetics anal-
ysis and sequence alignment. Brief Bioinf 5, 150–163.
42 Dayhoff MO & National Biomedical Research Founda-
tion (1978) Atlas of protein sequence and structure.
National Biomedical Research Foundation, Silver
Spring, MD.
Supplementary material
The following supplementary material is available
online:
Table S1. Best blastx hits obtained for the identifica-
tion of RpCAbr transcript.
This material is available as part of the online article
from
Please note: Blackwell Publishing is not responsible
for the content or functionality of any supplementary
materials supplied by the authors. Any queries (other
than missing material) should be directed to the corre-
sponding author for the article.
Carbonic anhydrase transcripts in Riftia S. Sanchez et al.
5324 FEBS Journal 274 (2007) 5311–5324 ª 2007 The Authors Journal compilation ª 2007 FEBS