Tài liệu Handbook of Networks in Power Systems I docx
Bạn đang xem bản rút gọn của tài liệu. Xem và tải ngay bản đầy đủ của tài liệu tại đây (13.61 MB, 583 trang )
Energy Systems
Series Editor:
Panos M. Pardalos, University of Florida, USA
For further volumes:
/>.
Alexey Sorokin
l
Steffen Rebennack
l
Panos
M. Pardalos
l
Niko A. Iliadis
l
Mario V.F. Pereira
Editors
Handbook of Networks
in Power Systems I
Editors
Alexey Sorokin
University of Florida
Industrial and Systems
Engineering
Weil Hall 303
32611 Gainesville Florida
USA
sorokin@ufl.edu
Steffen Rebennack
Colorado School of Mines
Division of Economics and Business
Engineering Hall
15th Street 816
80401 Golden Colorado
USA
Panos M. Pardalos
University of Florida
Dept. Industrial & Systems
Engineering
Weil Hall 303
32611-6595 Gainesville Florida
USA
pardalos@ufl.edu
Mario V.F. Pereira
Centro Empresarial
Rio Praia de Botafogo
-A-Botafogo 2281701
22250-040 Rio de Janeiro Rio de
Janeiro
Brazil
Niko A. Iliadis
EnerCoRD - Energy Consulting
Research & Development
Plastira Street 4
171 21 Athens
Nea Smyrni
Greece
ISSN 1867-8998 e-ISSN 1867-9005
ISBN 978-3-642-23192-6 e-ISBN 978-3-642-23193-3
DOI 10.1007/978-3-642-23193-3
Springer Heidelberg Dordrecht London New York
Library of Congress Control Number: 2012930379
# Springer-Verlag Berlin Heidelberg 2012
This work is subject to copyright. All rights are reserved, whether the whole or part of the material is
concerned, specifically the rights of translation, reprinting, reuse of illustrations, recitation, broadcasting,
reproduction on microfilm or in any other way, and storage in data banks. Duplication of this publication
or parts thereof is permitted only under the provisions of the German Copyright Law of September 9,
1965, in its current version, and permission for use must always be obtained from Springer. Violations
are liable to prosecution under the German Copyright Law.
The use of general descriptive names, registered names, trademarks, etc. in this publication doesnot imply,
even in the absence of a specific statement, that such names are exempt from the relevant protective
laws and regulations and therefore free for general use.
Printed on acid-free paper
Springer is part of Springer Science+Business Media (www.springer.com)
Handbook of Networks in Power Systems:
Optimization, Modeling, Simulation
and Economic Aspects
This handbook is a continuation of our efforts to gather state-of-the-art research on
power systems topics in Operations Research. Specifically, this handbook focuses
on aspects of power system networks optimization and is, as such, a specialization
of the broader “Handbook of Power Systems I & II,” published by Springer in 2010.
For decades, power systems have been playing an important role in humanity.
Industrialization has made energy consumption an inevitable part of daily life. Due
to our dependence on fuel sources and our large demand for energy, power systems
have become interdependent networks rather than remaining independent energy
producers.
Such dependence h as revealed many potential economic and operational chal-
lenges with energy usage and the need for scientific research in this area. In addition
to fundamental difficulties arising in power systems operation, the industry has
experienced significant economic changes; specifically, the power industry has
transformed from being controlled by government monopolies to becoming deregu-
lated in many countries. Such substantial changes have brought new challenges in
that many market participants maximize their own profit.
The challenges mentioned above are categor ized in this book according to
network type: Electricity Network, Gas Network, and Network Interactions.
Electricity Networks constitute the largest and most varied section of the hand-
book. Electricity has become an inevitable component of human life. An over-
whelming human dependence on electricity presents the challenge of determining a
reliable and secure energy supply. The deregulation of the electricity sector in many
countries introduces financial aspects such as forecasting electricity prices, deter-
mining future investments and increasing the efficiency of the current power grid
through network expansion and transmission switching.
The Gas Networks section of the book addre sses the problem of modeling gas
flow, based on the type of gas, through a pipeline network. The section describes the
v
problem of long-term network expansion as well as the optimal location of network
supplies. Deregulation of the gas sector is becoming common in many countries.
The deregulation presents new decisions to the gas industry including determining
optimal market dispatch and nodal prices.
Network Interactions are common in power systems. This section of the book
addresses the interaction between gas and electricity networks. The development of
natural gas fired power plants has significantly increased interdependence between
these two types of networks.
This handbook is divided into two volumes. The first volume focuses solely on
electricity networks, while the second volume covers gas network s, and network
interactions.
We thank all contributors and anonymous referees for their expertise in
providing constructive comments, which helped to improve the quality of this
volume. Furthermore, we thank the publisher for helping to produce this handbook.
Alexey Sorokin
Steffen Rebennack
Panos M. Pardalos
Niko A. Iliadis
Mario V.F. Pereira
vi Handbook of Networks in Power Systems
Contents
Part I Electricity Network
Models of Strategic Bidding in Electricity Markets Under
Network Constraints 3
Ettore Bompard and Yuchao Ma
Optimization-Based Bidding in Day-Ahead Electricity
Auction Markets: A Review of Models for Power Producers 41
Roy H. Kwon and Daniel Frances
Finding Joint Bidding Strategies for Day-Ahead Electricity
and Related Markets 61
Patricio Rocha and Tapas K. Das
Short-Term Electricity Market Prices: A Review
of Characteristics and Forecasting Methods 89
Hamid Zareipour
Forecasting Prices in Electricity Markets: Needs, Tools
and Limitations 123
H. A. Gil, C. Gómez-Quiles, A. Gómez-Expósito,
and J. Riquelme Santos
ECOTOOL: A general MATLAB Forecasting Too lbox
with Applications to Electricity Markets 151
Diego J. Pedregal, Javier Contreras, and AgustínA.Sánchez de la Nieta
vii
Electricity Markets Simulation: MASCEM Contributions
to the Challenging Reality 173
Zita A. Vale, Hugo Morais, Tiago Pinto, Isabel Prac¸a,
and Carlos Ramos
Differentiated Reliability Pricing Model for Customers
of Distribution Grids 213
Arturas Klementavicius and Virginijus Radzi ukynas
Compromise Scheduling of Bilateral Contracts
in Electricity Market Environment 241
Sergey I. Palamarchuk
Equilibrium Predictions in Wholesale Electricity Markets 263
Talat S. Genc
The Economic Impact of Demand-Response Programs
on Power Systems. A Survey of the State of the Art 281
Adela Conchado and Pedro Linares
Investment Timing, Capacity Sizing, and Technology
Choice of Power Plants 303
Ryuta Takashima, Afzal S. Siddiqui, and Shoji Nakada
Real Options Approach as a Decision-Making Tool
for Project Investments: The Case of Wind Power Generation 323
José I. Mun
˜
oz, Javier Contreras, Javier Caaman
˜
o,
and Pedro F. Correia
Electric Interconnections in the Andes Communi ty:
Threats and Opportunities 345
Enzo Sauma, Samuel Jerardino, Carlos Barria, Rodrigo Marambio,
Alberto Brugman, and José Mejía
Planning Long-Term Network Expansion in Electric
Energy Systems in Multi-area Settings 367
José A. Aguado, Sebastián de la Torre, Javier Contreras,
and A
´
lvaro Martínez
Algorithms and Models for Transmission Expansion Planning 395
Alexey Sorokin, Joseph Portela, and Panos M. Pardalos
viii Contents
An Approximate Dynamic Programming Algorithm for the Allocation
of High-Voltage Transformer Spares in the Electric Grid 435
Johannes Enders, Warren B. Powell, and David Egan
Decentralized Intelligence in Energy Efficient Power Systems 467
Anke Weidlich, Harald Vogt, Wolfgang Krauss, Patrik Spiess, Marek
Jawurek, Martin Johns, and Stamatis Karnouskos
Realizing an Interoperable and Secure Smart Grid
on a National Scale 487
George W. Arnold
Power System Reliability Considerations in Energy Planning 505
Panida Jirutitijaroen and Chanan Singh
Flexible Transmission in the Smart Grid: Optimal
Transmission Switching 523
Kory W. Hedman, Shmuel S. Oren, and Richard P. O’Neill
Power System Ancillary Services 555
Juan Carlos Galvis and Antonio Padilha Feltrin
Index 581
Contents ix
.
Part I
Electricity Network
Models of Strategic Bidding in Electricity
Markets Under Network Constraints
Ettore Bompard and Yuchao Ma
Abstract Starting from the nineties of the last century, competition has been
introduced in the electricity industry around the world, as a tool to increase market
efficiency and decrease prices.
Electricity is a commodity that needs to be traded over a physical network with
strict physical and opera tional constraints that cannot be found in other commodity
markets.
Present electricity markets may be better descr ibed in terms of oligopoly than of
perfect competition from which they may be rather far. In an oligopoly market, the
producer is a market player that shows strategic behavior, submitting offers higher
than the marginal costs, as they under perfect competition, with the aim to maxi-
mize its individual surpluses.
The market clearing price, quantities and the market efficiency depend ing on the
strategic interactions among producers must be taken into account in modeling
competitive electricity markets.
The network constraints provide very specific opportunities of exercising strate-
gic behaviors to the market participants. Game theory provides a conceptual
framework and analytical tool to model such a context.
The mode ling of electricity markets will be presented by discussing the tradi-
tional Game Theory models, such as bertrand, cournot, conjecture supply function,
supply function equilibrium, adapted to be able to capture, in determining the
Nash equilibrium, the network structure of the system in which the market is
E. Bompard (*)
Department of Electrical Engineering, Polytechnic di Torino, Torino, Italy
CERIS-CNR (Institute for Economic Research on Firms and Growth of the National Research
Council), Moncalieri (TO), Italy
e-mail:
Y. Ma
Department of Electronic & Electrical Engineering, University of Strathclyde, Glasgow, UK
e-mail:
A. Sorokin et al. (eds.), Handbook of Networks in Power Systems I,
Energy Systems, DOI 10.1007/978-3-642-23193-3_1,
#
Springer-Verlag Berlin Heidelberg 2012
3
implemented. A formalized representation and a comparison of some of the most
common game theory models will be provided with some conceptual examples.
In addition, some newly proposed approaches for strategic bidding modeling based
on the comple x systems techniques such as Multi Agent systems and Complex
Networks will be mentioned and some related references provided.
Keywords Electricity markets • Game theory • Network constraints • Strategic
bidding
1 Introduction
The electric power industry has over the years been dominated by large state-owned
monopolies that had an overall authority over all the activities in generation,
transmission and distribution of power within their jurisdiction. Chil e is often
considered as the first Country to introduce liberalization in the electricity sector
in 1982. Regulatory reforms of the industry in the United States started in 1978
with the passage of the Public Utility Regulatory Policies Act; regulatory reform
was accelerated over the latter half of the 1990s with the advent of the open access
transmission regime in 1996, the subsequent formation of several large regional
spot markets, later, regional transmission organizations e.g. PJM, 1997, CAISO,
1998, Midwest 2002, etc. [1]. The first initial steps of liberalization of electricity
markets in Scandinavia started in Norway in 1990. Through the subsequent steps of
development through market expansion, the Nordic market became the world’s first
multi-national market that was quite well-functioning [2]. Since 1996 the genera-
tion, distribution and supply of electricity in eastern and southern Australian states
has been amalgamated under the National Electricity Market and in 2009 the
Australian Energy Market Operator (A EMO) has been established. Australia took
the forefront of energy industry reform worldwide, one of the first countries to
establish highly competitive and transparent electricity market s underpinned by
strong governance structures [3]. In UK, The Electricity Pool of England and Wales
was created in 1990 to balance electricity supply and demand, acting as a clearing
house between generation and wholesale. In March 2001 the electricity pool is
replaced by the New Electricity Trading Arrangements (NETA). On 1 April 2005,
British Electricity Trading and Transmission Arrangements (BETTA) is introduced
to replace the NETA in England and Wales, and the separate arrangements that
existed in Scotland and the British Grid System Agreement, to create fully-compet-
itive, British-wide wholesale market for the trading of electricity generation [4].
The justification for introducing competition in the electricity sectors is that in a
monopoly it is not possible to achieve, no matter which market rules are designed,
two important objectives at the same time: to hold down prices to marginal costs
and to maximize efficiency [5]. On the contrary, in a competitive market those two
objectives may be reached by a proper market design and the specification of a
proper set of rules. In this respect, the goal of electric industry restructuring is to
4 E. Bompard and Y. Ma
achieve a better, more efficient allocation of reso urces by increasing the role of
market forces, and simultaneously decreasing the role of regulation. The main
objectives of the reforms are achieved through a clear separation between produc-
tion and sale of electricity and the operation of electric power grid. Based on the
market reform, many market based roles have been penetrating into the electricity
industry in progress with a slight relaxation of the obligation to serve the loads that
has been segregated and assigned to various entities. Among the new roles energy
producers and retailers, brokers, independent system operator (ISO) or transmis-
sion system operator (TSO) are the most popular entities existing in real electricity
markets around the world.
There are two reference paradigms propos ed for electricity markets: pool and
bilateral. Pool electricity markets coordinate the selling and buying activities
through a centralized market place administrated by third entity that may coincide
with the ISO, whilst the bilateral markets the transactions to be contracted between
the seller and buyer directly on a private basis. In the pool paradigm the market
optimum is reached a central decision making run after collecting the offers from
the producers and the bids from the customers while in the bilateral paradigm the
decision making process is distributed among various sellers and buyer that meet in
the marketplace.
Electricity markets are pretty different from other commodity markets mainly
due to the physical constraints related to the network structure that may impact
the market performance. The network constraints and the special features of the
electricity provide the market players an opportunity to behave strategically,
gaming the market, which is very specific this context and cannot be found in
other commodity markets. Strategic bidding behaviours of electricity producers are
widely studied in open literature [6, 7].
Game theo ry is popularly used in investigating the strategic bidding interactions
between the electricity producers. Models based on various games such as Bertrand
[8, 9], Cournot [10–12], Stackelberg [13, 14], Supply Function Equilibrium
[15–17], as well as conjectural supply function [ 18, 19] have been proposed. By
taking into account the network constraints, the strategic bidding behaviors analysis
based on game theory models usually involves a bi-level optimization problem
modeled as a mathematical program with equi librium constraints (MPEC) [20, 21].
The lower level problem of market clearing with the consideration of the network
constraints, i.e. the equilibrium constraints, is inserted in the upper level problem of
the maximization of the producer surplus [22–26]. There has been an intensive
research for efficient solution methods for the MPEC problem, with proposed
solution schemes ranging from specific analytic algorithms to heuristics procedures
[27–32].
However, the strategic interact ions among participants in today’s electricity
markets can be very complicated, due to various aspects such as supply and demand
uncertainties, unit commitment arrangement, multi-rounds auctions in both energy
and ancillary service markets, which are not conveniently modeled by game theory
techniques. An alternative efficient approach for analyzing the strategic bidding and
decision support of the market participants is provided by the multi agent system
Models of Strategic Bidding in Electricity Markets 5
environment [33]. Based on the computational economics approach, several auton-
omous adaptive agent models have been proposed, including those create d by
Anthony J. Bagnall and George D. Smith,[34], Athina C. Tellidou and Anastasios
G. Bakirtzis [35], Sun J. and Tesfatsion L. [36], as well as Isabel Praca and Carlos
Ramos [37]. Recently, the application of evolutionary complex network has been as
well proposed by Ettore B. and Ma Y.C. [38] for modeling the bilateral electricity
markets. Stable networ k structures that can be used to anticipate possible bilateral
transactions in the real market place are developed by the improving path rule of
evolutionary complex network principles. Different stable network structures can
produce the same maximum value of global utility, reflecting the complex and
disordered individual behavior has self-organization properties that produce the
highest market efficiency in terms of the social welfare without the need for a
centralized decision-making authority.
In this chapter, we first outline the basic features of electricity as a commodity
and of electricity markets recalling the basic metrics used for assessing the market
performance. Then we propose a formalized representation of some of the most
common game theory models by taking into account network constraints. A com-
parison study on those game theory models through a unified conceptual example is
investigated, which has not been discussed in open literature so far. Such compari-
son study provides a quantitative assessment on the electricity market performance
affected by the different strategic gaming behaviors of the electricity producers.
Notations
N: Number of network buses
N
l
: Number of network lines
N
G
: Number of generators
N
D
: Number of demand consumers
n: Index of the network bus set N
N¼[1 2,, , n À 1, n, n +1, , N]
l: Index of the network line set ℒ
ℒ ¼ [1 2,, , l À 1, l, l +1, , N
l
]
g: Index of the electricity producer set G
G¼[1, 2, , g–1, g, g +1, , N
G
]
d: Index of the electricity consumer set D
D¼[1, 2, , d–1, d, d +1, , N
D
]
a/b Intercept ($/MW) and slope ($/MW/MW) parameters of the marginal cost curves of
the electricity producers, dim (a) ¼ dim (b) ¼ N
G
 1(a
m
, b
m
refer to marginal
cost curve parameters)
e/h Intercept ($/MW) and slope ($/MW/MW) parameters of the demand curve of the
electricity consumers, dim (e) ¼ dim (h) ¼ N
D
 1
p/q Power production and demand vector, MW, dim(p) ¼ N
G
 1, dim (q) ¼ N
D
 1
I
G
/I
D
All-one-element vector for producers/consumers, dim (I
G
) ¼ N
G
 1, dim
(I
D
) ¼ N
D
 1
P
+
/P
À
Upper and lower production limits of the producers, MW, dim (P
+
) ¼ dim (P
À
) ¼ N
G
 1
H Diagonal matrix formed by the vector h, dim (H) ¼ N
D
 N
D
B
m
Diagonal matrix formed by the vector b
m
, dim (B
m
) ¼ N
G
 N
G
(continued)
6 E. Bompard and Y. Ma
F Flow limits of the transmission lines, MW, dim(F) ¼ N
l
 1
m
+
/m
–
Lagrange multipliers corresponding to the inequality expressions of the line flow,
$/MW, dim (m
+
) ¼ dim (m
–
) ¼ dim (F)
J Matrix of power transfer distribution factors, N
l
 N À 1
J
G
T
, J
D
T
Generator and load buses rows of the transpose of J matrix, respectively,
dim (J
G
T
) ¼ N
G
 N
l
, dim (J
D
T
) ¼ N
D
 N
l
l
G
, l
D
Nodal prices at the generator and load buses, $/MW, dim (l
G
) ¼ N
G
 1,
dim (l
D
) ¼ N
D
 1
l
N
Price at the reference bus N, $/MW
l Average price weighted by the quantity ($/MW), l ¼ (l
G
T
p + l
D
T
q)/
(I
G
T
p + I
D
T
q)
S
g
G
Surplus of producer g, 8g∈G, ($)
S
G
Total surplus of producers ($)
S
d
D
Surplus of consumer d, 8d∈D, ($)
S
D
Total surplus of consumers, ($)
S
M
Merchandise surplus ($)
S
S
Social surplus, S
S
¼ S
G
+ S
D
+ S
M
, ($)
Special operators
m
1
m
2
Matrix multiplication of m
1
and m
2
v
1
· v
2
Element by element multiplication of vector v
1
and vector v
2
(v
1
) Æ (v
2
) Element by element addition or subtraction of vector v
1
and vector v
2
(v
1
) (v
2
): Element by element inequality between vector v
1
and vector v
2
v
1
¼ v
2
: Element by element equality between vector v
1
and vector v
2
v
T
/m
T
: Transpose of vector v/matrix m
m
À1
: Inverse of the matrix m
2 Electricity as a Commodity
Liberalization has been introduced in many economic sectors such as air transpor-
tation, telecommunication with the goal of achieving efficiency though competi-
tion. Electricity is one of the last sectors in which liberalization and competition has
been introduced. Those very specific features of electricity as a commodity, from
one side, and its criticality to the society, from the other, need to be considered
when switching from regulated monopoly to competition. The market modeling
and simulation need to capture those specificities related to the physical constraints
and network structure of the power systems. In this section, we first review the
specific electric power system operation. Then, paradigms of the electri city markets
are elaborated with two reference models, pool and bilateral markets whilst the poor
model is used in this chapter to study the strategic bidding models in an electricity
market.
Models of Strategic Bidding in Electricity Markets 7
2.1 Power Systems Operation
Power systems are composed a transmission system with buses, to which are
connected the generators and the loads, interconnected by lines and transformers
over the meshed network where the power injected by the generators is delivered to
load centers.
The operation of the system should satisfy a set of boundary conditions which
can be addressed by a set of equality and inequality constraints.The equality
constraints assure power balance between the electricity generation and load
demand while inequality constraints define a feasible operation region represented
by the line transmission capacity limits, syst em frequency and bus voltage ranges. If
all the equality and inequality constraints are satisfied the system is operated in its
normal state. The inequality constraints are satisfied with certain security margins
in terms of generation spinning reserve and/or transmission capacity reserve , etc. If
the reserve margin, due to some disturbances, is reduced, the system enters into the
alert state in which the constraints are still satisfied. Preventive control then takes
place to secure again proper security margins. If the preventive control fails or the
disturbance was severe enough the system goes into the emergency state in which
the inequality constraints are not; emergency control actions such as cutting of
faults, rerouting of generation, excitation control, fast-valving, generation tripping,
generation run-back, HVDC (high voltage dc) modulation, and load shedding are
undertaken. If emergency control fails the system will go into the ext remis state
with cascading outages and system islanding. From this state the system operator
to push the system to restorative state, in which the system, matching again
generation and load, is driven back to the normal state [39].
Mathematically, the steady-state power system operation can be expressed as:
s ¼ f ðxÞ¼0 8n 2N
(1)
gðxÞ 0 (2)
where s ¼ s
P
+ js
Q
is the vector of complex power (real and reactive) injection
at each bus n, n ∈N, f (·) is the vector of functions that express the complex power
transferred over the lines connected to each bus and x is the vector of unknown
phasor voltages (magnitudes and angles) at each bus; the group of inequities g(·)
represent the network constraints.
The group of Eq. 1 represents the so called AC power flow model where real and
reactive power determined by both the voltage magnitude and voltage angle at each
bus. The real power balance enforced at each bus is to keep the electricity frequency
at the expected value. Any unbalance of the real power between the electricity
generated and consumed causes the frequency drifting to a new value. The reactive
power balance at each bus is to govern the voltage magnitude, i.e. to generate
capacitive reactive power to restore the voltage magnitude from low value to high
value or to absorb the inductive reactive power to reverse the process.
8 E. Bompard and Y. Ma
The group inequalities (2) include the various limits with respect to the problem
size to be considered. Generally, the voltage magnitude limits and real power flow
limits of the network branches are the two typical conditions imposed to the power
system for operating in a secure normal state. In addition, real and reactive power
generation limits are incorporated to capture the production characteristics of the
electricity generators.
The model can be simplified with some assumptions that lead to a linearized
model that will be introduced in Sect. 3.
2.2 Specific Features of Electricity
Apart from its economic features such as the no-direct-storability, lack of good
substitutes and inelastic demand, the technical peculiarities of the electricity as a
commodity the electricity market a very specific one. Electricity can only be
delivered by wires over a transmission and distribution networks to customers at
the same time when the electricity is generated. Actual power flows of the network
wires are governed by the Kirchhoff laws, which makes transmission of power
different from the transportation of an ordinary commodity in a spatial market. In
addition, network constraints need to be enforced on the trading activities and affect
the market clearing results. The specific features of the electricity are summarized
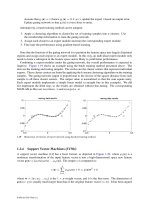
by using the example shown in Fig. 1 where all the parameters are in per unit of
system base value.
• Need for an instantaneous balance between power production and power con-
sumption plus losses. In the example, the total power generated, 0.6024 þ
j0.1842 p.u. is equal to the total power demanded, 0.6 + j 0.1721 p.u., plus
total power loss, 0.0024 + j0.0121 p.u.
• Power flow path depending on the system physical parameters. The paths
followed by the power flows do not coincide with the contract paths of the
economic transactions; almost all the lines, other than that connecting the
generator and the load in the transaction, are involved. If the values of the line
impedances change the power flows over the network change as well.
• Transmission losses. The total real power generated exceeds the real power
demanded by the loads of 0.0024 p.u. and that correspond to the losses on the
transmission system. Gen 1, in this case, need to produce additional 0.0024 p.u.
to balance the real power loss of the network.
• Reactive power support. To allow for the transactions scheduled in terms of
real power, a reactive power support, to balance the reactive power demanded
by the loads and used by the transmission systems, needs to be p rovided by the
generators. The total reactive power demanded by the loads is 0.1721 p.u. while
those totally generated by the two generators is 0.1842 p.u.; the difference is the
reactive power needed by the system to feasibly allow for the transaction
(0.0121 p.u.).
Models of Strategic Bidding in Electricity Markets 9
• Line flow limits. Lines have some limitation on the maximum power they can
transmit due to thermal, voltage drop and stability limits. If the power flow of the
branch from bus 1 to bus 2 reaches its limit, the system should re-route the power
through other lines to be kept feasible.
2.3 Electricity Markets
The energy market in most countries is organized as a day-ahead market (DA)
where the electricity energy transactions are cleared for each hour of the next day.
In day-ahead market, demand is forecasted for each trading interval, e.g. 1 h period,
24 h ahead and offers and bids are received from the market participants. The
market clearing is conducted by an independent body, which may coincide with the
Independent System Operator (ISO), to match demand and supply. In the pool
models the dispatching of injected and withdrawn power quantities are assigned
considering the transmission limits and p roviding, as a by-product, the locational
marginal prices (LMPs), such as in PJM Interconnection, in order to capture the
network impacts on the market clearing [40].
Gen.1
Ld.1 ;
Gen.2
Ld.2 ;
0.2 p.u.
0.2 p.u.
Economic transactions
Gen.2
Ld.1
0.2 p.u.
G
G
0.1517+j0.0794
Gen.1
Gen.2
Ld.2
Ld.1
0.4 + j0.1315 p.u.
0.2024+j0.1104
Z Z
0.1511+j0.0765
0.05074+j0.031
Z
Z
0.05067+j0.0307
0.1493+j0.01 0.1498+j0.0122
0.2489+j0.055
0.2502+j0.0616
0.4 + j0.0738 p.u.
0.2+ j0.0406 p.u.
Bus1
Z = 0.02 + j0.1 p.u.
Physical power flows
V: 1 / 0
V: 0.9959 /- 0.2562 deg.
V: 1 / 0.5914 deg.
V: 0.9891/ -0.7867 deg.
Bus2
Bus3
Bus4
p.u. : per unit of system base value
j: imaginary unit of the complex number
Fig. 1 Network impacts on electric power transactions
10 E. Bompard and Y. Ma
Several related markets concur to make the electricity transactions possible,
including ancillary service market and transmission right market. Ancillary market
is organized to acquire on the market all the services needed for the operation of the
power system as scheduling, system control and dispatch, reactive and voltage
support, regulation and frequency response, energy imbalance, spinning reserves
and supplemental reserves. Transmission right market is designed for auctioning the
right to assure the availability of transfer capability over the network or edge against
the risk of change in transmission cost due to the scarcity of transfer capability.
There are two types of transmission rights: physical transmission rights (PTRs) and
financial transmission rights (FTRs). However, PTRs are gradually replaced by
FTRs, defined upon the locational marginal prices, due to its superiorities over
PTRs by opening the network access to all the market participants. Several of the
restructured US electricity markets have already experimented with styles of the
transmission rights markets in the last decade [41].
Strategic bidding behaviors are extensi vely investigated in the day-ahead energy
market whilst, due to their functional complexity, ancillary markets attract more
technical concerns than the economic behaviors of the market participants. There-
fore, in this chapter we study the strategic bidding behaviors of the electricity
producers in the day-ahead market clearing process.
2.4 Reference Paradigms of the Electricity Markets
A major objective of electricity deregulation is to achieve a workably competitive
wholesale market. Wholesale electricity markets are organized with several gener-
ation companies that compete to sell their electricity in a centralized pool and/or
through bilateral contracts with large electricity buyers [42–44]. The transac-
tions among sellers and buyers can take place in an organized market (“power
exchange”) that collects all the offers from the generators and the bids from the
loads and performs a centralized market clearing compatible wi th the network
constraints, as in the “pool paradigm”; otherwise sellers and buyers arrange, on a
bilateral basis, their own transactions, submitting afterward to an ISO to check their
feasibility in terms of the network constraints as in the “bilateral paradigm.”
A vast majority of studies on electricity markets to date either explicitly or
implicitly assume a centrali zed auction process, administered by a pool, through
which generators sell energy to consumers. A growing number of studies typically
assume a decentralized trading process by which generators sell to consumers
bilaterally through power exchanges or arbitragers [38, 45, 46].
2.4.1 Pool Markets
Many of the restructuring experiences (e.g., in the UK, Argentina, Chile, Australia)
have been based on pool trading with centralized coordination in the Power
Models of Strategic Bidding in Electricity Markets 11
Exchange (PX) by an Independent System Operator (ISO). Examples include
Australia, Argentina, the PJM Interconnection and the New England Power Pool.
In the pool market all producers sell into a pool run by an independent entity.
The ISO has also the responsibility for system reliability and transmission
congestion management. Producers’ physical sales of power and energy trades
are all within the pool. The pool is the only buyer (for the producers) and the
only seller (for the electricity consumers). The ISO holds central auction in which
each generator bids different prices for different quantities (from specifi c plants or
as a portfolio) or an offer curve for the trading period; for example, for each hour of
the following day. Based on the bids and the considered demand quantities, the ISO
uses a security based dispatch process to set the market price and the generation
quantities [42–44].
2.4.2 Bilateral Markets
Under bilateral trading model buyers and sellers individually contract with
each other for power quantities at negotiated prices, terms, and conditions. All
transactions must be announced to the ISO, which analyzes all the trades in each
period and determines, without discrimination, which ones are infeasible for grid
security constraints. The ISO does not need to know the prices and demand side
bids may co-exist with the generation bids. Generally, the bilateral types of markets
are split into two markets named forward contract market (PX) and spot market
(ISO). Two steps are needed to arrange the bilateral trading:
• Step 1: Dispatch without network constraints;
• Step 2: Re-dispatch with consideration of transmission constraints based on the
adjustment offers (demands) from generators and loads, in case that the dispatch
would lead to network constraints violations.
Gen. offers
&
Load demands
Network
structure
Network
constraints
Market
clearing
quantities
& prices
Max
objective
ISO
Ld. 1
POOL
Gen. G
Gen. g
Gen. 1
……
……
Ld. d Ld. D
$
MWh
Fig. 2 Pool type market
12 E. Bompard and Y. Ma
3 Market Equilibrium and Market Performance
Like any commodity or, electrical energy can be bought and sold in an established
market place. Bids, from buyers, and offers, from sellers, set the price in the
electricity markets on the basis of principle of supply/demand intersection. The
difference among electrical energy and other commodities is the delivery system
and the technical features of the framework in which the market transactions are
undertaken.
3.1 Format of the Electricity Supply and Demand
Although it may be different with respect to the functional rules and scopes, most
day-ahead markets consist of unbundled Generation, Transmission and Retailing
sectors that are corresponding to the electricity suppliers, transmission organization
and the electricity customers. A neutral entity called Independent System operator
is introduced to undertake the role of the market coordinator.
For the ele ctricity suppliers, the supply curve is usually represented as an upward
liner or stepwise function that expresses the quantity that all the sellers in a market
are willing to sell as the function of price, as shown in Fig. 4. The increasing trend
of the curve is explained by the fact that as the power offered raises more expensive
unit need to be committed. It is important to note that the supply curve is not
necessarily equal to the marginal cost curve, the additional cost incurred in produc-
ing one extra unit of output, from which the strategic bidding behavior of the
electricity suppliers is originated. The demand curve shows the relationship
between the quantity demanded and the price of a commodity. All other factors
held constant, almost all commodities obey the law of downward-sloping demand,
Max
objective
Min
adjustment
costs
Merit order
based
transactions
Network
structure
Network
constraints
Adjustment
Offers from
Gens and Lds
Security
based
redispatch
Contracts
between
Gens & Lds
ISO
PX
PX
Ld.1
Gen. 1
ISO
PX $
PX MWh
Ld. d
Ld. D
Gen. g
Gen. G
Forward market
Spot market
Bilateral $
Bilateral MWh
Coordination
……
……
Fig. 3 Bilateral type market
Models of Strategic Bidding in Electricity Markets 13
which states that quantity demanded falls as a price rises, Fig. 7. The degree of such
price responsiveness is called demand elasticit y. Under regulation, electricity
demand was considered inelastic (fixed amount with no price responsiveness) and
new capacity was built to cover the projected demand to minimize investment plus
operation costs. Under deregulation, the consumers’ demands for electricity are
encouraged to be price responsive to enhance the wholesale market efficiency and
system reliability [47, 48]. Strategic behaviors from the supply side are more
evident when the demand elasticity of the electricity consumers is low. Improving
demand elasticity plays a positive contribution in mitigating the strategic bidding
behaviors, pushing the uncompetitive electricity market performance towards to a
high level competitive one [49].
3.2 Market Equilibrium
A market is a real or virtual environment in which buyers and sellers interact to
exchange goods, services or commodities; the outcome of a market, from a macro-
scopic viewpoint is the quantity and the price of the good traded.
Given the supply and demand curves, the electricity market is cleared at the
equilibrium at which the market clearing price is established such that the amount
of goods or services sought by buyers is equal to the amount of goods or services
produced by sellers. Graphically, the market equilibrium is represented by the
intersection of the supply curve and the demand curve, point E in Fig. 4. The
equilibrium is established in a price-quantity adjustment process where incremental
quantity of electricity is supplied at the price that demand customers willing to buy,
i.e. the supplier offer price is lower than the demand bid price. Equivalently, the
market clearing can be expressed mathematically as
A
E
Price
Q
Quantity
λ
N
demand curve
supply curve
B
Fig. 4 Electricity supply and demand curves
14 E. Bompard and Y. Ma
Max
1
=
2
q
T
Hq þ q
T
e À
1
=
2
p
T
Bp þ p
T
a
ÀÁ
(3)
s:t: I
D
T
q À I
G
T
p ¼ 0 (4)
The market clearing price, l
N
, in Fig. 4. is the Lagrange multiplier value of the
optimization problem (19)–(20) and can be expressed as
l
N
¼
I
T
G
B
À1
a À I
T
D
H
À1
e
I
T
D
H
À1
I
D
À I
T
G
B
À1
I
G
(5)
The market clearing quantities are
p
g
¼ðl
N
À a
g
Þ=b
g
8g 2G
(6)
q
d
¼ðl
N
À e
d
Þ=h
d
8d 2D (7)
In Eqs. 3–7, the vector of a and the diagonal matrix B indicate the parameters of
the supply curves of the electricity producers. Those parameters are not necessarily
equal to the para meters of the marginal cost curves, i.e. a
m
and B
m
. The strategic
bidding behaviour of the electricity producers can be represented by choosing the
parameters of a and/or B to achieve the economic goals in the market clearing.
3.3 Levels of Competition in the Markets
According to the competition level, market is classified as perfect one or imperfect.
In a perfect competitive market, all sellers and buyers are “price-takers” who
assume that their own production and purchase decisions do not affect the
market price [50]. According to the classic economic theory, a price-taking firm
that wishes to maximize its profits would bid the products at its own marginal cost
[51]. Each supplier submits the marginal cost as supply function and the social
surplus, S
S
, is maximized in the market clearing, as mentioned in the last
section. Price-taking behaviors will lead to the most efficient market operation
characterized by the least cost of the production while meeting the demand of the
consumers. In reality, perfect competition is difficult to be implemented in which-
ever real market due to the strict conditions need to be satisfied, such as a
large number of price-taking producers with a very small market share produce
homogeneous and perfectly substitutable products. Nevertheless it can serve as a
reference case to identify the market power behaviors in a real implemented market
[22, 52, 53].
The opposite situation to perfect competition is monopoly in which just one
producer faces all the market demand. Monopoly market is thought to have no
competition. Perfect competition and monopoly represent the two extreme cases of
Models of Strategic Bidding in Electricity Markets 15