Tài liệu Power Transmission and Distribution docx
Bạn đang xem bản rút gọn của tài liệu. Xem và tải ngay bản đầy đủ của tài liệu tại đây (4.34 MB, 414 trang )
i
Power Transmission
and Distribution
2nd Edition
This page intentionally left blank
iii
Power
Transmission
and Distribution
2nd Edition
Anthony J. Pansini, E.E., P.E.
THE FAIRMONT PRESS, INC.
iv
Library of Congress Cataloging-in-Publication Data
Pansini, Anthony J.
Power transmission and distribution/Anthony J. Pansini 2nd ed.
p. cm.
Includes index.
ISBN: 0-88173-503-5 (print) — 0-88173-504-3 (electronic)
1. Electric power transmission. 2. Electric power distribution. I.
Title.
TK3001.P29 2005
621.319 dc22
2004056439
Power transmission and distribution, second edition/Anthony J. Pansini
©2005 by The Fairmont Press, Inc. All rights reserved. No part of this publication
may be reproduced or transmitted in any form or by any means, electronic or
mechanical, including photocopy, recording, or any information storage and
retrieval system, without permission in writing from the publisher.
Published by The Fairmont Press, Inc.
700 Indian Trail
Lilburn, GA 30047
tel: 770-925-9388; fax: 770-381-9865
Distributed by Marcel Dekker/CRC Press
6000 Broken Sound Parkway NW, Suite 300
Boca Raton, FL 33487
tel: 800-272-7737
Printed in the United States of America
10 9 8 7 6 5 4 3 2 1
0-88173-503-5 (The Fairmont Press, Inc.)
0-8493-5034-4 (Dekker/CRC Press)
While every effort is made to provide dependable information, the publisher,
authors, and editors cannot be held responsible for any errors or omissions.
v
In memory of my parents
in appreciation of their sacrifices
and encouragement
This page intentionally left blank
vii
Contents
Preface to the Original Edition—1990 ix
Preface to the Second Edition—2004 xi
Chapter
1 Introduction, Consumer Characteristics 1
2 Distribution System Electrical Design 13
3 Subtransmission System Electrical Design 91
4 Transmission System Electrical Design 97
5 Electrical Protection 127
6 Direct Current Transmission 149
7 Overhead Mechanical Design and Construction 155
8 Underground Mechanical Design and Construction 211
9 Associated Operations 263
Appendix
A Circuit Analysis 281
B Symmetrical Components 287
C Review of Complex Numbers 343
D Transmission and Distribution
Delivery Systems Efficiencies 345
E Street Lighting—Constant Current Circuitry 349
F Economic Studies 357
G The Grid Coordinate System, Tying Maps to Computers 377
H United States and Metric Relationships 389
Index 391
This page intentionally left blank
ix
Preface to the First Edition
It has been some time since a book was written on power trans-
mission and distribution, a book that can be used as a textbook for
the many for whom this subject, for one reason or another, may be of
interest. In one place, there can be found the electrical, mechanical
and economic considerations associated with the successful planning,
design, construction, maintenance and operation of such electrical sys-
tems.
Simple explanations of materials and equipment describe their
roles in the delivery of power, in small and large quantities, to homes
and offices, farms and factories. They meet the needs of nontechnical
people, including the legal and financial sectors, as well as those
whose interests may involve the promotion of equipment sales and
maintenance, public information, governmental and other functions
and activities. For the neophyte engineer and the seasoned operator,
the practical technical discussion provides reference and review of the
bases and tools employed in meeting the problems that arise in their
daily endeavors. And, finally, the student and researcher will find suf-
ficient theory and mathematical analyses to satisfy their thirst for
knowledge and to impress their neighbors with the depth of their in-
tellect!
Both the young who enjoy the benefits of modern electrical sup-
ply and the older groups who have seen and experienced the remark-
able development made in its transmission and distribution must
recognize that such advances are the work of many to whom a debt
is due. And to some of us who have been given the privilege of mak-
ing even slight contributions, we are grateful for the opportunities af-
forded us during a most enjoyable and fulfilling career.
Thanks are extended to the people who have been helpful along
the way, too many to name individually, and to the staff of The Fair-
mont Press who have aided in the preparation and publishing of this
work. The contributions of material and illustrations by the manufac-
turers for which I am extremely grateful, are especially acknowl-
edged. In any work, errors somehow manage to intrude, and for any
x
of these, I take sole responsibility. Finally, a deep acknowledgment to
my beloved wife for her unstinted support, patience and understand-
ing through the many years in which I have been engaged in this
and kindred endeavors.
Anthony J. Pansini
Waco, Texas
1990
xi
Preface to the Second Edition
Some twenty years have passed since the original publication of
this book, normally sufficient to warrant an updating dictated by events
and heralding the arrival of a new century. The explosion of electroni-
cally operated devices (computers, robots, automatic controls, etc. ) have
required micro refinements in the quality of electric supply that could
not tolerate those associated with the macro commercial supply of this
commodity; necessary corrective actions peculiar to each such application
were (and are) undertaken by the individual consumer. But the continu-
ally increasing dependence on electricity in practically every one of life’s
endeavors also called for improvements in the quality standards of its
supply to which this updating is addressed.
Notable events during this twenty-year period that helped in call-
ing for better quality standards for those elements associated with reli-
ability include the deregulation of electric (and other) utilities, the events
of September 11, 2001, and the blackouts on northeast North America on
August 14, 2004, in the London area and Italian peninsula within two
weeks of each other. And on the positive side, the proliferation of auto-
mation brought about by the blooming electronic technology.
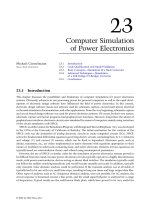
Transmission systems have been the subject of the greater changes.
Under deregulation, their role in the supply chain has been essentially
reversed, from being the back up and peak supplier in generation-based
systems, they become the main source of supply with generation re-
duced to a minimum if not entirely eliminated (to reduce capitalization
and its effect on rate structures in a competitive market) Figure P-1. For
economic and environmental reasons, transmission lines are situated in
areas of sparse population making them subject to the vagaries of man
and nature, tailor made for assaults by vandals and saboteurs. Finally,
with transmission lines connected together in a grid, supposedly for
better reliability and economy, failures causing the outage of a line may
cause another of the lines to trip open from overload, causing another
and another line to “cascade” open until total area blackout occurs.
It appears, quite unexpectedly, that the application of loop circuits
substantially improves the reliability of such transmission lines. Loop
xii
Figure P-1. Simplified schematic diagram of transition from regulated
to deregulated supply systems.
xiii
circuits essentially provide a two way feed to the consumers, insuring
them continuity of service should a fault develop on the circuit (except
for those situated on the section on which the fault occurs) and espe-
cially if both halves of the loop circuit are not mounted on the same
supporting structures. The reliability of the deregulated line is enhanced,
and similarly, the damage inflicted by a saboteur or vandal may be lim-
ited to a section of the line. In the case of the transmission grid, sup-
planting it with a number of loop circuits not only removes the
possibility of lines cascading open from overloads or instability, but
permits the circuits to be loaded nearer their full capacity.
Distribution systems have also been affected by these events, al-
though not in the same manner of vulnerability as transmission systems.
Where additional generation, and/or transmission was not available, or
too great an expenditure to supply some additional distribution loads,
distributed generation made its entry on the scene. Here small generat-
ing units, usually powered by small gas turbines, are connected directly
to the distribution system, in the same manner as larger cogeneration
units. These units may be both consumer- or utility-owned and oper-
ated, and may constitute safety hazards.
The chapter on street lighting is relegated to the appendices not
only as essentially obsolete, but as an example of constant current cir-
cuitry. In its stead is a description of direct-current transmission line
with its positive and negative features, but an excellent future feature in
the electric supply scenario.
A Texas size thank you goes out to all who have directly or indi-
rectly contributed in the publishing of this work and especially to The
Fairmont Press for their help and support.
Introduction, Consumer Characteristics 1
1
Chapter 1
Introduction,
Consumer Characteristics
INTRODUCTION
The system of delivery of electricity to consumers parallels that of
most other commodities. From the generating or manufacturing plant,
this product is usually delivered in wholesale quantities or via transmis-
sion facilities to transmission substations that may be compared to re-
gional warehouses. From there, the products may (or may not
necessarily) be further shipped to jobbers over subtransmission lines to
distribution substations or local depots. The final journey delivers these
products to retailers via distribution systems that supply individual
consumers. One important difference in this comparison is the lack of
storage capability (for practical purposes) of electricity; every unit of
electricity consumed at any moment must be generated at that same
moment. A diagram of an electric utility system indicating the division
of operations is shown in Figure 1-1. This work concerns the transmis-
sion and distribution elements.
Just as many of the larger manufacturing companies began as
small enterprises, so, too, did many of the electric utilities. The first
commercial electric system was constructed and placed in operation in
1882 by Thomas Alva Edison in New York City. It was a direct current
system that served a limited number of consumers in the vicinity of the
plant at a nominal voltage of 100 volts. A number of other small systems
(also direct current) in urban and suburban areas were supplied from the
generating facilities of manufacturing factories. From these maverick
systems that, in some instances, grew like Topsy without planning, the
large utility systems were to be formed. Interestingly, almost a century
later, privately owned generating facilities of industrial and commercial
companies were once again to exercise that same function. The sale of
their excess energy through electrical connections to utility companies’
2 Power Transmission and Distribution
transmission and distribution systems is referred to as “cogeneration,”
and will be discussed more fully later in this work.
The invention of the transformer in 1883 in England by John Gibbs
and Lucien Gaullard, together with the invention of the alternating cur-
rent induction motor and the development of polyphase circuitry in
Figure 1-1. Electric System Divisions—Note Overlap
(Courtesy Westinghouse Electric Co.)
Introduction, Consumer Characteristics 3
1886 by Professor Galileo Ferraris in Turin, opened the way for the adop-
tion of alternating current and the rapid expansion of electrical transmis-
sion and distribution systems. Transmission of electric power dates from
1886 when a line was built at Cerchi, near the city of Turin in Italy, to
transmit some 100 kilowatts 30 kilometers, employing transformers, to
raise and lower a 100 volt source to 2000 volts and back to 100 volts for
utilization. In the same year, the first alternating current distribution
system in the United States, also using transformers, was put into opera-
tion at Great Barrington in Massachusetts: the 100 volt system included
two 50 light and four 25 light transformers serving 13 stores, 2 hotels, 3
doctors’ offices, a barber shop, telephone exchange and post office from
a 500 volt source.
The adoption of alternating current, employing transformers, to-
gether with the general public’s acceptance of the less than pleasing
overhead facilities almost entirely accounts for the unparalleled expan-
sion experienced by the electric industry. The successful combination of
transformer and overhead installations exemplifies a basic solution of
the electrical, mechanical and economic problems associated with the
design of transmission and distribution systems, as well as their con-
struction, maintenance and operation. These three problems, although
subject to independent solutions, interact upon each other.
Electrical design considerations are based generally on acceptable
values of loss in electrical pressure or voltage drop and those of energy
loss. These considerations may be modified to accommodate desired
protection, environmental and other requirements. The permissible val-
ues determine the size of conductors and the associated insulation re-
quirements. The physical characteristics of the conductors impact on the
mechanical designs of such systems.
Mechanical design involves the study of structures and equipment.
It includes the selection of proper materials and their combination into
structures and systems in such a manner as to meet the electrical design
requirements, giving due consideration to matters of strength, safety,
temperature variations, length of life, appearance, maintenance, and
other related factors.
Economic design includes the investigation of relative costs of two
or more possible solutions to the combined electrical and mechanical
requirements. The choice is governed (although not necessarily) not by
the lowest annual carrying charge on the investment in the systems
studied, but by that which is equal (or closest) to the annual cost of
4 Power Transmission and Distribution
losses associated with one of the systems under study. This relationship
is known as Kelvin’s Law. Many factors intrude, however, to modify the
applicable conditions. These factors pertain generally to safety and en-
vironmental requirements as well as provision for possible future de-
mands for electric power, creating changes that may affect the several
components involved in the solution to design problems; for example,
new technology, revised codes and standards, inflation, new reliability
and environmental requirements, etc. The final decision must also sat-
isfy the electrical and mechanical design requirements. These criteria
apply to both the transmission and distribution systems.
Referring to the diagram in Figure 1-1, although it has been cus-
tomary to consider generation, transmission and distribution as three
interdependent elements constituting a single enterprise, as one electric
utility system, financial and conservation considerations have given rise
to consideration of each of the three as separate and distinct enterprises.
Acquisition of each of the three by independent parties could be a means
of diversifying their investments. Problems of cooperation in the opera-
tion of such separately owned systems would affect the consumer, and
could possibly cause the construction of duplicate competitive systems.
In the presentation of the material that follows, it will be assumed
that the reader is familiar with the essentials of electricity, including vec-
tor representation, concerning the properties of both direct and alternat-
ing current circuits, including resistance, inductance, capacitance,
impedance, and their Ohm’s Law relationships.
Although the usual flow of electricity to the consumer is from the
generating plant through the transmission system into the distribution
system, the discussion will treat the delivery system in the reverse order:
starting with the consumer and working toward the central generating
plant.
CONSUMER CHARACTERISTICS
To begin the electrical design of transmission and distribution sys-
tems, it is necessary to know the characteristics of the building blocks
upon which the design of the systems is predicated; that is, the con-
sumer to be served. Obviously, each consumer cannot be considered
independently, but they may be studied as a class and as groups as they
affect the final design of the systems.
Introduction, Consumer Characteristics 5
For convenience, consumers may be broadly classified as residen-
tial, commercial, and industrial. The requirements of each type to be
determined include:
1. The total consumption of electricity over a period of time, (say)
annually.
2. The changes in rate of consumption, (say) hourly, over periods of
time: daily, weekly, monthly, annually.
3. The voltage required for the proper operation of the loads to be
served; the tolerance permitted in the variation of this voltage, and
whether the rapidity of such variations would cause flicker of
lights to result.
4. The reliability requirements of the loads to be served, that is, the
degree of interruption to service, as well as variations in the three
items above, that may be tolerated or permitted.
Electric systems consist essentially of conductors in the form of
wire, terminals, blades of switches or circuit breakers, wires in trans-
formers, motors, and other equipment. The criteria on which their de-
signs are based are two:
1. The permissible drop in voltage or pressure of the electricity flow-
ing through them, and
2. The permissible energy loss caused by electricity flowing through
them, manifested in the form of heat to be dissipated harmlessly.
From Ohm’s Law, the loss in voltage is equal to the product of the
current flowing through a conductor and its resistance:
I current =
E voltage
R resistance
from which, E = IR
Energy loss is the product of power and time; power, however, is
the product of the voltage imposed on the conductor and the current
flowing through it. Again, from Ohm’s Law, this can be derived into the
6 Power Transmission and Distribution
product of the square of the current flowing through the conductor and
its resistance:
P(Power) in watts = E × I; or IR × I = I
2
R
and energy = Power × Time, in watt-hours or kilowatt-hours.
The heat generated must be dissipated if temperature rise is to be
limited to safe values (i.e., before failure results, usually in the insulation
surrounding a conductor). Also, the heat generated represents a loss of
energy for which there is no economic return, and some reasonable
value must be placed on its limits. While standards (and guarantees)
usually specify a definite temperature limit, e.g., 50°C, 70°C, etc., these
figures are not rigid as temperatures (and designs) are affected by am-
bient temperatures, duration of high temperature, including those pre-
ceding the imposition of the condition causing the undesirably high
temperature, effect of wind and other cooling factors, etc. These condi-
tions affect the selection of conductors, transformers, switches, and other
facilities comprising the transmission and distribution systems.
The consumer’s connected load, therefore, becomes the starting
point for the design of such systems. An examination of “typical”
consumer’s connected loads will quickly determine the voltage require-
ments: 120 volts for lighting and many of the appliances and 240 volts
for some of the larger size units; for some large motor loads, polyphase
(usually three phase) voltages of 120/208 volts, 120/240 volts, or 277/
460 volts. This will determine the number of conductors to supply the
consumer’s load: 2, 3 or 4 wires, as well as the value of the associated
insulation.
The size of the conductor is determined by the highest value of
current to be carried. Common sense indicates the consumer will, at
various times throughout the day, be using different combinations of the
units comprising his connected load. The magnitude of the total current
to be supplied over the conductors will, therefore, also vary throughout
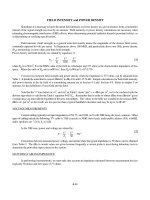
the day. For design purposes, the maximum current is determined by
taking the maximum consumption of electricity over a definite period of
time (usually 15, 30 or 60 minutes) and converting it into current or
amperes, Figure 1-2.
This value may be different for each day of the week, month or
year; hence, the largest of these is taken as the basis for design and is
Introduction, Consumer Characteristics 7
known as the “maximum demand” of the individual consumer. This
factor affects the selection of conductors, transformers and other facili-
ties comprising the distribution system.
Figure 1-2. Load Factor; Maximum Demand
The distinction between the consumer’s demand and connected
load is most important. Connected load is the total of the rated capaci-
ties of all electric appliances, lights, motors, etc., that are connected to
the wiring of a consumer. The actual demand is almost always consid-
erably less than the connected load, because the different units are used
at different times, or, if used at the same time, their peak loads may not
be simultaneous, or in either case, all units may not be loaded to full
capacity at their peak loads. The exception to this is on loads where all
utilization equipment is of the same general type and is used at the same
time and at the same capacity, such as may be found in some manufac-
turing plants, in water or sewer treatment plants, or in street lighting
circuits. The ratio of maximum power demand to total connected load is
called the “demand factor.”
The method of determining the demand factor is also applied to
the loads of a group of consumers. Here, the combined maximum de-
mand of the group is compared to the total of the maximum demands
of each of the members of the group, and this ratio is known as the di-
versity factor, Figure 1-3. For example, a transformer may supply six
consumers whose individual maximum demands total 150 kVA, but
whose combined maximum demand may be only 75 kVA. The diversity
8 Power Transmission and Distribution
factor is 150/75 or 2. It should be noted that the demand factor is de-
fined in such a way that it is always less than 1, while diversity factor
in such a way it is always greater than 1.
Such diversity exists between consumers, between transformers,
between feeders, between substations, etc. It is used in reducing the
required capacity of facilities that would otherwise be required if based
on connected loads or the sum of component load demands only.
Figure 1-3. Diversity Factor
Load Factor
Demand factors and diversity factors, while basic to the design of
distribution circuits, do not include another important element: that of
the use made of the facilities installed, the relationship of consumption
(which is a measure of revenue and return on investment) to the maxi-
mum demand. The consumption can be converted to an average de-
mand by dividing the kilowatt-hours over a stipulated period of time
(day, week, month, year) by the time. The ratio of this average demand
to the maximum demand is known as the load factor (Figure 1-2) and is
an index of the efficiency with which the system or portion of the system
under consideration is utilized; 100 percent load factor or 24 hours per
day at peak load being the maximum possible.
Loss Factor
A companion factor, the ratio of average power loss for a stipulated
period of time (day, week, month, year) to the maximum loss or loss at
peak (15, 30, 60 minutes) during the same period. The distinction be-
Introduction, Consumer Characteristics 9
tween the load factor and loss factor is that the former pertains to loads
(maximum and average) while the latter pertains to losses which are
proportional to the square of the corresponding loads, Figure 1-4.
Equivalent Hours
Associated with the loss factor is a quantity called “equivalent
hours.” It is defined as the average number of hours per day which the
peak load would have to continue to give the same total energy loss as
that given by the variable load (throughout the week, month, year, as the
case may be). Equivalent hours = loss factor × 24. This factor is useful in
determining the cost of energy losses which, in turn, may result in the
installation of more economical larger facilities.
Figure 1-4. Load; Loss; Load Factor; Loss Factor
Another factor, the ratio of the average demand to the installed
capacity is called the use factor, and is an indication of how much of the
investment is used. It is sometimes used in place of the load factor as an
index of the efficiency with which the system under consideration is
utilized.
Power Factor
In alternating current circuits, almost always current and voltage
will be found out of phase with each other; this relation, together with
instantaneous power, and vector representation of these quantities, are
shown in Figure 1-5. When loads are designated in kilowatts, it is essen-
tial also to know the power factor as the capacities of transformers,
10 Power Transmission and Distribution
capacitors, etc., whose ratings are in kilovolt-amperes. Also, line losses
are proportional to the square of the current, and voltage drop propor-
tional to the current.
Power factor, then, is the ratio of power (watts or kilowatts) to the
product of voltage and current (in volt-amperes or kilovolt-amperes). It
is sometimes defined as the ratio of real power to apparent power. From
Figure 1-5
Power factor =
wa
tt
s
EI
= cos
θ
where E = effective voltage, I = effective current, and
θ
is their angular
displacement in phase.
Figure 1 -5. Power Factor
A power factor approaching unity or 100 percent as nearly as pos-
sible, is important in the design of the distribution (and transmission)
system which is dependent on current capacity. For the same current
and the same voltage, the power delivered is directly proportional to the
power factor.
Balance
On three wire, single phase, or direct current, 120/240 volt circuits,
unbalance often occurs between the loads on the two sides of the circuit,
resulting in unbalanced voltages.
Where polyphase (three phase) circuits are employed, usually for
large consumers, loads on each of the phases are likely to be unequal.
Unequal or unbalanced currents produce unequal voltage drops in lines,
transformers, etc., producing unbalanced voltages at the loads that, in
turn, produce unbalanced currents in polyphase equipment, e.g., mo-
Introduction, Consumer Characteristics 11
tors. The unbalance may be expressed as a percentage, or balance factor,
from a nominal base, or from the average of all of the phase voltages.
While phase relations are not indicated, this factor serves as a conve-
nient measure of unbalance.
Coincidence or Diversity Factor
The ratio of the maximum demand of the whole to the sum of the
maximum demands of each of the individual consumers is known as the
coincidence or diversity factor. (Figure 1-3)