Tài liệu Engineers in a Developing Country doc
Bạn đang xem bản rút gọn của tài liệu. Xem và tải ngay bản đầy đủ của tài liệu tại đây (842.14 KB, 116 trang )
fa engineering mono title 2/6/09 2:45 PM Page 1
Composite
C M Y CM MY CY CMY K
Free download from www.hsrcpress.ac.za
Published by HSRC Press
Private Bag X9182, Cape Town, 8000, South Africa
www.hsrcpress.ac.za
First published 2009
ISBN (soft cover) 978-0-7969-2262-5
ISBN (pdf) 978-0-7969-2263-2
© 2009 Human Sciences Research Council
Copyedited by Jacquie Withers
Typeset by Robin Taylor
Cover design by Jenny Young
Printed by
Distributed in Africa by Blue Weaver
Tel: +27 (0) 21 701 4477; Fax: +27 (0) 21 701 7302
www.oneworldbooks.com
Distributed in Europe and the United Kingdom by Eurospan Distribution Services (EDS)
Tel: +44 (0) 20 7240 0856; Fax: +44 (0) 20 7379 0609
www.eurospanbookstore.com
Distributed in North America by Independent Publishers Group (IPG)
Call toll-free: (800) 888 4741; Fax: +1 (312) 337 5985
www.ipgbook.com
Free download from www.hsrcpress.ac.za
Tables and figures iv
Preface vii
Acknowledgements viii
Acronyms and abbreviations ix
1 Thesouthafricanengineeringlabourmarket
andprofessionalmilieu 1
Introduction 1
The labour market context 3
Current employment and employment trends 4
The professional milieu 26
Workforce demand 28
Conclusion 38
2 Theeducationalcontextforengineering
professionals 39
Drivers of change in engineering education 39
Secondary school education 41
Reasons for studying engineering 43
Higher education: the supply of engineering professionals 43
Engineering programmes and the accreditation process 69
Challenges for institutions offering engineering programmes 71
Student access and mobility or articulation 74
Further education and training colleges 76
Learnerships 77
Conclusion 78
3 Womeninengineering 79
Strategies to enhance women’s participation 79
Factors influencing women in choosing engineering 80
Labour market barriers 81
Graduation 82
Employment 84
Conclusion 85
4 Conclusions 87
Recommendations 89
Appendix 95
References 101
Free download from www.hsrcpress.ac.za
iv
Tables
Table 1.1 Total employment of engineering professionals, by occupation and
qualification level (1996–2005) 6
Table 1.2 Total employment of engineering professionals with degrees and National
Diplomas, by field of study (1996–2005) 8
Table 1.3 Distribution of engineers, technologists and technicians, by economic sector
(1996–2005) 12
Table 1.4 Distribution of engineers, technologists and technicians, by public and
private sector (2000 and 2005) 14
Table 1.5 Percentage of people with engineering-related qualifications working as
managers (1997–2005) 17
Table 1.6 Long-term vacancies reported in the Sunday Times (April 2004–March
2007) 29
Table 1.7 Number of vacancies (April 2004–March 2007) 29
Table 2.1 Average annual growth rate: undergraduate engineering enrolment
(1996–2005) 45
Table 2.2 Average annual growth rate: undergraduate engineering graduation
(1996–2005) 47
Table 2.3 Undergraduate graduation trends in engineering fields of study
(1996–2005) 51
Table 2.4 Average annual growth rate: undergraduate engineering professional
enrolment, by race (1996–2005) 55
Table 2.5 Average annual growth rate: undergraduate engineering professional
graduation, by race (1996–2005) 61
Table 2.6 Average annual growth rate: undergraduate engineering professional
enrolment, by gender (1996–2005) 64
Table 2.7 Average annual growth rate: undergraduate engineering professional
graduation, by gender (1996–2005) 67
Table 3.1 Graduation growth at universities (engineers) and universities of technology
(technologists and technicians), by race and gender (1996–2005) 83
Table A.1 Undergraduate and postgraduate graduation trends in engineering fields of
study (1996–2005) 95
Figures
Figure 1.1 Employment trends (averages per two-year period) for engineers and
technologists, and technicians (1996–2005) 10
Figure 1.2 Distribution of managers with engineering-related qualifications, by race
(1997 and 2005) 18
Figure 1.3 Distribution of managers with engineering-related qualifications, by gender
(1997 and 2005) 18
Figure 1.4 Registered engineer to population ratios in South Africa, and developed and
non-African developing countries (2004) 19
Figure 1.5 Registered engineer to population ratios in some African countries
(2004) 20
Free download from www.hsrcpress.ac.za
v
Figure 1.6 Race profiles of engineers and technologists: average for 1996–1999 (OHS)
and 2000–2005 (LFS) 22
Figure 1.7 Race profiles of technicians: average for 1996–1999 (OHS) and 2000–2005
(LFS) 22
Figure 1.8 Gender profiles of engineers and technologists: average for 1996–1999
(OHS) and 2000–2005 (LFS) 22
Figure 1.9 Gender profiles of technicians: average for 1996–1999 (OHS) and 2000–2005
(LFS) 22
Figure 1.10 Age profile of engineers and technologists, and technicians (2005) 24
Figure 1.11 Vacancies for engineers and technologists (April 2004–March 2007) 29
Figure 2.1 Engineering enrolment (1996–2005) 44
Figure 2.2 Engineering graduation (1996–2005) 46
Figure 2.3 Throughput trends for first-time entering engineers (1996–2005) 49
Figure 2.4 Throughput trends for first-time entering technologists (1996–2005) 49
Figure 2.5 Throughput trends for first-time entering technicians (1996–2005) 50
Figure 2.6 Undergraduate engineering student enrolment, by race (1996–2005) 54
Figure 2.7 Enrolment proportions of undergraduate engineering students, by race
(1996 and 2005) 54
Figure 2.8 Undergraduate enrolment of engineer, technologist and technician students,
by race (1996–2005) 55
Figure 2.9 Undergraduate enrolment proportions of engineer, technologist and
technician students, by race (1996 and 2005) 57
Figure 2.10 Undergraduate engineering student total graduation, by race
(1996–2005) 58
Figure 2.11 Graduation proportions of all engineering students, by race (1996 and
2005) 58
Figure 2.12 Engineering graduation levels as a proportion of the population, by race
(1996 and 2005) 59
Figure 2.13 Graduation of engineer, technologist and technician students, by race
(1996–2005) 60
Figure 2.14 Graduation proportions of engineer, technologist and technician students, by
race (1996 and 2005) 60
Figure 2.15 Undergraduate engineering student enrolment, by gender (1996–2005) 62
Figure 2.16 Undergraduate enrolment proportions of all engineering students, by gender
(1996 and 2005) 63
Figure 2.17 Undergraduate enrolment of engineer, technologist and technician students,
by gender (1996–2005) 63
Figure 2.18 Enrolment proportions of engineer, technologist and technician students, by
gender (1996 and 2005) 64
Figure 2.19 Undergraduate engineering student graduation, by gender (1996–2005) 66
Figure 2.20 Graduation proportions of all engineering students, by gender (1996 and
2005) 66
Free download from www.hsrcpress.ac.za
vi
Figure 2.21 Graduation of engineer, technologist and technician students, by gender
(1996–2005) 67
Figure 2.22 Graduation proportions of engineer, technologist and technician students, by
gender (1996 and 2005) 68
Free download from www.hsrcpress.ac.za
vii
This monograph on the engineering profession, and the education of engineering
professionals, is the third in the Human Sciences Research Council (HSRC) series on
professions and professional education. It was preceded by monographs on medical
doctors
1
and social workers.
2
A further monograph on nursing is in the pipeline and
one on artisans is in progress.
The overall study addresses the following broad question: How are professions and
professional education programmes responding to the needs and challenges of a
transforming South Africa? It is recognised that many of the hopes and aspirations
for South Africa’s new democracy depend upon the production of professionals who
have globally competitive knowledge and skills, but are also prepared – in all senses
of the word – to live and work in this country and to contribute to the national
development effort and social transformation.
Each profession is examined through two theoretical lenses:
• Itsprofessionallabourmarkets,bothnationalandinternational,aswellasthe
markets of other competing professions.
• Itsnationalandinternationalprofessionalmilieu,definedasthemultiplesocio-
economic and political conditions, structural arrangements and professional and
educational discourses that shape what it means to be a professional, behaving
professionally, at a particular juncture in history.
The first task in each of the professional studies is to conduct a preliminary scoping
exercise, reviewing major current literature and secondary research, and conducting
preliminary analysis of available statistics and preliminary interviews with key
stakeholders. Key issues are identified and subsequently explored in greater depth,
usually combining quantitative analysis of statistics relating to supply and demand
with qualitative research at selected education institutions, at which the identified
issues are further explored. In this engineering study, the major issues are the
shortage of engineers, the changing demographics of engineering students, and the
impact of increasing numbers of women in engineering education.
One of the features of the professional studies is that statistics are disaggregated
by race as well as gender wherever possible. International literature on professions
barely touches on race issues although the feminisation of professions is addressed.
With our history of enforced racial segregation, it is important to see whether the
racial profiles of the professions are changing. Unfortunately, to do so requires one
to perpetuate the use of the racial classifications that were employed to separate and
discriminate against people during the apartheid era. One can only hope that we will
soon reach the stage where such categorisation is no longer necessary. Certainly the
categories are becoming more difficult to monitor as fewer people are prepared – or
able – to identify themselves racially. In this monograph, we use the terms African,
coloured, Indian and white to denote the different population groups indicated in
the data sources. We use the term black to refer to all population groups other than
white, taken together.
Dr Mignonne Breier
Project Leader
1 Breier M with Wildschut A (2006) Doctors in a divided society: The profession and education of medical practitioners in
South Africa. Cape Town: HSRC Press.
2 Earle N (2007) Social work in social change: The profession and education of social workers in South Africa. Cape Town:
HSRC Press.
Free download from www.hsrcpress.ac.za
viii
In preparing and completing research work on demand and supply in the
engineering field, the ideas of and input from many people were required.
Contributions were made in terms of qualitative and quantitative data as well as
co-operation, support and encouragement of colleagues. Acknowledgement and
thanks go to:
• TheHumanSciencesResearchCouncil(HSRC),formakingthisworkpossible;
• DrVijayReddy,executivedirectorofEducation,ScienceandSkills
Development, for encouragement;
• TheDepartmentofLabour,forfundingarelatedprojectonscarceandcritical
skills that also contributed to this project;
• DrMignonneBreier,projectleaderoftheHSRCProfessionsStudiesofwhich
this research is part, for guidance and valuable input;
• ProfessorJan-HarmCPretorius,deputy-deanoftheFacultyofEngineeringatthe
University of Johannesburg, for insightful feedback on drafts of this monograph;
• AllysonLawless,firstfemalepresidentoftheSouthAfricanInstitutionofCivil
Engineering, for her research work on demand and supply in civil engineering
and her innovative recommendations for addressing the challenges in this field,
and whose work is quoted extensively in this monograph;
• Alltheengineeringprofessionalswhoprovidedinsightsintotheengineering
professional milieu;
• Alltheintervieweeswhomadetimetoprovidevaluableinformation;
• JocelynVass,acolleague,forconstructivecommentsandsuggestions;
• DrJohanErasmus,acolleague,forcreativediscussionsandideas;and
• ErikaMasser,foradministrativeassistance.
Free download from www.hsrcpress.ac.za
ix
ASGISA Accelerated and Shared Growth Initiative for South Africa
BEng Bachelor of Engineering
BSc (Eng) Bachelor of Science in Engineering
BTech Bachelor of Technology
CESA Consulting Engineers South Africa
DoE Department of Education
DST Department of Science and Technology
EASA Engineering Association of South Africa
ECSA Engineering Council of South Africa
ESGB Engineering Standards Generating Body
FET Further Education and Training
HEMIS Higher Education Management Information System
HEQC Higher Education Quality Committee
HSRC Human Sciences Research Council
JIPSA Joint Initiative on Priority Skills Acquisition
LFS Labour Force Survey
MoU Memorandum of Understanding
NDip National Diploma
NQF National Qualifications Framework
NSFAS National Student Financial Aid Scheme
OHS October Household Survey
pa per annum
Prof B Professional Bachelor’s
R&D Research and Development
SAACE South African Association of Consulting Engineers
SAICE South African Institution of Civil Engineering
SAIMC South African Institute of Measurement and Control
SAIRR South African Institute of Race Relations
SET science, engineering and technology
SET4WRG Science, Engineering and Technology for Women Reference Group
SETA Sector Education and Training Authority
UCT University of Cape Town
UNISA University of South Africa
Wits University of the Witwatersrand
Free download from www.hsrcpress.ac.za
Free download from www.hsrcpress.ac.za
1
The South African engineering labour
market and professional milieu
Introduction
This monograph on the work and education of engineering professionals has been
produced at a crucial juncture in the history of engineering in South Africa. The
country is embarking on a massive and very expensive expansion in infrastructure,
partly in preparation for its hosting of the FIFA World Cup in 2010, and is also
investing in upgrading power stations; building roads, airports and harbours;
improving other services at municipal level; and constructing the Gautrain. There
is also a boom in the construction industry. At the same time South Africa is facing
a shortage of engineering capacity, particularly in the public sector, that has been
described as one of the worst capacity and scarce-skills crises in years. As an
indication of the dilemma, it can be noted that South Africa, which is to be sole host
of the 2010 World Cup, has 473 engineers
3
per million citizens while Japan, which
co-hosted the 2002 World Cup along with South Korea, has 3 306. Even compared
to other upper-middle-income countries (developing countries), like Chile (1 460
engineers per million citizens) and Malaysia (1 843 engineers per million citizens),
South Africa’s engineering capacity is low (Lawless 2005). There are many factors
contributing to our situation, including the status and image of the engineering
professions in relation to other, more lucrative careers; the shortage of Grade 12
school leavers who meet the criteria to gain entry to engineering degree programmes;
and the high quality of engineering education (South Africa is one of the countries
that has joined the Washington Accord, which recognises the substantial equivalence
of accreditation systems to assess that the graduates of accredited programmes are
prepared to practise engineering at the professional level) (Jones 2006). The high
quality of engineering education in this country, as also indicated by Professor
Beatrys Lacquet (first female dean of the Faculty of Engineering at the University of
the Witwatersrand [Wits]),
4
and Professor Kader Asmal (then South African minister of
education),
5
ironically ensures that our graduates are in great demand internationally.
These and many other facets of the engineering professions in South Africa come
under the spotlight in this study, which is one of a number of professional case
studies that form part of the HSRC’s research project on professions and professional
education in South Africa. Each study investigates the major current issues in the
profession concerned and considers the ways in which they are being addressed
in educational programmes. The monographs present syntheses of these issues for
public and policy attention.
This study drew on the following sources of data: employment data from Quantec
Research (Pty) Ltd (2007),
6
which includes the October Household Survey (OHS)
for the period 1996–1999, and the September Labour Force Survey (LFS) for the
period 2000–2005; vacancy data from the Department of Labour for the period April
3 This figure includes engineers who are not registered.
4 Meer werk as mense, sê ingenieurs se eerste vroue-dekaan [More work than people, according to first female
dean in engineering], Rapport, 25 March 2007.
5 South Africa’s brain drain dilemma, BBC News, 19 April 2004.
6 Hereafter, simply Quantec.
Free download from www.hsrcpress.ac.za
2
2004–March 2007 (these data were gleaned from all South African vacancies published
weekly in the Business Times Careers section of the Sunday Times, and compiled
for the Department of Labour by Erasmus [2007]); and enrolment and graduation
figures for engineering students from the annual databases of the Higher Education
Management Information System (HEMIS) of the Department of Education (DoE
1996–2005).
It should be noted that there are three main types of engineering professionals in
South Africa: engineers, engineering technologists and engineering technicians. A
fourth designation – of ‘certificated engineer’ – refers to particular certificates that
need to be held for specific roles in mining and industry, and is not discussed here
in further detail. The designation depends first and foremost on the higher education
qualification that has been attained. Engineers hold a four-year Bachelor of Science
in Engineering (BSc [Eng]) or Bachelor of Engineering (BEng) from a university;
technologists hold a Bachelor of Technology (BTech) from a university of technology;
and technicians hold a National Diploma (NDip) from a university of technology.
Throughout this monograph the term ‘engineering professional’ is used to refer to this
collective group, while the term ‘engineer’ refers only to those holding the four-year
university degree.
The monograph begins by considering the broader international context, and drivers
of change for engineering professionals in the South African labour market. This is
followed by an analysis of the current employment situation and employment trends
with regard to engineering professionals in this country. The professional milieu for
engineering professionals in South Africa is then discussed. Chapter 1 concludes with
a discussion of the demand for engineering professionals in the workforce, followed
by general concluding remarks.
The educational context for engineering professionals is provided in Chapter 2,
which starts with a consideration of the drivers of change in the education of
engineering professionals, followed by a discussion of secondary education, reasons
for studying engineering, and the supply of engineering professionals by higher
education institutions (the latter section also provides data on transformation trends).
This is followed by a more in-depth discussion of various engineering programmes
and the accreditation process; challenges for higher education institutions that offer
engineering programmes; issues of student access and mobility or articulation;
engineering training by Further Education and Training (FET) colleges; engineering
training through learnerships; and a concluding section.
Chapter 3 suggests strategies to enhance levels of female participation in engineering;
discusses factors influencing women in choosing engineering as a career; cites barriers
experienced by women in engineering in the labour market; discusses graduation
trends and employment of women in engineering; and provides a concluding
paragraph.
The monograph concludes with a discussion of progress achieved, as well as
the challenges still to be addressed in engineering employment in South Africa.
Chapter 4 also suggests possible interventions and makes recommendations aimed at
overcoming some of the hurdles.
Free download from www.hsrcpress.ac.za
3
The labour market context
It is a worldwide trend that lack of engineering capacity is hampering development,
as stated by, among others, Johan Pienaar, registration manager at the Engineering
Council of South Africa (ECSA);
7
Robbie Venter, CEO of Altron;
8
Hugh Williams, chief
executive of the International Marine Contractors Association;
9
and Sipho Nkosi,
Chamber of Mines president and Exxaro CEO.
10
Japan is running out of engineers
11
and there is a shortage of engineering teachers in India.
12
The shortage of engineers
in South Africa is specifically seen as one of the worst capacity and scarce-skills
crises in years, with local municipalities being hit the hardest (Lawless 2005). South
Africa is currently in a period of extensive expansion in state expenditure, partly
in preparation for its hosting of the FIFA World Cup in 2010 and also in upgrading
power stations, improving other services at municipal level, constructing the Gautrain,
and responding to the boom in the construction industry. Given the new context
of expanded expenditure, particularly in the public sector, there are key questions
to investigate in terms of the demand for and supply of engineering professionals.
Putting infrastructure (roads, power supply, water supply, building construction,
telecommunication networks, and recreational and other assets) in place requires the
input of all engineering fields of study, but particularly civil engineering skills.
In terms of the employment of and demand for engineering professionals in the
South African labour market, two significant drivers have been identified over the
past three decades (Steyn & Daniels 2003). The first driver was the reduction in
agriculture and mining’s share of the GDP, and the second was the relative changes
within sectors with respect to labour productivity and capital intensity. There has
been a reduction in the demand for agricultural and mining engineers and an
increase in the demand for engineers with expertise in manufacturing and service-
related technologies. Substitution shifts in employment took place, away from
the traditional sectors such as agriculture and mining to the manufacturing sector.
Historically, the gold mining industry has been a significant employer of engineers,
but employment levels have decreased substantially in recent years. The negative
growth in agricultural engineering graduations is a concern in a country like South
Africa, where agricultural engineering can contribute to increased productivity to
address food shortages and job creation (Berry 2006).
Steyn and Daniels (2003) also indicate that there was a gradual decrease in the
percentage of engineering professionals in the total labour force between 1994
and 2001. This was in contrast to the expansion of the economy from the mid-
1990s onwards, which should have led to an increase in engineering employment.
However, since the data show employment rather than demand shifts, actual
demand for engineering professionals could be masked by the impact of potentially
significant emigration or changes in organisation of work, such as subcontracting,
which would imply that an individual might not be recorded as an employed
engineer but rather, for example, as a self-employed manager of a firm engaged in
engineering work.
7 SA’s wide engineering gap, Fin24.com, 21 October 2007.
8 Altron CEO Robbie Venter on the skills shortage in SA…, EE Publishers, 21 July 2008.
9 Tackling the offshore skills shortage, SPG Media Limited, 18 October 2007.
10 SA produces more mining skills, but can’t keep up with growth, poaching, Mining Weekly, 22 July 2008.
11 Japan faces engineering shortage, The New York Times, 18 May 2008.
12 Offshore conundrum: India has dire shortage of engineering professors, EE Times, 17 December 2007.
Free download from www.hsrcpress.ac.za
4
Conversely, over the 1996–2005 period, the number of engineers and technologists
showed an average annual growth of 5.91%, as opposed to the 0.74% average annual
growth in formal employment in the total economy over this period (Quantec 2007).
It is, however, exceptionally difficult to come up with authoritative figures or even
estimates with regard to skills shortages or demand for engineering professionals.
The reasons are manifold: the quality of official statistics; double counting of
especially engineering professionals in the Sector Skills Plans of Sector Education
and Training Authorities (SETAs) in the face of infrastructure investment; absence
of a comprehensive national register of qualified engineering professionals (it is
not compulsory for engineering professionals to register with ECSA); the nature
of the world of work for engineering professionals (they are easily absorbed into
non-related industries); and unreliable emigration figures (engineering professionals
maintain their registration status if registered, regardless of where they are working or
what type of work they are doing, and do not necessarily indicate emigration when
they are working overseas for any duration of time).
Employment is usually used as an indicator of the demand for an occupation or
skills. In the absence of regular and consistent survey data based on the needs of
companies that use engineering skills, LFS statistics are used here for the purpose of
analysis of demand for employment. However, it is important to note that these data
can only be used as a proxy for demand.
Current employment and employment trends
This section examines the major characteristics of employed engineering professionals
and considers total employment of engineering professionals holding an engineering
degree (engineers and technologists) or an engineering diploma (technicians);
employment of engineering professionals across the economic sectors; engineering
professionals working as managers; ratios of engineers to technologists to technicians;
the demographic profile of this group in terms of race, gender and age; and
remuneration trends for engineering professionals.
As mentioned, the data used are from the OHS of 1996–1999 and the LFS of 2000–
2005 (Quantec 2007). Both of these surveys are designed and administered by the
South African government’s national statistics agency, Statistics South Africa (Stats SA).
The reason why data from two different data sources (the OHS and the LFS) are
used is because Stats SA terminated the OHS after 1999. The methodology of the two
surveys could have differed slightly, such as in the sampling or the weighting of data.
As a result of the transition from one survey dataset to another, some discontinuity
may be expected between trends expressed in the OHS data (1996–1999), and trends
expressed in the LFS data (2000–2005).
Both the OHS and the LFS are based on samples of the national population. High
annual fluctuations in the number counts are a product of small sample size and the
process of weighting raw data obtained through a sample to approximate national
parameters (Wilson, Woolard & Lee 2004). In order to smooth out fluctuations
in employment trends over the 1996–2005 period, it was decided to calculate an
employment average per annum over the whole period, as well as the averages for
two-year periods over the 1996–2005 time frame to get a smoother graphical trend line.
Free download from www.hsrcpress.ac.za
5
The fluctuations in data are particularly evident when national employment totals are
disaggregated to another category, such as race or gender. In order to smooth effects
of fluctuations when disaggregating data, an average was calculated for the period
covered by each survey. Thus, for the OHS, which ran for a period of four years
(1996–1999), an annual average employment was calculated; the same was done for
the six-year period 2000–2005. It should be apparent that there is not an even split
in the number of years of data between the period before the millennium and the
second period, post-millennium. This is because it was considered more important to
retain the integrity of each series of survey data (OHS 1996–1999 and LFS 2000–2005)
than to group one year of LFS data with the OHS series to create an even, five-year
split for each period.
Total employment of engineering professionals in South Africa
Employment data on engineering professionals show huge fluctuations between
1996 and 2005 (Quantec 2007). To address fluctuations, an employment average per
annum over a 10-year period (1996–2005) was thus calculated (Tables 1.1 and 1.2).
An employment average for two-year periods over the 1996–2005 time frame was
calculated to get a smoother graphical employment trend line (Figure 1.1).
Table 1.1 shows that on average 124 567 people were employed per annum in
engineering professional positions in South Africa over the 1996–2005 period.
Almost a third (39 686) were employed as engineers and technologists and more
than two-thirds (84 881) as technicians. Among those employed as engineers and
technologists, on average 60.98% (24 202) had degrees, 16.79% (6 667) had National
Diplomas and 22.21% (8 817) had only a National Qualifications Framework (NQF)
level 4 or lower qualification. Among those employed as technicians, 3.58% (3 047)
had degrees, 27.91% (23 694) had National Diplomas and more than two-thirds
(58 140) had qualifications at NQF level 4 or lower.
The large average number of 58 140 people who worked as engineering technicians
without the required qualification is noteworthy. This trend relates to the difficulty
that National Diploma students experience in finding industrial placements for their
experiential training year (Interview 2006a; Lawless 2005). This means that such
students do not get the opportunity to work for an employer for the required period
of time in order to complete their experiential training and obtain the necessary
qualifications (Interview 2006a; Interview 2006b). Over the 1996–1999 period, 56.51%
of these underqualified engineering professionals were white and 47.86% were in
the age category 65–69 years; while over the 2000–2005 period, 45.19% of these
underqualified engineering professionals were white and younger than those in the
earlier period (with a quarter in the age category 30–34 years) (Quantec 2007). For
the 1996–1999 period, as these were predominantly older people, this trend could
be explained in terms of people being appointed based on work experience already
gained despite not having appropriate qualifications; while for the 2000–2005 period,
as these were predominantly younger people, it would seem that they were probably
still trying to gain experiential training in order to qualify.
Lawless (2005) found in her civil engineering study that about 60% of final-year
National Diploma students who responded to her survey in October and November
2004 had not had experiential training and therefore could not graduate. The LFS
data would suggest that such people are indeed working in the engineering labour
Free download from www.hsrcpress.ac.za
6
Table 1.1 Total employment of engineering professionals, by occupation and qualification level (1996–2005)
Engineering professionals
employed as engineers &
technologists 1996 1997 1998 1999 2000 2001 2002 2003 2004 2005 Total
Average
employed
pa
Average
annual
growth (%)
Degrees 19 890 15 729 24 153 19 024 22 212 28 272 33 868 23 343 22 181 33 346
242 018
24 202 5.91
National Diplomas 167 10 146 16 977 6 580 7 343 2 813 2 862 2 224 5 818 11 743
66 672
6 667 60.41
NQF level 4 or lower 9 471 12 186 9 523 13 714 10 730 2 671 4 309 4 338 5 121 16 104
88 167
8 817 6.08
Total 29 528 38 061 50 653 39 318 40 285 33 756 41 039 29 905 33 120 61 193 396 858 39 686 8.43
Engineering professionals
employed as technicians 1996 1997 1998 1999 2000 2001 2002 2003 2004 2005 Total
Average
employed
pa
Average
annual
growth (%)
Degrees 2 257 3 089 1 902 3 016 1 107 1 723 2 717 5 810 2 052 6 798
30 471
3 047 13.03
National Diplomas 26 405 8 875 13 330 16 236 29 362 22 848 30 470 24 750 27 222 37 438
236 935
23 694 3.96
NQF level 4 or lower 71 684 10 292 6 958 68 212 52 174 63 623 61 903 68 362 100 549 77 646
581 404
58 140 0.89
Total 100 346 22 256 22 190 87 464 82 644 88 194 95 090 98 922 129 822 121 881 848 810 84 881 2.18
Total employed as
engineering professionals 1996 1997 1998 1999 2000 2001 2002 2003 2004 2005 Total
Average
employed
pa
Average
annual
growth (%)
Total 129 874 60 317 72 843 126 782 122 929 121 950 136 129 128 827 162 942 183 074 1 245 668 124 567 3.89
Source: Quantec (2007)
Free download from www.hsrcpress.ac.za
7
market. Thus, at this level the skills are available, but strategies need to be put in
place to assist such workers to complete the experiential training that would allow
them to obtain their National Diplomas and register as professional engineering
technicians. In this case it is necessary to distinguish between a scarce skill and a skill
gap – these people are almost qualified and working as technicians; they simply need
the opportunity to do their experiential training in order to close the skill gap.
The LFS data further reveal that about 10 000 people with degrees and over 48 000
people with National Diplomas in an engineering-related field were working in
occupational categories ranging from sales worker to machine operator, except for
managers. Furthermore, about 1 600 people with degrees in an engineering-related
field were unemployed, compared to over 10 000 with diplomas in an engineering-
related field. Three-quarters (75.43%) of this unemployed group were black (i.e.
African, coloured or Indian), and well over half (59.08%) were men. Although
unemployment here refers to those who were unemployed with an engineering-
related qualification (which also includes areas such as manufacturing and technology
and not only engineering – as the unemployed in the OHS and LFS datasets cannot
be identified according to purely engineering fields of study), it would be worthwhile
to explore and research this unemployment further, to get a notion of the reasons
why people with an engineering-related qualification are unemployed.
It is important to note that among those employed as engineers and technologists, a
significant number (an average of 6 667 per annum) only had a National Diploma-
level qualification. This finding could be as a result of poor data, coding problems or
incorrect responses, or because an insufficient number of qualified engineers and/or
technologists were available to be appointed, especially at municipal level. According
to Gareth van Onselen, the Democratic Alliance’s head of research in Parliament,
South Africa’s six major metropoles have 732 civil engineering professionals between
them – not all qualified engineers – serving a population of about 15.6 million.
13
For the purposes of the rest of this study we decided to include all National
Diploma-qualified people along with the technicians, and not with the engineers
and technologists. However, in this study technicians with degrees were kept as
technicians. Further analysis in this monograph is based on the 24 202 annual average
employed engineers and technologists with degrees, and the 33 408 annual average
employed technicians with National Diplomas (23 694 plus 6 667) and degrees
(3 047), over the 1996–2005 period.
Looking at the average number of engineers and technologists with degrees working
in a specific year over the 1996–2005 period (Table 1.2), people with civil engineering
degrees represented almost a third (29.30%), mechanical engineers a fifth (20.25%)
and electrical engineers 15.97%. The category ‘not elsewhere classified’ represented
14.64% of total employment of engineers and technologists with degrees and
included engineering fields such as agricultural, industrial and robotics engineering,
according to the South African Standard Classification of Occupations. Electronics
and telecommunications engineers and technologists accounted for 6.35%, while
cartographers and surveyors, mining engineers, chemical engineers, metallurgists and
related professionals represented 4.85%.
13 Engineering a response to SA’s infrastructure woes, Business Day, 5 March 2007.
Free download from www.hsrcpress.ac.za
8
Table 1.2 Total employment of engineering professionals with degrees and National Diplomas, by field of study (1996–2005)
Engineers & technologists
with degrees 1996 1997 1998 1999 2000 2001 2002 2003 2004 2005 Total
Average
employed
pa
Average
annual
growth (%)
Civil 12 065 4 115 7 104 5 264 3 333 9 663 6 616 5 760 5 133 11 870 70 923 7 092 –0.18
Electrical 523 3 942 3 038 1 495 2 218 5 545 3 939 3 618 5 790 8 540 38 649 3 865 36.39
Electronics &
telecommunications 1 804 2 211 0 794 5 416 470 2 911 1 756 0 0 15 361 1 536 * –0.38
Mechanical 1 992 556 7 389 5 026 4 522 7 446 10 327 3 608 5 172 2 959 48 997 4 900 4.49
Chemical 520 616 1 412 1 048 383 969 1 736 2 269 1 074 475 10 502 1 050 –1.00
Mining & metallurgy 0 679 0 890 2 871 801 1 914 1 980 1 058 210 10 403 1 040 ** –13.64
Cartographers & surveyors 527 1 309 1 983 249 1 597 0 909 659 2 375 2 139 11 748 1 175 16.84
Not elsewhere classified 2 459 2 301 3 226 4 258 1 872 3 378 5 516 3 693 1 579 7 153 35 436 3 544 12.60
Total with degrees 19 890 15 729 24 153 19 024 22 212 28 272 33 868 23 343 22 181 33 346 242 018 24 202 5.91
Technicians with National
Diplomas/degrees 1996 1997 1998 1999 2000 2001 2002 2003 2004 2005 Total
Average
employed
pa
Average
annual
growth (%)
Civil 6 279 6 300 5 994 1 182 7 682 4 321 3 816 1 758 1 628 6 543 45 504 4 550 0.46
Electrical 7 529 3 420 7 749 4 124 4 052 3 565 8 868 4 155 6 319 8 772 58 552 5 855 1.71
Electronics &
telecommunications 7 796 2 389 5 741 6 530 8 079 8 376 9 502 16 290 14 714 23 848 103 266 10 327 13.23
Mechanical 2 124 3 286 6 212 6 688 10 411 4 106 7 131 2 023 2 420 11 507 55 909 5 591 20.65
Chemical 0 0 583 1 794 0 676 1 943 0 395 0 5 391 539 *** –6.27
Acidiser 2 339 924 539 0 1 232 1 291 1 339 1 030 2 958 2 470 14 121 1 412 0.61
Draughtsperson 1 449 1 968 2 798 2 180 3 795 4 279 2 950 6 825 5 289 2 562 34 093 3 409 6.54
Not elsewhere classified 1 313 3 823 2 591 3 333 2 562 772 500 705 1 367 277 17 243 1 724 –15.87
Total with National Diplomas/
degrees 28 829 22 110 32 208 25 831 37 813 27 384 36 049 32 784 35 091 55 978 334 078 33 408 7.65
Source: Quantec (2007)
Note: * 1996–2003; ** 1997–2005; *** 1998–2004
Free download from www.hsrcpress.ac.za
9
Considering the annual average number of technicians with National Diplomas/
degrees over the same period, the picture looks very different. Almost a third
(30.91%) held diplomas in electronics and telecommunications engineering, with
electrical engineering technicians accounting for less than a fifth (17.53%), mechanical
engineering technicians 16.74% and civil engineering technicians only 13.62%. This
trend impacts on the ratios of engineers and technologists to technicians in the
different fields. This is especially the case in civil engineering, where there is a
shortage of technicians in proportion to civil engineers, which impacts on service
delivery at municipal level.
Among the degree-qualified engineers and technologists, the number of electrical
engineers and technologists achieved an encouraging average annual growth rate of
36.39%, cartographers and surveyors 16.84%, those not elsewhere classified 12.60%,
and mechanical engineers and technologists 4.49% over the 1996–2005 period.
Negative growth rates were reported over this period for engineers and technologists
in the following categories: mining, metallurgy and related professionals (–13.64%);
chemical (–1%); electronics and telecommunications (–0.38%); and civil (–0.18%).
In contrast to the negative growth in employment for electronics and telecommuni-
cations engineers and technologists, there was an average annual increase of 13.23%
in employment for technicians in this field. The reverse is evident for the electrical
engineering field: slow growth in employment for electrical technicians compared to
very positive growth for electrical engineers and technologists.
For engineers and technologists the electrical engineering field showed the biggest
absolute employment gain over the 1996–2005 period, while for technicians the most
growth was in the field of mechanical engineering.
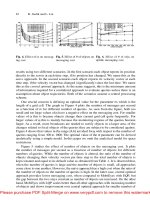
Figure 1.1 provides a picture of the employment trends for engineers, technologists
and technicians over the two-year periods (based on figures in Table 1.2). The
figures show that the average annual growth rate of employment for engineers and
technologists for the full period 1996–2005 was 5.91%. Technicians showed the same
trend as engineers and technologists over the 1996/97 to 2002/03 period; however,
over the 2004/05 period there was a drastic increase in the number of technicians,
contrasting with a decrease in the number of engineers. The average annual growth
in the number of technicians over the whole 1996–2005 period was 7.54% (from
28 829 in 1996 to 55 978 in 2005).
Table 2.2 in Chapter 2 shows that there was also a bigger increase in graduation of
technicians at higher education institutions (2.50% average annual growth) than in
graduation of engineers (1.00% average annual growth) over the 1996–2005 period,
although graduation of technologists (3.73%) increased the most over this period.
Free download from www.hsrcpress.ac.za
10
Figure 1.1 Employment trends (averages per two-year period) for engineers and technologists, and
technicians (1996–2005)
1996/97 1998/99 2000/01 2002/03 2004/05
Engineers & technologists 17 810 21 589 25 242 28 606 27 764
Technicians 25 470 29 020 32 599 34 417 45 535
50 000
45 000
40 000
35 000
30 000
25 000
20 000
15 000
10 000
5 000
0
Average
Source: Quantec (2007)
Employment of engineering professionals: public and private sectors
In order to understand the state of the engineering profession in South Africa, it is
necessary to consider the sectors in which engineers engage. In a broader sense
engineers are at the core of two key areas of development enterprise in the country:
building and maintaining infrastructure in the public sector, and contributing towards
economic growth in the private sector. These are fundamentally different contexts in
terms of the kind of engineering work undertaken and the conditions of employment.
In the public domain, engineers in the employ of the parastatals have always been
involved in the provision of transport, communication and electrification. Those
specifically in the civil engineering field are involved in general urban development
and upgrading of infrastructure and are by and large employed by local or provincial
government. In the private sector, engineers are working in a wide range of
commercial enterprises, including small consulting firms, medium-sized businesses
and large multinational companies. There are also sizeable contingents of engineers
who are not working in the traditional engineering sector. Many of these are active in
the financial and general business sector, as reported in Table 1.3.
Employment distribution across the different economic sectors
Table 1.3 shows that there was substantial ebb and flow in the availability of
engineering employment in the various sectors of the economy between 1996
and 2005. The shifts in employment of engineering professionals in the sectors of
the economy are noteworthy. The dramatic fluctuation within sectors is a good
Free download from www.hsrcpress.ac.za
11
illustration of the intra-sectoral factors affecting employment. These factors usually
relate to the following: the effects of the business cycle; the free enterprise nature of
society (South Africa does not have a planned economy and engineering professionals
deploy themselves in sectors for various reasons); the type of employment
arrangements that exist in the industry; and the nature of supply of skills from the
higher education sector (Interview 2006c; Steyn & Daniels 2003). Stakeholders in
the engineering industry have specifically raised concerns about the employment
arrangements made through labour brokers, particularly for technicians (Interview
2006a; Interview 2006b). The experience is that labour brokers are not committed to
ensuring training and continuity of work for the employees who are on their payrolls.
In the 1990s, when the economy was going through an operating and maintenance
phase, large numbers of technicians were retrenched from state-owned enterprises
such as the power-supply company ESKOM. At the time labour brokers absorbed
these employees, and the tendency is to place them on short contracts in different
work environments across sectors (Interview 2007a).
Over the period 1996–2005 the majority of engineers and technologists worked
in the manufacturing and financial and business services sectors. It makes
sense for engineering professionals to work in manufacturing (24.99%), but it is
significant that, on average, 25.17% worked in finance. The significant number of
engineers employed in the financial and business services sector is an indication
of the proportion of consulting engineers working either for large financial and
management consulting companies or in smaller, independent engineering consulting
operations. It is well known that management consultancies often recruit top
engineering graduates. The South African Association of Consulting Engineers
(SAACE)
14
reports that, over the years, its membership has grown from 30 individual
members (in 1952) to 420 firms in 2002, employing more than 12 500 people in
total (SAACE 2006). The large number of engineers working in the financial and
business services sector may not apply their technical skills, but they assist the
industry with risk management through consulting agencies (Interview 2006d). This
is a controversial issue, which may contribute to the difficulties in dealing with the
shortages in areas where engineers’ skills could be employed more appropriately,
such as in civil engineering, the local authorities and ESKOM.
Construction is a labour-intensive industry that is very dependent on the domestic
market and in which the public sector is dominant. On average per annum only
9.02% of engineering professionals were employed in the construction industry over
the 1996–2005 period. Construction declined throughout the 1990s because of the
government’s policy of curtailing expenditure. In 2005, however, the construction
industry grew at a rate of 4.80% nationally. Table 1.3 reports an increase in
employment from 2003–2005, and this trend continues into the present.
The Accelerated and Shared Growth Initiative for South Africa (ASGISA), with a
capital investment of R372 billion for infrastructure work over the 2006–2010 period,
will surely stimulate and ensure growth of the construction sector. According to Sam
Amod, former president of the South African Institution of Civil Engineering (SAICE),
‘The industry is faced with the prospects of a boom in infrastructure construction and
industrial projects at a time when its skilled resources are reduced to critical levels
and many of its civil engineering professionals are approaching retirement.’
15
Suitably
14 In August 2008 SAACE transformed itself into Consulting Engineers South Africa (CESA).
15 Civil engineering students in demand, Express, 31 March 2006.
Free download from www.hsrcpress.ac.za
12
Table 1.3 Distribution of engineers, technologists and technicians, by economic sector (1996–2005)
Engineers, technologists &
technicians per economic
sector 1996 1997 1998 1999 2000 2001 2002 2003 2004 2005 Total
Average
employed
pa
Average
annual
growth (%)
Engineers & technologists 0 1 013 1 385 1 615 3 133 946 2 282 2 170 1 910 210 14 665 1 466 * –17.87
Technicians 1 852 1 626 2 327 1 256 2 271 2 136 3 053 1 078 734 2 300 18 632 1 863 2.44
Mining & quarrying: Total 1 852 2 639 3 711 2 871 5 405 3 082 5 336 3 248 2 643 2 510 33 296 3 330 3.43
Engineers & technologists 3 841 3 737 3 410 5 314 2 832 11 104 11 906 5 939 6 586 5 906 60 575 6 057 4.90
Technicians 4 951 4 204 4 528 7 454 6 382 7 694 13 251 8 071 8 365 12 360 77 260 7 726 10.70
Manufacturing: Total 8 792 7 941 7 937 12 769 9 214 18 798 25 156 14 010 14 952 18 266 137 835 13 784 8.46
Engineers & technologists 523 3 245 3 502 1 359 843 2 187 1 632 1 828 669 3 473 19 260 1 926 23.41
Technicians 3 720 2 624 7 109 312 1 234 1 056 2 816 648 2 433 2 333 24 284 2 428 –5.05
Electricity, gas & water supply:
Total 4 243 5 869 10 611 1 671 2 077 3 243 4 448 2 476 3 101 5 806 43 545 4 354 3.55
Engineers & technologists 5 532 1 216 5 588 1 471 2 214 3 181 1 351 1 751 1 842 9 013 33 160 3 316 5.57
Technicians 1 327 1 223 3 231 890 3 335 0 1 510 0 4 290 765 16 572 1 657 –5.93
Construction: Total 6 859 2 439 8 819 2 361 5 549 3 181 2 862 1 751 6 132 9 779 49 732 4 973 4.02
Engineers & technologists 760 362 0 1 197 1 100 2 916 0 322 0 0 6 657 666 0.00
Technicians 3 663 1 196 569 1 523 2 948 3 218 4 710 2 105 1 581 6 155 27 667 2 767 5.94
Wholesale & retail trade: Total 4 423 1 558 569 2 720 4 048 6 134 4 710 2 427 1 581 6 155 34 325 3 432 3.74
Engineers & technologists 1 883 891 0 852 2 992 0 3 673 3 944 2 054 3 113 19 402 1 940 5.75
Technicians 7 105 3 107 3 111 6 730 7 506 6 068 3 467 5 566 2 561 6 886 52 107 5 211 –0.35
Transport, storage &
communication: Total 8 988 3 998 3 111 7 582 10 498 6 068 7 139 9 510 4 615 9 999 71 509 7 151 1.19
Engineers & technologists 2 652 2 522 9 827 5 877 9 752 5 271 11 274 4 173 5 361 8 485 65 195 6 519 13.79
Technicians 1 528 3 338 7 951 5 428 11 208 6 429 5 941 11 977 8 699 11 091 73 590 7 359 24.64
Finance: Total 4 180 5 860 17 778 11 305 20 960 11 700 17 215 16 150 14 060 19 576 138 785 13 878 18.71
Engineers & technologists 1 065 1 715 442 634 370 2 302 1 750 2 101 3 760 3 144 17 283 1 728 12.78
Technicians 4 856 3 544 3 383 2 238 1 907 782 1 301 1 541 1 895 3 717 25 164 2 516 –2.93
Community, social & personal
services: Total 5 921 5 259 3 825 2 872 2 277 3 084 3 051 3 642 5 655 6 861 42 447 4 245 1.65
Source: Quantec (2007)
Note: * 1997–2005
Free download from www.hsrcpress.ac.za
13
skilled people will be needed to drive the massive infrastructure programme under
ASGISA, but current skills shortages in local government will impede the rollout of
the programme.
A few initiatives are attempting to address this problem. ECSA and the civil
engineering profession are assisting local governments by mobilising retired engineers
to help the staff of local authorities prepare projects for implementation (Interview
2006c). SAICE and the Local Government SETA are involved in a programme that
awards bursaries to technicians who work in local authorities (and there was quite
a substantial increase in the number of technicians over the 2002–2005 period, as
shown in Figure 1.1). SAICE has signed a Memorandum of Understanding (MoU)
with the Department of Provincial and Local Government to provide capacity in the
hardest-hit local authorities (Interview 2006d). The strategy is to marry an engineering
firm with a local authority in order to build technical and management capacity.
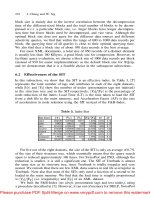
Public–private distribution
A quarter (25.15%) of engineers, technologists and technicians worked in the
public sector in 2000 and mostly for state-owned enterprises (Table 1.4). This figure
decreased to 24.46% by 2005, as the private sector showed more growth than
the public sector at that time. The average annual growth rate for employment of
engineering professionals in the public sector for the period 2000–2005 was 7.68%,
compared to 12.12% in the private sector.
The increase in employment at provincial (23.32% average annual growth) and local
(10.30% average annual growth) government levels is heartening, although 2000–2005
is a short period in which to measure average annual growth. The expansion of
infrastructure spending by government over the next few years will lead to further
demand for engineering professionals in the public sector, but with the current rate
of reported skills shortages it will not be easy to fill the vacancies. There are around
2 000 vacancies in municipalities in South Africa, according to Dawie Botha, speaking
as executive director of SAICE.
16
It is recommended that these vacancies be filled by
teams, each consisting of a recently retired senior engineer and two or three younger
graduates (Lawless 2005).
Growth in both categories (engineers/technologists and technicians) is most probably
as a result of more technologists and technicians (rather than engineers) being
supplied by higher education intitutions, as the number of technologist graduations
increased by an average annual rate of 3.73%, technician graduations by an average
annual rate of 2.50% and engineer graduations by an average annual rate of only
1.00% over the 1996–2005 period (Table 2.2). Furthermore, over the past few
years there has been a decline in ECSA engineer registration and an increase in
technologist/technician registration.
17
Inexperienced technicians and at times non-
technical staff are found running technical departments and project management units
where there are no civil engineers; decisions are thus deferred, not made at all or
made inappropriately (Lawless 2007). Delays in the supply-chain management process
occur because procurement has become centralised rather than the duty of each
department, according to engineers seconded to struggling municipalities.
18
16 Universities running on empty, The Star, 9 August 2008.
17 SAIMC professional development and training, SA Instrumentation and Control, February 2005.
18 Engineers warn of dire straits in local councils, Business Day, 2 March 2007.
Free download from www.hsrcpress.ac.za
14
Table 1.4 Distribution of engineers, technologists and technicians, by public and private sector
(2000 and 2005)
Sector
2000 2005 Average
annual
growth (%)n % n %
All engineering professionals (engineers, technologists & technicians)
Central government 2 103 13.93 1 329 6.08 –8.77
Provincial government 1 107 7.34 3 159 14.46 23.32
Local government 1 240 8.22 2 025 9.27 10.30
State-owned enterprises 10 646 70.52 15 338 70.19 7.58
Total public sector 15 097 100.00 25.15 21 851 100.00 24.46 7.68
Private sector * 38 088 63.45 67 473 75.54 12.12
Unspecified 6 840 11.40 0 0.00
Total 60 025 100.00 89 324 100.00 8.27
Engineers & technologists
Central government 2 103 40.27 1 082 10.02 –12.45
Provincial government 370 7.08 828 7.67 17.50
Local government 0 0.00 809 7.50
State-owned enterprises 2 750 52.65 8 075 74.81 24.04
Total public sector 5 222 100.00 23.51 10 794 100.00 32.37 15.63
Private sector* 13 486 60.71 22 552 67.63 10.83
Unspecified 3 504 15.77 0 0.00
Total 22 212 100.00 33 346 100.00 8.47
Technicians
Central government 0 0.00 247 2.24
Provincial government 738 7.47 2 331 21.08 25.87
Local government 1 240 12.56 1 216 11.00 –0.40
State-owned enterprises 7 896 79.97 7 263 65.69 –1.66
Total public sector 9 874 100.00 26.11 11 057 100.00 19.75 2.29
Private sector * 24 603 65.06 44 921 80.25 12.80
Unspecified 3 336 8.82 0 0.00
Total 37 813 100.00 55 978 100.00 8.16
Source: Quantec (2007)
Notes:
* Including private associations, private business, and self-employed
Data for only 2000 and 2005 were compared, as data before 2000 were not available according to the above sector
breakdown.
Free download from www.hsrcpress.ac.za
15
Engineering professionals working as managers
In the South African context, where there is a serious shortage of managers as
indicated by Professor Eon Smit, quoted in his capacity as director of the University
of Stellenbosch’s Business School,
19
it is often found that engineering professionals
become managers.
20
Following the initial training of engineering professionals,
opportunities to occupy leadership positions usually arise very soon – in most cases
this would involve either a continuation of the technical track or a move to a more
managerial and business-focused position (Case 2006). Engineers are more suited
than others to adapt to the highly pressurised environment of banks’ trading floors,
according to ABSA Capital’s head of trading,
21
and industrial engineers especially
are being snatched by the banking sector, according to Johan Pienaar, registrations
manager at ECSA.
22
Historically, BSc (Eng) graduate engineers have tended to
move more easily into management-level positions than have other engineering
professionals (Case 2006). It is crucially important to note, however, that the
management functions that engineering professionals perform are strongly rooted
in the technical exposure
that they received in the earlier years of their training
(Case 2006).
For example, three decades ago project management was seen mainly
as a sphere of engineering and construction, argues Terry Deacon, an experienced
engineering professional.
23
The levels of leadership that an engineer displays tend to change over the course of
a career (Case 2006). A good example is Danai Magugumela, the first black female
CEO at BKS Consulting Engineers, who started off as a civil engineer with the Texas
Department of Transportation, joined a consulting firm in Cape Town, and later
another consulting engineering group, moved to the public sector for four years as
project manager at the Municipal Infrastructure Investment Unit, and then moved on to
the entrepreneurial environment.
24
Engineers with approximately 10 years’ experience
would be likely to be supervising specific technical work (according to Eddie Durant,
Grinaker-LTA managing director),
25
while many of those with more experience would
be at the helm of large corporate or public sector enterprises (Case 2006). As CEO of
the Coega industrial development zone, Pepi Silinga is an example of a leader with
an engineering qualification, an MBA and development programme experience who
has successfully promoted co-operation between provincial and national government
levels and parastatal enterprises by ensuring delivery to communities.
26
As shown
in Table 1.5, on average just over a quarter of those with a professional engineering
qualification worked as managers during the period 1997–2005; the number of
engineers working as managers almost doubled over this period.
Only around half of those trained to be engineers end up doing engineering work,
while the other half work in other industries, according to Alec Erwin, minister of
public enterprises at the time.
27
Engineers are poached by other industries because of
19 A shortage of managers, Mail & Guardian, 11–17 April 2008.
20 The ten best-paid jobs in South Africa, Citizen, 28 November 2006.
21 ABSA Capital puts spanner in engineer booster plan, Business Report, 10 July 2008.
22 SA’s wide engineering gap, Fin24.com, 21 October 2007.
23 Keeping things on track, Mail & Guardian, 1–7 August 2008.
24 Engineering transformation: ‘Retain talent irrespective of race or gender’, Engineering News, 23–29 June 2006.
25 Skills shortage is genuine threat to growth, say bosses, Business Report, 24 May 2007.
26 The captain of Coega’s ship, Enterprise, 30 November 2005.
27 Regstel-aksie is dood, sê Erwin [Affirmative action no longer exists, says Erwin], Beeld, 12 July 2007.
Free download from www.hsrcpress.ac.za