Tài liệu Car-tastrophe - How federal policy can help, not hinder, the greening of the automobile ppt
Bạn đang xem bản rút gọn của tài liệu. Xem và tải ngay bản đầy đủ của tài liệu tại đây (1.1 MB, 29 trang )
Car-tastrophe
How federal policy can help, not hinder,
the greening of the automobile
By Amy Kaleita, Ph.D.
Car-tastrophe
How federal policy can help, not hinder,
the greening of the automobile
By Amy Kaleita, Ph.D.
4
Car-tastrophe
How federal policy can help, not hinder, the greening of the automobile
By Amy Kaleita, Ph.D.
January 2011
Pacific Research Institute
One Embarcadero Center, Suite 350
San Francisco, CA 94111
Tel: 415-989-0833/ 800-276-7600
Fax: 415-989-2411
Email: info@pacificresearch.org
www.pacificresearch.org
Download copies of this study at www.pacificresearch.org.
Nothing contained in this report is to be construed as necessarily reflecting the views of the Pacific
Research Institute or as an attempt to thwart or aid the passage of any legislation.
©2011 Pacific Research Institute. All rights reserved. No part of this publication may be reproduced,
stored in a retrieval system, or transmitted in any form or by any means, electronic, mechanical, photo-
copy, recording, or otherwise, without prior written consent of the publisher.
5
Contents
Acknowledgements 7
Introduction 9
GHG emissions from dierent vehicle power types 12
Figure 1. A life cycle GHG emission of conventional vehicles 12
EVs, PHEVs and the electricity grid 13
Figure 2. Percent of energy generated within each state that comes from coal. 14
Figure 3. Percent of energy generated within each state that comes from low-carbon sources 14
Incentivizing EVs, PHEVs, and hybrids 16
Fueling conventional vehicles 18
Incentivizing biofuels 20
Recommendations 22
References 24
About the author 27
Statement of Research Quality 28
About PRI 29
6
7
Acknowledgements
The author would like to thank all the organizations and individuals who contribute to PRI’s
environmental studies. Without their nancial support this study could not have been completed. The
author would like to acknowledge Ken Green of the American Enterprise Institute and Joel Schwartz
for their formal review of this study. Any remaining errors or omissions are the sole responsibility of
the author. As the author of this study has worked independently, her views and conclusions do not
necessarily represent those of the board, supporters, or sta of PRI.
8
9
Introduction
With the upcoming introduction of plug-in vehicles such as the Chevy Volt and the Nissan Leaf, interest
and enthusiasm for electric vehicles (either fully electric, or plug-in electric with a supplemental internal
combustion engine) are gaining steam. A March 2010 Consumer Reports poll indicated that more than
a quarter of consumers are likely to consider a plug-in electric car the next time they are shopping for
a new vehicle (7 percent claimed they were “very likely”) – a surprisingly high number given the fact
that these vehicles were not even readily available at the time of the poll. In a 2009 Rasmussen poll, 40
percent of those surveyed indicated they are at least somewhat likely to actually buy an all-electric car
within the next decade, while 21 percent said it was somewhat likely that the next car they buy will be
all-electric.
Much of the interest is based in large part on the perceived
potential of these vehicles to decrease the “environmental
footprint” of driving a car in America, with much of the focus
on greenhouse gas emissions. The transportation footprint is
signicant. Approximately one-third of U.S. emissions of carbon
dioxide (CO
2
), the most common of the greenhouse gases credited
with contributing to climate change, come from the transportation
sector as a whole (all vehicles whose primary purpose is to
transport people or goods). More than 90 percent of that is
associated with burning of petroleum fuel (USDOE, 2009).
The United States does not have the population density to support widespread pubic transportation
for intercity travel, and only some urban areas can support ecient intra-city public transportation.
Therefore, for much of this country, cars are the primary mode of personal transportation and are all
but certain to remain so, at least for the foreseeable future.
For much of this country,
cars are the primary mode
of personal transportation
and are all but certain to
remain so, at least for the
foreseeable future.
10
Finding ways to “green” the American car culture is thus of interest to many people. Unfortunately,
many policies designed to accomplish that may well wind up doing the exact opposite. This paper
explores the environmental implications of several commercially available vehicle and fuel types, and
identies where policies could be improved to result in net benets to Americans. The paper ends with
some guiding principles for limiting the true environmental footprint of driving in America.
Today, consumers have a multitude of vehicle options, from what is under
the hood to what – if anything – is in the tank. Assessing the environmental
impact of the variety of choices is not simple.
Plug-in hybrid electric vehicles (PHEVs) operating in parallel can use
either an on-board battery, charged with electricity from the grid, or an
engine that burns liquid fuel. Fully electric vehicles (EVs) use only the
charged battery for power. PHEVs also have an advantage in their internal
combustion engine (ICE), which give such vehicles a range (how far the
car can go before it must be refueled and/or recharged) similar to that of
conventional vehicles.
Vehicles that travel fewer than about 30 miles per day account for 60 percent of daily passenger vehicle
miles in the United States (US DOT 2004). The limited range of fully electric vehicles, therefore, would
perhaps not be a major problem for many drivers. The Consumer Reports poll indicated that the median
range desired by consumers is 89 miles, while nearly half of respondents would be satised with a
range less than 75 miles (29 percent would even be satised with a range of less than 49 miles).
It is dicult to generalize about the operational
characteristics of the variations of PHEVs and EVs
currently or soon to be on the market, because they are
quite dierent. The PHEV Chevrolet Volt, set to debut in
late 2010 (early 2011 in many markets), has a lithium-ion
battery and, according to GM, a typical electric range of
25-50 miles “depending on terrain, driving technique,
temperature, and battery age.” (GM, 2010) A 10-hour
charge time, depending on climate, is required on
standard 120-volt power, or down to four hours on a
dedicated 240-volt line, according to Chevrolet’s Volt Web
site (
The fully electric Nissan Leaf has only a lithium-ion battery and has a range of about 60-140 miles,
according to Nissan’s testing (Automotive News, 2010). About 20 hours are then required to recharge
the vehicle on 120-volt power, or about seven hours on a 240 volt line ( />Gas stations are
ubiquitous and
oer fast refueling.
Charging stations,
on the other hand,
are not, and do not.
The cars themselves have
no emissions of
greenhouses gases
or air pollutants, but
generating the
electricity that charges the
battery usually does.
11
Plug-in hybrids
oer surprisingly
little GHG
reductions over
conventional
vehicles in places
where coal is
the dominant
electricity source.
electric-car/faq/list/charging). Toyota has announced plans to oer a plug-in hybrid Prius in 2012, with a
small lithium-ion battery and a commensurately small all-electric range of 13 miles.
For all plug-in vehicles, hilly terrain, aggressive driving, stop-and-go trac,
and hot or cold temperatures will limit the electric range to the shorter end.
A driver in bumper-to-bumper trac in Phoenix in mid-summer with the air
conditioner on will certainly not get the same range as a driver in leisurely
countryside driving outside Sacramento in autumn. While conventional
vehicles also get variable miles per gallon of fuel depending on the
situation, the implications of the wide range of electric distances are more
troublesome for EVs (and for PHEVs if the driver wants to do most driving
in electric mode). For one thing, gas stations are ubiquitous and oer fast
refueling. Charging stations, on the other hand, are not, and do not. Nissan’s
FAQ on charging the Leaf indicates that even at a 480-volt “quick-charging
station,” a charge would take 30 minutes.
The variability in actual range performance also makes it dicult to assess
the overall impact of PHEVs and EVs on the environmental footprint of
the car, because it depends very much on the expected electric range of the vehicle. Furthermore, in
accounting for the impact of PHEVs and EVs on the environment, one must also consider that in electric
mode, the cars themselves have no emissions of greenhouses gases or air pollutants, but generating
the electricity that charges the battery usually does.
12
GHG emissions from
different vehicle
power types
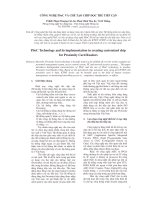
A 2008 study (Samaras and Meisterling, 2008) attempted to capture these dynamics in a full life-cycle
assessment of PHEVs, compared to conventional internal combustion engine vehicles (ICEVs) and
regular hybrids (Figure 1). Using greenhouse gas emissions as a metric, the researchers found that plug-
in hybrids oer surprisingly little GHG reductions over conventional vehicles in places where coal is the
dominant electricity source, particularly for longer-range electric operation. Furthermore, where coal
is dominant, PHEVs signicantly increase net GHG emissions over hybrid vehicles. In order for PHEVs
to oer any signicant advantages over conventional engines or hybrids, low-CO
2
-emissions electricity
must predominate.
Figure 1. A life cycle GHG emission (g CO2-eq/km) of conventional vehicles (CVs) with 30 mpg fuel economy, hybrid
electric vehicles (HEVs), and plug-in hybrid electric vehicles (PHEVs) with all-electric ranges of 30 km (19 mi), 60 km (37
mi), and 90 km (56 mi), and 45 mpg fuel economy for the liquid fuel operation. For the PHEV vehicles, the current GHG-
intensity of the US electric power portfolio is used to determine the vehicle life cycle emissions, and uncertainty bars
represent changes in total emissions under carbon-intensive electricity (where coal is the dominant electricity source) or
low-carbon electricity (where wind, hydro, nuclear, or coal with carbon capture or sequestration are signicant energy
sources). From Samaras & Meisterling, 2008.
13
Other researchers have come to the same conclusions. A study
at Carnegie Mellon determined that with today’s average U.S.
electricity portfolio, PHEVs are only cost-competitive and more
environmentally sound than other options when they are short-
range vehicles charged every 20 miles or less (Shiau et al., 2009).
In an environmental and economic comparison of various vehicle
types, including conventional vehicles, hybrids, and electric
vehicles, Canadian researchers found that electric cars are only
benecial when the electricity is generated on-board or when
the car is charged with electricity generated from no- to low-
carbon sources (Granovskii et al., 2006). Such sources include nuclear, hydroelectric, wind, solar, and
geothermal, or coal with carbon capture or sequestration.
EVs, PHEVs and the
electricity grid
According to the U.S. Department of Energy, such low-carbon electricity sources are atypical. In 2008,
48 percent of the megawatt-hours of electricity generated in the United States were from coal, and
an additional 21 percent from natural gas (EIA 2010). Regions where coal-red generators dominate
electricity production have the highest rates of CO
2
emissions per megawatt-hour, and while natural gas
has about 45 percent lower carbon content than coal, natural gas is not a low-carbon electricity source
either.
For a regional breakdown, gure 2 shows the percent of total electricity generated in each state from
coal. Coal is less than 40 percent of the electricity source in only 20 states and less than 30 percent in
only 16 states.
In only 12 states
is more than
40 percent of the
total electricity
generated from
low-carbon sources.
14
Figure 2. Percent of energy generated within each state that comes from coal. Data from the U.S. Department of Energy
(EIA 2010).
Figure 3. Percent of energy generated within each state that comes from low-carbon sources (nuclear, hydroelectric,
wind, solar, and geothermal). Data from the U.S. Department of Energy (EIA 2010).
15
If plug-in vehicles
should become wildly
popular, at some
point increased
electricity generation
capacity would have
to follow.
In fact, in only 12 states is more than 40 percent of the total electricity
generated from low-carbon sources, as shown in gure 3. Certainly,
there is room for development of more widespread low-carbon
electricity generation but it is not at all clear how exactly that should be
accomplished. Carbon capture and sequestration at the coal plants is a
possibility, but only small-scale capture or sequestration pilot projects
exist right now, and it remains to be seen whether this approach will be
cost-eective.
Wind and solar are not likely to comprise signicant and reliable sources
in the near term, and at this time are not economically competitive
without signicant price supports in the form of federal, state, and local
incentives and subsidies. Hydroelectric power is limited to places with
sucient natural resources for surface water storage and ow capacity. Nuclear power, of course, is
not without its critics.
But if plug-in vehicles should become wildly popular, at some point increased electricity generation
capacity would have to follow, particularly in regions where electricity generation is already near
capacity or where it is unlikely that all charging will occur during o-peak hours (Hadley and Tsvetkova,
2009). Given the availability and feasibility of generation sources, it’s unlikely that all the increased
capacity would come from no- or low-emission sources. In one detailed study of the hourly impact of
widespread PHEV deployment on the western U.S. electricity grid (California and the Pacic Northwest
– currently a region with relatively low carbon intensity), researchers found that compared to the
baseline case of no PHEV deployment, PHEVs led to increased grid emissions of greenhouse gases, non-
methane total organic compounds, and carbon monoxide (Jansen et al., 2010).
16
Incentivizing EVs, PHEVs,
and hybrids
Clearly, plug-in cars are only “green” for a limited number of situations, considering both regional
electricity mix and driving habits. Nevertheless, this has not prevented policymakers from rushing
headlong into incentivizing widespread adoption of electric vehicles.
The International Energy Agency recommends incentives to encourage people to purchase PHEVs or
fully electric plug-ins (IEA, 2009). Domestically, President Obama has stated a goal of putting 1 million
plug-in hybrids on the road by 2015. The 2009 American Recovery and Reinvestment Act included
tax credits for consumer purchases of EVs and PHEVs (US DOE, 2010), and up to $2 billion in research
and development funds (Pew Center, 2009). Up to $400 million has been set aside for transportation
electrication demonstration and deployment projects (Pew Center, 2009).
Despite repeated research showing that the benets of PHEVs are, for the most part, limited to small-
capacity vehicles, the U.S. Department of Energy has entered a partnership, up to $10 million, with
Navstar to develop PHEV school buses, and the U.S. House of Representatives (through H.R. 3246)
set aside more than $1 billion toward development of medium- and heavy-duty PHEVs. Any investment
in electric vehicles, however, will not reduce GHG emissions in much of the country where coal is the
primary energy source, and would result in little return overall compared to the already-popular hybrid
vehicles.
Hybrid vehicle buyers have likewise been the recipients of considerable
incentives. While the federal tax credits phase out for a particular
manufacturer once it has sold 60,000 eligible vehicles, several hybrids still
have such incentives, including the BMW ActiveHybrid 750i ($900) and the
Nissan Altima Hybrid ($2,350). Many states oer additional incentives in
various forms, such as rebates, tax credits and deductions, sales tax waivers,
fee waivers, and access to carpool lanes even when driving solo. Some
employers, such as Timberland and Google, oer incentives to their employees
for purchasing hybrids.
Though these incentives have promoted purchases of hybrids to some extent,
the incentives are probably costlier to provide than other emissions-reduction
mechanisms. For one thing, researchers have attributed only 6-27 percent
of hybrid purchases in the United States to tax incentives (e.g. Galleger and
Muehlegger 2010, Beresteanu and Li 2010). Canadian researchers reached
similar conclusions for that country’s hybrid purchases (Chandra et al., 2010).
Plug-in cars are
only “green”
for a limited
number of
situations,
considering
both regional
electricity mix
and driving
habits.
17
The bulk of hybrid purchases are actually attributable to high gasoline prices and/or social preferences
– those consumers thus received incentives for purchases they were going to make anyway. The high
percentage of “free riders” signicantly decreases the cost-eectiveness of incentive programs.
Hybrids are also pricier than their conventional ICE
counterparts, and those premiums may be relatively
expensive for the level of emissions reductions which hybrids
achieve. In a comparison of the hybrid Toyota Prius and the
conventional Toyota Corolla, researchers found that the Prius
does indeed have lower pollutant and CO
2
emissions, but is
not cost-eective – there are less costly ways to achieve the
same emissions reductions (Lave and MacLean, 2002).
As with PHEVs, hybrids are most eective at reducing
emissions under specic circumstances – fairly small cars
operating at low speeds. For example, a 2008 study of
the Toyota Prius and the Honda Civic hybrid demonstrated that hybrids provide the most benet
under urban driving conditions with very low speeds typical of stop-and-go trac. At higher speeds
(approaching 60 miles per hour), hybrids’ fuel consumption and the resulting emissions are similar to
conventional vehicles (Fontaras et al., 2008).
At higher speeds
(approaching 60 miles
per hour), hybrids’ fuel
consumption and the
resulting emissions
are similar to
conventional vehicles.
18
Fueling conventional
vehicles
When it comes to conventional internal combustion engine vehicles (ICEVs), a major question today is
whether biologically derived fuels can provide environmental benets compared to fossil fuels. In the
United States, the primary source of biofuels is currently corn-based ethanol, followed by biodiesel
made from soybeans. Other energy crops, such as grasses like switchgrass and miscanthus, may be
viable energy feedstocks, though much research remains to be done on how to optimize production of
these crops and how to make them cost-eective for generating fuel. Other biological sources, such as
algae, are still in the research phase as fuel sources.
Are biofuels an answer to decreasing the environmental impact of passenger vehicles? In the life-cycle
comparison of PHEVs, conventional vehicles, and hybrids discussed above, the researchers concluded
that if conventional vehicles were fueled by E85 (85 percent ethanol blend, with the ethanol produced
from cellulosic feedstocks), conventional vehicles would have substantially lower net GHG emissions
than PHEVs under the current electricity generation portfolio (Samaras and Meisterling, 2008).
However, on the whole, there is substantial debate among scientists regarding the net GHG impact of
biofuel production.
On the one hand, the fuel source itself generates no net carbon emissions when burned. Biomass gets
its carbon from the atmosphere in the rst place and returns the carbon to the atmosphere when it is
burned to produce energy. In this sense, it is “carbon neutral.” However, when the entire life cycle is
considered, several prominent studies (e.g. Pimentel and Patzek, 2005) have concluded that biofuel
production is not signicantly more carbon-neutral than gasoline as a liquid fuel, and in fact may
consume more energy in the production than it generates. Critics contend that those studies have used
outdated information on typical fuel economy of farm vehicles, and other outdated assumptions. When
updated information is used, biofuel production appears to generate less overall emissions (e.g. Kim
and Dale, 2005).
However, not all biofuels are created equal. Per acre, dierent “energy crops” require dierent inputs
and processing, and can generate dierent amounts of energy as a fuel (liquid or otherwise). The
energy return on ethanol from sugar cane, for example, is signicantly higher than that from corn – one
study, for instance, found the fuel energy per acre from sugar cane to be more than three times that of
corn (Sims et al., 2006). The same is true for conventional diesel and biodiesel.
For instance, Australian researchers found that for biodiesel production, palm oil can produce up to
an 80 percent saving in emissions, provided it is sourced from older plantations, rather than from
plantations cleared from forested areas (Beer et al., 2007). And sometimes it is not an energy crop at
19
all that provides the best return. The Australian report noted that in that country, the best source for
biodiesel (that with the lowest net lifecycle emissions of GHGs and air pollutants) was used cooking oil.
At the same time, a study of European Union legislation to promote
the expanded use of biodiesel found that biodiesel generated from
rapeseed (canola) resulted in the same GHG emissions as conventional
diesel (rapeseed-derived biodiesel is the leading biofuel in the EU).
The study concluded that planting trees on the rapeseed land would do
signicantly more to reduce overall GHG emissions (Johnson and
Heinen, 2007).
Of course, greenhouse gasses are not the only vehicle emissions. Vehicles also emit smog-related
compounds and other potential air pollutants – although since the 1960s, the eciency of vehicles,
and reductions in emissions, have improved many times over, because of advancements in both fuel
technology and vehicle technology. It is not clear that biofuels are a net gain on that front, either.
For example, simulations by a Stanford atmospheric scientist found that while E85 vehicles reduce
atmospheric levels of two carcinogens, benzene and butadiene, they increase that of two others,
formaldehyde and acetaldehyde. Furthermore, the study found that expanded use of E85 would
signicantly increase ozone, a key component of smog (Jacobson, 2007).
However, GHG and air pollutant emissions are only part of the environmental impact of liquid fuel
generation. In the case of biofuels, evidence is mounting that at least in the near term, biofuels derived
from agricultural crops may do more harm than good (for example, see Groom et al., 2008, for an
overview of environmental and ecological impacts of agricultural biofuels). Biofuel mandates increase
the land area used to grow crops, increasing applications of fertilizers and herbicides and therefore
posing a threat to water quality. The use of agricultural residues like corn stalks and other biomass left
behind after harvest as a source (feedstock) for biofuels will accelerate soil erosion and oxidation of
soil carbon – not only compromising soil fertility, but also raising CO
2
emissions from the soil. In regions
where irrigation is necessary, expanded or intensied agricultural production may further stress water
resources.
In the near term,
biofuels derived
from agricultural
crops may do more
harm than good.
20
Incentivizing biofuels
These concerns have not stood in the way of government endorsement of biofuels, regardless of
source. In 2005, the federal government introduced the rst Renewable Fuel Standards, which required
that by 2012 at least 7.5 billion gallons of renewable fuel must be blended into motor-vehicle fuel sold
in the United States. Many states, including California, followed suit by launching their own plans for
renewable fuel mandates. The program was expanded in 2007 and again in 2010, more than doubling
the 2012 biofuel requirement in motor-vehicle fuel to 15.2 billion gallons per year, and increasing the
volume of renewable fuel required to be blended into transportation fuel to 36 billion gallons by 2022.
In October 2010, the EPA announced it would approve a fuel blend of 15 percent ethanol (up from 10
percent) in gasoline for vehicles from the 2007 and later model years.
To help accomplish this, as of this writing the domestic ethanol industry receives a 45 cent-per-gallon
“Volumetric Ethanol Excise Tax Credit” (VEETC) – at an annual cost to taxpayers of between $5 billion
and $6 billion – as well as a 54 cent-per-gallon protective tari that prevents lower-cost Brazilian ethanol
(produced from sugar cane) from being competitive in the United States. While both are set to expire
at the end of 2010, the industry and the U.S. Department of Agriculture are advocating their extension.
In October 2010, U.S. Secretary of Agriculture Tom Vilsack announced that the government will resume
subsidies to farmers to produce non-food crops that can be converted to biofuels.
No policies currently in place address the environmental and ecological
consequences of expanded biofuel production.
Some research even suggests that there may be a better use of bio-
based fuels than liquid applications. A 2009 study published in Science
found that generating electricity from biofuel crops is considerably
more energy ecient – and potentially more carbon ecient –
than using them to produce liquid fuel (Campbell et al., 2009). The
researchers noted that bioelectricity used for battery-powered vehicles
would deliver an average of 80 percent more miles of transportation
per acre of crops than generating ethanol for ICEVs, while also
mitigating double the greenhouse gas emissions.
The EPA proposed
a scheme that
addressed only
tailpipe emissions, not
net emissions from
powering the vehicle.
21
No policies currently
in place address the
environmental and
ecological conse-
quences of expanded
biofuel production.
If all the variations in vehicle type and fuel source and the associated environmental impacts seem
confusing, that’s because they are. The federal government has unfortunately done little to help
consumers sort out this morass. Current EPA standards for estimating the fuel economy of a car don’t
make sense for electric vehicles – but that doesn’t mean the cars are innitely ecient. And when trying
to come up with new-car labels that allow for cross-comparison of hybrids, ICEVs (including ex-fuel
vehicles that may run on E85, or vehicles running on a 10 percent ethanol
blend), PHEVs, and EVs, the EPA proposed a scheme that addressed only
tailpipe emissions, not net emissions from powering the vehicle. This
type of assessment heavily favors EVs and PHEVs (which have no tailpipe
emissions when operating on battery power), despite the fact that the
overall emissions impact may or may not be an improvement over other
vehicle types.
22
Recommendations
Overall, the automobile option with the smallest environmental footprint is the idealized situation
of using clean energy to charge a high-performance battery for small-distance city drivers. It remains
unclear, however, what energy is the “cleanest” at the lowest cost, all things considered. Even for
longer-distance drivers with a charged battery supplemented by an internal combustion engine burning
the most environmentally friendly fuel, it remains to be seen what, exactly, that fuel is. The ideal
situation is far from the current reality – and creating that situation will require signicant investments
in research and development into new and innovative technologies, and perhaps signicant changes in
infrastructure.
Until such technological breakthroughs are realized, and until the energy sector has a dierent
complexion than it does today, promoting electric vehicles could actually cause more harm than the
perceived good it provides.
Therefore, policies related specically to vehicle fuel or power today and in the foreseeable future
should have the following guiding principles:
• Outcomes are more important than products. As exciting as the technology may be, electric
vehicles are not universally helpful; in many situations they are inappropriate and lead to
minimal environmental benets at best, and negative impacts at worst. Until and unless the
energy sector is less reliant on high-carbon sources, there should be no government incentives
and pushes to expand consumer purchases of these vehicles.
• Renewable fuel policy must incorporate a holistic approach. Carbon emissions from the car
are not the only environmental concern related to producing and burning liquid vehicle fuel.
Many biofuels – notably, the most common biofuels in the United States, sourced from corn
and soybeans – can have signicant negative environmental impacts. The current renewable
fuel standards and goals thus pose threats to overall environmental health. These policies
seem based on the assumption that biofuels are uniformly benecial, but that is not the case.
Renewable fuel standards should not promote environmental degradation in ways besides
carbon emissions only.
• Government investment needs to spur technological development, not simply entrench and
institutionalize rst-generation eorts. Biofuel subsidies, for example, may create a new energy
sector that, rather than being viable as a self-sucient industry, remains largely reliant on
subsidies. Although many policymakers have noted that biofuel subsidies and protections
should be phased out over time, the history of entrenched subsidies in the United States
23
suggests that phase-outs will always remain a plan for some time in the future – they are rarely
implemented. This serves only to tie up funds that might otherwise be available for other
energy and automotive innovation.
Both biofuels and electric vehicles are highly incentivized by federal actions; yet, the environmental
benets of both remain questionable. Encouraging innovation and continued technological
development will be more eective in the long run at addressing the environmental footprint of
American automobiles than government programs that essentially mandate specic approaches.
24
References
Automotive News. 2010. Nissan Leaf has 100-mile range – give or take 40%.
/>QN (veried 19 November 2010).
Beer, T., T. Grant, and P. Campbell. 2007. The greenhouse and air quality emissions of biodiesel blends in
Australia. CSIRO. Available from (veried 11 October 2010).
Beresteanu, S. and G. Li. In press (2010). Gasoline prices, government support and the demand for
hybrid vehicles in the US. International Economic Review.
Campbell, J.E., D.B. Lobell, and C.B. Field. 2009. Greater transportation energy and GHG osets from
bioelectricity than ethanol. Science. 324(5930): 1055-1057.
Chandra, A., S. Gulati, M. Kandlikar. 2010. Green drivers or free riders? An analysis of tax rebates for
green vehicles. Journal of Environmental Economics and Management. 60: 78-93.
Consumer Reports. 2010. Shocking results: Survey reveals what consumers want from electric cars. http://
blogs.consumerreports.org/cars/2010/03/consumer-reports-electric-car-buying-survey.html (veried 19
November 2010).
Fontaras, G., P. Pistikopoulos, and Z. Samaras. 2008. Experimental evaluation of hybrid fuel economy
and pollutant emissions over real-world simulation driving cycles. Atmospheric Environment. 42: 4023-
4035.
Gallagher, K. and E. Muehlegger. In press (2010). Giving green to get green? Incentives and consumer
adoptionof hybrid vehicle technology. Journal of Environmental
Economics and Management.
Granovskii, M., I. Dincer, and M.A. Rosen. 2006. Economic and environmental comparison of hybrid,
electric, and hydrogen fuel cell vehicles. Journal of Power Sources. 159: 1186-1193.
Groom, M.J., E.M. Gray, and P.A. Townsend. 2008. Biofuels and biodiversity: Principles for creating
better policies for biofuel production. Conservation Biology. 22(3): 602-609.
GM. 2010. Chevrolet Volt Milestone Timeline. />en/volt/tech/timeline/_jcr_content/par/sectioncontainer_1/par/download/le.res/Volt%20Milestone%20
Timeline.doc (veried 19 November 2010).
Hadley, S.W. and A Tsvetkova. 2009. Potential Impacts of Plug-in Hybrid Electric Vehicles on Regional
25
Power Generation. The Electricity Journal. 22(10): 56-68.
IEA. 2009. Electric and Plug-in Hybrid Vehicle Roadmap. Available from />EV_PHEV_brochure.pdf (veried 11 October 2010).
Jacobson, M.Z. 2007. Eects of ethanol (E85) versus gasoline vehicles on cancer and mortality in the
United States. Environmental Science & Technology. 41(11): 4150–4157.
Jansen, K.H., T.M. Brown, and G.S. Samuelsen. 2010. Emissions impacts of plug-in hybrid electric vehicle
deployment on the U.S. western grid. Journal of Power Sources. 195: 5409-5416.
Johnson, E., and R. Heinen. 2007. Petroleum diesel vs. biodiesel: The race is on. Chemistry & Industry.
April 23, 2007.
Kim, S. and B. Dale. 2005. Life cycle assessment of various cropping systems utilized for producing
biofuels: Bioethanol and biodiesel. Biomass and Bioenergy. 29(6): 426-439.
Lave, L.B., and H.L. MacLean. 2002. An environmental-economic evaluation of hybrid electric vehicles:
Toyota Prius vs. its conventional internal combustion engine Corolla. Transportation Research Part D. 7:
155-162.
Pew Center on Global Climate Change. 2009. Key Provisions: American Recovery and Reinvestment
Act. (veried 19
November 2010).
Pimentel, D., and T.W. Patzek. 2005. Ethanol Production Using Corn, Switchgrass, and Wood; Biodiesel
Production Using Soybean and Sunower. Natural Resources Research. 14(1): 65-76.
Rasmussen Reports. 2009. 40% Likely To Buy An All-Electric Car In Next 10 Years. http://www.
rasmussenreports.com/public_content/lifestyle/general_lifestyle/august_2009/40_likely_to_buy_an_
all_electric_car_in_next_10_years (veried 19 November 2010).
Samaras, C., and K. Meisterling. 2008. Life cycle assessment of greenhouse gas emissions from plug-in
hybrid vehicles: Implications for policy. Environmental Science & Technology. 42(9): 3170-3176.
Shiau, C S.N., C. Samaras, R. Haue, J.J. Michalek. 2009. Impact of battery weight and charging
patterns on the economic and environmental benets of plug-in hybrid electric vehicles. Energy Policy.
37: 2653-2663.
Sims, R.E.H., A. Hastings, B. Schlamadinger, G. Taylor, and P. Smith. 2006. Energy crops: current status
and future prospects. Global Change Biology. 12: 2054–2076.
U.S. Department of Transportation. 2004. 2001 National Household Travel Survey. DOT: Washington, DC.