Tài liệu Identifying Unsafe Driver Actions that Lead to Fatal Car-Truck Crashes pdf
Bạn đang xem bản rút gọn của tài liệu. Xem và tải ngay bản đầy đủ của tài liệu tại đây (2 MB, 76 trang )
Prepared by
Lidia P. Kostyniuk, Fredrick M. Streff,
and Jennifer Zakrajsek
University of Michigan
Transportation Research Institute
Prepared for
AAA Foundation for Traffic Safety
1440 New York Avenue, N.W., Suite 201
Washington, DC 20005
www.aaafoundation.org
April 2002
Identifying Unsafe Driver Actions
that Lead to Fatal Car-Truck Crashes
Cover photo: J. Scott Osberg/AAA Foundation for Traffic Safety
Acknowledgments
ii
Executive Summary
iii
Introduction
1
Methodology
2
Chapter 1. The First Stage of Research: Identifying Unsafe Driver Actions
Bayesian Approach 5
Data
6
Estimating Likelihood Ratios
10
Conclusions
13
Chapter 2. The Second Stage of Research: Detailed Review of Car-Truck Crash Records
Cases Involving the Four Driver Factors 15
Age and Gender Effects
20
Conclusions
25
Chapter 3. The Third Stage of Research: Exploring the Development of Educational Materials
Instructional Targets 26
Instructional Strategies
27
Matching Instructional Targets and Strategies
28
Matching Research Findings With Instructional Targets and Strategies
29
Conclusions
31
Chapter 4. Discussion of Findings
33
References
37
Appendixes
A. Driver-Level Related Factors in FARS 40
B. Frequency of Driver Factors Recorded in Fatal Two-Vehicle Crashes
45
C. Likelihood of Driver Factor in Fatal Car-Truck Crash Relative to Fatal Car-Car Crash
48
D. Likelihood of Driver Factor in Fatal Car–Heavy Truck Crash Relative to Fatal
Car–Medium-Weight-Truck Crash
50
E. Examples and Summary from Detailed Review
52
F. Test for Gender Effects
58
G. Instructional Strategies and Targets
60
Feedback Form
65
i
Contents
Acknowledgments
We thank Kenneth Campbell, Daniel Blower, and Robert Pichler of the
Center for National Truck Statistics at the University of Michigan
Transportation Research Institute (UMTRI) for providing us with the hard-copy
files of the fatal crashes involving heavy trucks. We gratefully acknowledge Lisa
Molnar of UMTRI for her careful review and thoughtful contributions to this
work. We also thank several other members of UMTRI for their assistance;
Helen Spradlin and Linda Miller for the literature review, Krishnan Sudarsan
and Kathy Miller for help in reviewing the crash reports; and Judy Settles and
Mary Chico for their help in the administrative aspects of this study. Finally, we
thank the reviewers whose comments and critiques were helpful in finalizing this
report.
This work was sponsored by the AAA Foundation for Traffic Safety. The
opinions expressed here are those of the authors and not necessarily those of the
sponsor.
Lidia P. Kostyniuk, Ph.D.
Fredrick M. Streff, Ph.D.
Jennifer Zakrajsek, M.P.H.
ii
Executive Summary
In 2000, 5,211 persons were killed and about 140,000 were injured in crash-
es involving large trucks. The purpose of this study is to explain the unsafe driv-
er actions and conditions that are more likely in fatal crashes between cars and
large trucks than in fatal crashes between cars and to identify strategies for edu-
cating motorists in safe driving practices that will help them avoid such crashes.
RESEARCH METHODS
The study analyzed two-vehicle crashes in the 1995–98 Fatality Analysis
Reporting System (FARS) database to compare car-car crashes with car-truck
crashes. A limitation of the study is that it did not address nonfatal crashes, sin-
gle-vehicle crashes, or crashes involving more than two vehicles; this is impor-
tant to keep in mind because fatal and injury crashes are not similar in their
causes or in the numbers of people they affect.
The research was conducted in three stages. The first stage sought to identify
driving maneuvers or actions of cars and large trucks that have a higher chance
of resulting in fatal car-truck collisions than fatal collisions with a similar vehi-
cle. The second stage involved discerning patterns associated with these driving
actions through a detailed examination of actual crash reports. The third stage
involved exploring ways that the risks associated with the identified driving
actions can be effectively communicated to motorists, paying special attention to
the fit between study findings and potential instructional approaches.
THE FIRST STAGE OF RESEARCH: IDENTIFYING UNSAFE DRIVER ACTIONS
The first stage of research involved an analysis of 94 driver-related factors.
Using probability analysis techniques, the authors determined the likelihood of
involvement for each factor based on the probability that the crash did or did
not involve a truck.
Information about the precrash actions of drivers was sought in national
crash databases such as FARS, a national database of all vehicle crashes in the
United States that result in at least one fatality. These data are based on such
sources as police observations of the postcrash scene and the unsworn testimony
of surviving people and other witnesses. It was recognized that these sources
have limitations. For instance, the physical evidence on which the police base
their opinions may be conflicting or ambiguous, and people involved in a crash
may be unable to remember information about the events before the crash.
Because of these uncertainties, it is not possible to directly assess precrash
driver actions or to identify causal relationships between unsafe driving actions
and crashes by simply tabulating crash data. It would be possible, however, to
iii
use an indirect data-analysis approach that would address the inherent uncer-
tainty. Accordingly, the authors chose an analytical method that allowed them to
estimate conditional probabilities.
The data file for analysis was created from FARS data for 1995–98 and con-
sisted of all fatal crashes involving passenger vehicles (cars, station wagons, mini-
vans, sport utility vehicles, and pickup trucks) and trucks (straight trucks and
tractor-trailers) of more than 10,000 pounds gross vehicle weight. The analysis
was limited to two-vehicle crashes, which accounted for about 86% of all multi-
vehicle crashes involving only passenger vehicles and 82% of multi-vehicle
crashes involving passenger vehicles and trucks. In this report, crashes between
passenger vehicles, regardless of type, are referred to as “car-car crashes” and
crashes between passenger vehicles and large trucks are referred to as “car-truck
crashes.” The analysis file contained data on 35,244 fatal car-car crashes and
10,732 fatal car-truck crashes.
The results of the data analysis indicate that most driver factors are equally
likely to be recorded for fatal car-truck crashes as for fatal car-car crashes.
Moreover, drivers who get involved in fatal crashes probably drive in the same
manner around trucks as they do around other cars. Indeed, in cases for which
driver factors were recorded, five of the equally likely factors: failing to keep in
lane, failing to yield right-of way, driving too fast for conditions or in excess of
posted speed limit, failing to obey traffic control devices and laws, and inatten-
tive comprised about 65% of reported unsafe car driver acts in both car-truck
and car-car crashes. Four factors (out of 94) were found to be more likely to
occur in fatal car-truck crashes than in fatal car-car crashes:
• Following improperly
• Driving with vision obscured by rain, snow, fog, sand, or dust
• Drowsy or fatigued driving
• Improper lane changing
However, these four factors were recorded for only about 5% of the car-truck crashes.
THE SECOND STAGE OF RESEARCH:
DETAILED REVIEW OF CAR-TRUCK CRASH RECORDS
The second stage of the research involved closely examining a random
sample of 529 crashes for the top four factors differentiating fatal car-car
and fatal car-truck crashes. Hard-copy materials—including original police
accident reports, crash diagrams, and other crash-related information from
the 1995–98 Trucks in Fatal Accidents records maintained by the Center
iv
for National Truck Statistics—were reviewed. The results of this analysis
corroborate earlier studies of car-truck crashes showing that there are many
more unsafe actions by car drivers than truck drivers. Also as expected, the
crashes were much more dangerous for car drivers than truck drivers; car
drivers accounted for nearly 98% of driver fatalities.
The results of the analysis also indicate that more than half of the fatal
car-truck crashes in which a driver fell asleep were head-on crashes, and
more than one-quarter of these occurred between 3 and 6 a.m. The results
point to the use of alcohol or drugs and speeding as unsafe behaviors
among younger drivers for both cars and trucks involved in fatal car-truck
crashes. Finally, the results are consistent with previous research; for
instance:
• Drowsy or fatigued driving and following improperly were more likely to be reported for
male than female car drivers.
• Car drivers in crashes in which their vision was obstructed tended to be older than the
other drivers.
• Car drivers who were drowsy/fatigued were likely to be younger than other drivers.
• Younger truck drivers were more likely than older truck drivers to follow improperly,
speed, and use alcohol or drugs.
THE THIRD STAGE OF RESEARCH:
EXPLORING THE DEVELOPMENT OF EDUCATIONAL MATERIALS
The third stage of the research explored instructional strategies that could be
used to teach motorists about the risks associated with the four unsafe driving
actions and conditions identified in the first stage of the research. Effective edu-
cational efforts could include:
Teaching motorists how to operate around large trucks, focusing on instruc-
tion on the four unsafe factors
Creating an interactive World Wide Web site that educates drivers about the
dangers associated with driving near trucks and allows them to test their knowledge
Personal computer–based driving simulations, demonstrations, or computer
games showing interactions between cars and large trucks
v
DISCUSSION OF FINDINGS
It is important to note again that, because of data limitations, this study
looked only at fatal crashes. Nevertheless, the findings from this study are con-
sistent with the findings from a study of unsafe driving acts of car drivers in the
vicinity of trucks that was not limited to fatal crashes. It also needs to be noted
that three of the four driver factors that were found in this study to be more
likely to be associated with fatal car-truck crashes than with fatal car-car crashes
were among those considered by safety experts to be dangerous and frequent
near trucks.
A key finding of this study is that most of the 94 unsafe driver acts were
about as likely in fatal car-truck crashes as in fatal car-car crashes. Therefore gen-
eral safe driving practices are also relevant around large trucks. However, pro-
grams to educate drivers in safe practices need to emphasize that driving mis-
takes around trucks can have much more severe consequences.
vi
Introduction
In 2000, 5,211 persons were killed and about 140,000 were injured in
crashes involving trucks with a gross vehicle weight of more than 10,000
pounds (NHTSA 2001). In collisions between passenger vehicles (which
include various types of vehicles; hereafter, “cars”) and large trucks, the struc-
tural properties and greater mass of large trucks put the occupants of the cars at
a disadvantage—98% of the deaths in fatal two-vehicle crashes involving a car
and a large truck were among occupants of the car (FMCSA 2001). Between
1990 and 2000, the number of trucks registered in the United States with gross
vehicle weights above 10,000 pounds increased 30% and the number of miles
traveled by such trucks increased 41%. Although the number of cars and miles
traveled also rose, the rate of increase was lower. Between 1990 and 2000, regis-
trations for passenger cars and light trucks in the United States increased by
18% and their miles traveled increased by 27% (NHTSA 2001). If these trends
continue, car drivers will be more and more likely to encounter large trucks.
Many crashes between cars and large trucks occur because a maneuver per-
formed by one of the vehicles is unanticipated by the other, leaving insufficient
time to avoid the crash. In some cases, a maneuver performed by a car near a
large truck may carry a higher crash risk than the same maneuver performed
near another car. Similarly, a large truck may perform a maneuver that carries
low risk of a crash near another truck in the traffic stream, but a higher risk
when performed near a smaller vehicle. One reason why some car drivers per-
form unsafe maneuvers near large trucks may be that they simply do not know
the risks associated with driving near trucks.
Most research aimed at understanding the causes of crashes between cars
and trucks indicates that the actions of car drivers contribute more to
car–large truck crashes than do the actions of truck drivers (e.g., Schwartz and
Retting 1986; AAA Michigan 1986; Massie and Sullivan 1994; Braver et al.
1996; Blower 1998; and Stuster 1999). It has been argued that the average
motorist assumes that the operation of cars and large trucks is virtually the
same (Mason et al. 1992) and that motorists are poor judges of the speed,
maneuverability, braking, and acceleration capabilities of large vehicles (Ogden
and Wee 1988; Hanowski et al. 1998; Stuster 1999). It is probable that edu-
cating motorists about the risks of driving near trucks or training motorists
how to drive near trucks would help promote safer driving practices.
There are public information and educational programs aimed at teaching
motorists how to drive near trucks. Many employ materials such as brochures,
pamphlets, and videos (e.g., Michigan Center for Truck Safety 2000), and there
is a growing reliance on web sites (e.g., U.S. Department of Transportation,
www
.nozone.org; Crash Foundation, www.trucksafety.org/shared.html). In the
age of increasing interactive computing technology and widespread use of
1
home computers, it seems natural that such technology might be employed to
help teach motorists to drive safely near trucks. However, regardless of the
approach or technology used, the most successful educational programs are
those that match instructional strategies with desired outcomes (Salas and
Cannon-Bowers 2001).
The main objectives of this research were to explain driving actions that
lead to crashes between cars and large trucks and to identify strategies for edu-
cating motorists about the risks of such actions. The research was conducted in
three stages. The first stage sought to identify maneuvers and driving actions of
cars and large trucks that have a higher chance of resulting in car-truck colli-
sions than collisions between cars. The second stage involved discerning pat-
terns associated with these maneuvers and actions through a detailed examina-
tion of actual crash reports. The third stage involved exploring ways to make
motorists aware of the risks of the identified driving actions, paying special
attention to the fit between study findings and potential educational strategies.
Methodology
Information about driver actions that contribute to crashes between passen-
ger vehicles and large trucks can be found in national crash databases, such as
the Fatality Analysis Reporting System (FARS) and the General Estimates
System of National Sampling System (GES). These databases contain informa-
tion about unsafe driving acts that occur before crashes and other relevant data
for each involved traffic unit in a vehicular crash. These data come from a geo-
graphically diverse group of locations with similarly diverse driving environ-
ments and are representative of the United States as a whole.
However, there is an inherent uncertainty associated with information about
driver actions, because such information is usually reported by police officers
who arrive after the crash and rely on observations of the postcrash scene, their
professional experiences, and the unsworn testimony of the surviving parties and
other witnesses. The physical evidence found by the officers may be conflicting
or ambiguous, individuals who were involved in the crash may not be fully
forthcoming or may be unable to remember information about events before the
crash, and witnesses generally did not pay attention to the precrash actions but
are merely bystanders recalling actions they happened to see. In some cases, offi-
cers may record all the factors they believe were factors in the crash; in others,
they may record only the factors they believe are most relevant; in still others,
they may not record any factors at all.
The uncertainty associated with this information—which has been recog-
nized by researchers (e.g., Wolfe and Carsten 1982; Braver et al. 1996)—makes
2
direct assessment of the precrash maneuvers and actions by simple tabulations of
these data insufficient to identify the causal relationships between unsafe driving
actions and crashes.
Despite the inherent uncertainty, these national crash databases are still a
useful source of information about the precrash actions that contribute to
crashes between vehicles. This has been substantiated by Blower (1998) in a
study of collisions between large trucks and passenger cars. Blower found that
the coding of driver-related factors was relatively consistent with what one
would expect from the physical configuration of the crash, especially crashes
that involved fatalities. Thus, there is credible information about driver pre-
crash actions in the data files, but the analysis methods employed must be able
to account for the inherent uncertainty. An approach based on the application
of Bayes’ Theorem is well suited for analyzing data with the types of challenges
identified above (Pollard 1986; Benjamin and Cornell 1970) and was therefore
selected for this study.
Ideally, a Bayesian approach could be applied to crashes of all injury severi-
ties. However, it is better suited to fatal crashes because of limitations of the
available national data set that includes nonfatal injuries. The FARS data set,
which contains records for all fatal vehicle crashes in the United States, is based
on police accident reports and more detailed investigations. The GES data set
contains information about a nationally representative sample of police-reported
crashes of all severities and is based on police accident reports alone. Because
reports are more carefully prepared for crashes involving a fatality than for crash-
es of lower injury severity, the level of detail needed for the research approach
presented here is more likely to be found in FARS than in GES. Moreover,
unlike FARS, which has specific variables for driver-related factors, driver actions
in GES have to be obtained from any violations charged. GES introduces more
uncertainty about drivers’ pre-crash actions because police officers issue citations
based on many considerations including the seriousness of the offense, the exis-
tence of sufficient evidence to prove the charge, the intent of the violator, and
whether other enforcement actions might be appropriate.
Another problem with using GES data for this analysis is that the data are
drawn from a complex sample. Each crash in this data set represents from 2 to
3,000 crashes, resulting in standard errors that can be quite large. Collectively,
these uncertainties render any findings from Bayesian analysis of driver precrash
actions from the GES data meaningless. Therefore, this research only uses data
from FARS, thus limiting the analysis to fatal crashes.
In the first stage of the research, a Bayesian approach was used to examine
relationships between unsafe driving and crashes between passenger vehicles
and large trucks (referred to as cars and trucks, respectively, throughout this
report). Data from FARS were analyzed to estimate the conditional probability
3
of a given unsafe driving action being reported, given that the crash was a car-
truck crash, and to identify unsafe driving actions that occur with greater prob-
ability before car-truck crashes than before car-car collisions.
In the second stage of the research, the relationship between the identified
actions and car-truck crashes was further scrutinized by examining selected
hard-copy reports from the Trucks in Fatal Accidents records maintained by the
Center for National Truck Statistics. These data files provide coverage of all
fatal crashes involving trucks with gross vehicle weights of more than 10,000
pounds recorded in FARS. The hard copies included police reports, crash dia-
grams, interviews, and other relevant information about the crash. The purpose
of these examinations was to identify patterns and behavioral sequences leading
up to the car-truck collisions, and if possible, to identify characteristics of driv-
ers associated with these actions. In the third stage of the research, potential
behavior and knowledge interventions that could be used to change these
unsafe driving actions were identified and appropriate instructional strategies to
deliver these interventions were explored.
4
CHAPTER 1
The First Stage of Research: Identifying Unsafe Driver Actions
BAYESIAN APPROACH
In the first stage of this research, relationships between unsafe driving and
car-truck crashes were examined by estimating the conditional probability that a
specific unsafe driving action (UDA) would be reported, given that the crash
was a car-truck crash. These conditional probabilities were estimated by applying
Bayes’ Theorem, using this relationship:
P(car-truck/UDA) * P(UDA)
P(UDA/car-truck) = ————————————————————-
P(car-truck)
The value of P(car-truck/UDA) is the probability that the crash was a car-
truck crash, given that a specific UDA was also reported. This value is estimated
from the data by considering the numbers of all cases and those cases in which a
car-truck crash and the UDA were coded together. P(UDA) is the overall proba-
bility of the specific UDA being reported as a contributing factor, and it is esti-
mated from the numbers of cases in which the UDA was reported in the data.
P(car-truck) is the overall probability that a crash was a car-truck crash and was
estimated from the data.
The probability of a specific UDA being associated with a car-car crash was
similarly estimated from the data, using this relationship:
P(car-car/UDA) * P(UDA)
P(UDA/car-car) = ————————————————————-
P(car-car)
where P(car-car) is the overall probability that a car-car crash occurred, and
P(car-car/UDA) is the probability that a car-car crash occurred, given that a spe-
cific UDA was reported.
5
The likelihood ratio of a given UDA being recorded in a car-truck crash as
compared with a car-car crash was assessed from crash records. This likelihood
ratio is the probability of a crash being a car-truck crash when the UDA was
recorded, as compared with the probability of a crash being a car-car crash when
the same UDA was recorded. The larger the likelihood ratio, the greater the
association between the UDA and car-truck crashes relative to car-car crashes.
The likelihood ratio was calculated using this relationship:
P(UDA/car-truck)
Likelihood ratio = —————————————
P(UDA/car-car)
DATA
The data file for analysis was created using data from the Fatality Analysis
Reporting System (FARS) for the period 1995–98. The data file consisted of
data for all fatal crashes involving passenger vehicles (passenger cars, station wag-
ons, minivans, sport utility vehicles, and pickup trucks) and trucks (straight
trucks and tractor trailers of more than 10,000 pounds gross vehicle weight).
Our analysis file contained 35,244 fatal car-car crashes and 10,732 fatal car-
truck crashes (table 1.1).
The analysis was limited to two-vehicle crashes for two reasons. First, most
multi-vehicle fatal crashes are between two vehicles (about 86% of all fatal car-car
crashes and about 82% of all fatal car-truck crashes from 1995 through 1998
involved only two vehicles).
Year Car-Car Crashes Car–Large Truck Crashes
1995 8,719 2,527
1996 8,846 2,669
1997 8,962 2,821
1998 8,717 2,715
Total, 1995–98 35,244 10,732
Source: Fatality Analysis Reporting System data.
6
Second, in crashes involving more than two vehicles, an initial collision
between two vehicles often precipitates the involvement of other vehicles.
Because we were investigating the actions that lead to a crash rather than the
chain of events that follow it, we were concerned with the vehicles involved in
the initial collision. If we had included crashes involving more than two vehi-
cles, we would have had to sort through complicated sequences to determine
which two vehicles were involved in the initial crash. By examining only two-
vehicle crashes, we avoided this problem and still had a large number of cases
to analyze.
In the 35,244 fatal car-car crashes, 42,192 people died—26,864 (63.67%)
were drivers, 14,122 (33.47%) were passengers, 20 (0.05%) were occupants of a
vehicle not in transport, 1,133 (2.68%) were non-occupants, and 53 (0.12%)
were unknown occupants (it could not be determined if the person was the driv-
er or a passenger). In the 10,732 fatal car-truck crashes, 12,554 people died—
8,848 (70.47%) were car drivers, 3,442 (27.42%) were car passengers, 12
(0.10%) were unknown car occupants, 223 (1.78%) were truck drivers, and 29
(0.23%) were truck passengers.
In FARS, information about driver precrash actions can be found in a set of
variables for “driver-level related factors.” These variables are coded by FARS
analysts from information provided by the investigating officer in the narrative
of the police accident report and also from any other supporting materials
(FHA 1996).
The 94 possible related factors that can be coded for a driver in FARS data
are listed in appendix A. Some of the items given as driver-level related factors
are not actually factors that contributed to the crash. For example, there are
codes for nontraffic violations and for other nonmoving violations. However,
items that do not directly cause a crash account for only about 5% of the items
listed. In 1995 and 1996, up to three driver-level related-factor variables could
be coded for a driver involved in a crash. In 1997 and 1998, this number was
increased to four. In the rest of this report, driver-level related factors are referred
to as “driver factors.”
Table 1.2 shows the distribution of the number of driver factors recorded for
drivers in fatal two-vehicle car-car and car-truck crashes in the analysis file.
Driver factors were recorded for approximately 54% of drivers in both car-car
and car-truck crashes. However, among drivers in fatal car-truck crashes, such
factors were more likely to be recorded for drivers of cars than for trucks. For
example, driver factors were coded for 80% of the involved car drivers but for
only 27% of the involved truck drivers in car-truck crashes. Multiple driver fac-
tors were coded for about 25% of all drivers involved.
7
We examined the combinations of driver factors to determine if any
appeared together often enough to be treated together in the study. There were
2,246 unique combinations of driver factors for drivers with multiple driver fac-
tors. An examination of these combinations showed that the number of drivers
coded for any one of these combinations was quite small. We therefore decided
to use the individual driver factors, whether they appeared alone or in combina-
tion with other factors in further analysis. Appendix B shows both the driver
factors in the analysis data file and also how often each appeared as a multiple
factor.
Table 1.3 shows the frequency of the most common driver factors for two-
vehicle crashes in the analysis data file. Factors associated with nonmoving viola-
tions are not shown in this table.
It is interesting that the distributions of the driver factors recorded for car driv-
ers in both car-car and car-truck crashes were similar, suggesting that precrash
driving actions of car drivers involved in fatal crashes were not significantly affect-
ed by whether the crash involved another car or a truck. Indeed, in cases for which
driver factors were recorded, five driver factors: failure to keep in lane, failure to
yield right-of-way, driving too fast for conditions or exceeding posted speed limit,
failing to obey traffic control devices and laws, and inattentive comprised about
65% of reported unsafe car driver acts in both car-truck and car-car crashes. In
other words, drivers who get involved in fatal crashes probably drive in the same
manner around trucks as they do around other cars.
Car-Truck Crashes
Number of
Driver Factors
Coded
Car-Car
Crashes
(Number of
Car Drivers;
n = 70,488)
Number of
Car and
Truck Drivers
(n = 21,464)
Number of
Car Drivers
(n = 10,732)
Number of
Truck Drivers
(n = 10,732)
0
32,390 (45.9%) 9,952 (46.4%) 2,115 (19.7%) 7,837 (73.0%)
1
20,495 (29.1%) 6,541 (30.5%) 4,826 (45.0%) 1,715 (16.0%)
2
12,3 23 (17. 5%) 3 ,70 0 (17. 2 %) 2 , 87 7 (26 . 85) 8 2 3 ( 7.7%)
3
4,795 (6.8%) 1,158 (5.4%) 843 (7.9%) 315 (2.9%)
4
485 (0.7%) 113 (0.5%) 71 (0.7%) 42 (0.4%)
Source: Fatality Analysis Reporting System data.
8
9
Number of Times Driver Factor was Coded for
Drivers in:
Car-Truck Crashes
Driver Factor
Car-Car
Crashes
(61,466 UDAs)
In Both Cars
and Trucks
(17,867 UDAs)
(13,393 UDAs) (4,474 UDAs)
In Cars In Trucks
Failure to keep in lane or
running off road
11,077
(18%)
3,336 (19%) 2,806 (21%) 530 (12%)
Failure to yield right of way
10,853
(18%)
2,722 (15%) 2,123 (16%) 599 (14%)
Driving too fast for conditions
or in excess of posted speed
limit
7,781 (13%) 2,114 (12%) 1,665 (12%) 4 49 (11%)
Failure to obey actual traffi c
signs, traffi c control devices
or traffi c offi cer; failure to
obey safety zone traffi c laws
6,356 (10%) 1,611 (9%) 1,246 (9%) 365 (8%)
Inattentive (talking, eating)
3,901 (6%) 1,372 (8%) 1,110 (9%) 262 (6%)
Operating the vehicle in an
erratic, reckless, careless,
or negligent manner; or
operating at erratic or
suddenly changing speeds
2,376 (4%) 753 (4%) 567 (4%) 186 (4%)
Driving on wrong side of
road (intentionally or
unintentionally)
2,371 (4%) 616 (3%) 536 (4%) 80 (2%)
Sliding due to ice, water, slush,
sand, dirt, oil, or wet leaves
on road
1,406 (2%) 408 (2%) 370 (3%) 38 (1%)
Making improper turn
1,252 (2%) 349 (2%) 263 (2%) 86 (2%)
Passing with insuffi cient
distance or inadequate
visibility; or failing to yield to
overtaking vehicle
839 (1%) 213 (1%) 164 (1%) 49 (1%)
Drowsy, sleepy, asleep, or
fatigued
670 (1%) 344 (2%) 300 (2%) 44 (1%)
Overcorrecting
643 (1%) 177 (1%) 149 (1%) 28 (1%)
Improper or erratic lane change
Vision obscured by rain,
snow, fog, sand, or dust
539 (1%) 245 (1%) 185 (1%) 60 (1%)
Following improperly
482 (1%) 374 (2%) 275 (2%) 99 (2%)
Source: Fatality Analysis Reporting System data.
86 (2%) 145 (1%)401 (1%) 231(1%)
ESTIMATING LIKELIHOOD RATIOS
The frequencies of driver factors from the analysis file provided the data need-
ed to estimate the likelihood of a driver factor being recorded for car-truck crashes
compared with car-car crashes. The details of the calculation are in appendix C;
table 1.4 shows the results.
Conditional Probability (P)
Driver Factor (DF) P(DF/car-car) P(DF/car-truck) Likelihood
Ratio
Failure to keep in lane or
running off road
0.3136 0.3130 0.9980
Failure to yield right of way 0.3079 0.2537 0.8240
Driving too fast for conditions
or in excess of posted
speed
0.2197 0.2006 0.9130
Failure to obey actual traffic
signs, traffic control devices
or traffic officer; failure to
obey safety zone traffic laws
0.1803 0.1502 0.8331
Inattentive (talking, eating) 0.1099 0.1304 1.1867
Operating the vehicle in an
erratic, reckless, careless or
negligent manner; or
operating at erratic speed or
suddenly changing speed
0.0673 0.0705 1.0472
Driving on wrong side of road
(intentionally or
unintentionally)
0.0673 0.0576 0.8561
Sliding due to ice, water,
snow, slush, sand, dirt, oil,
or wet leaves on road
0.0399 0.0433 1.0864
Making improper turn 0.0355 0.0327 0.9197
Passing with insufficient
distance or inadequate
visibility or failing to yield to
overtaking vehicle
0.0238 0.0199 0.8358
Drowsy, sleepy, asleep, or
fatigued
0.0190 0.0320 1.6815
Overcorrecting 0.0182 0.0166 0.9084
Improper or erratic lane
change
0.0153 0.0227 1.4868
Following improperly 0.0137 0.0349 2.5417
Vision obscured by rain,
snow, fog, sand, or dust
0.0111 0.0223 1.9998
Source: Calculations in table C.1.
10
A likelihood ratio of 1 indicates that the driver factor is equally likely to be
recorded for a fatal car-truck crash as for a fatal car-car crash. The greater the
likelihood ratio, the more likely it is that the driver factor was recorded for a
car-truck crash rather than a car-car crash. As can be seen from table 1.4, the
majority of the likelihood ratios were close to 1. Four of the driver factors had
likelihood ratios equal to or greater than 1.5:
• Drowsy, sleepy, asleep, or fatigued
• Following improperly
• Vision obscured by rain, snow, fog, smoke, sand, or dust
• Improper or erratic lane change
These ratios indicate that these driver factors were more likely to be associat-
ed with fatal car-truck crashes than with fatal car-car crashes.
Driver Factors
More Likely to Occur
in Car-Truck than in
Car-Car Crashes
Number
and % of
Crashes
Driver Factor Assigned to
Driver of:
Car Only Truck
Only
Both
Car and
Truck
Drowsy, sleepy, asleep,
or fatigued
344
100%
300
87%
44
13%
0
0%
Following improperly 373
100%
272
72.9%
98
26.3%
3
0.8%
Improper or erratic lane change 243
100%
183
75.3%
58
23.9%
2
0.8%
Vision obscured by rain, snow,
fog, smoke, sand, or dust
165
100%
79
47.9%
20
12.1%
66
40.0%
Source:Data in table C.1.
11
Because FARS data contain information about the weight of the truck, body
type, and number of trailers, we could also determine whether some driver fac-
tors were more likely to be present in fatal crashes between cars and certain types
of trucks. It was not possible to compare the likelihood of car-truck crashes by
the number of trailers because the number of tractor-trailer combinations with
no trailers or with two or more trailers was very small. However, there were ade-
quate data in the analysis file to calculate and compare the likelihood of driver
factors in fatal crashes of cars with heavy trucks (with gross vehicle weights of
more than 33,000 pounds) relative to fatal crashes of cars with medium-weight
trucks (with gross vehicle weights of 10,000 to 33,000 pounds). The calcula-
tions can be found in appendix D.
The relative likelihood values for three of the driver factors were equal to or
exceeded 1.5, indicating that these driver factors were more likely to be recorded
in fatal crashes between cars and heavy trucks than in fatal crashes between cars
and medium-weight trucks. These factors were:
• Passing with insufficient distance or inadequate visibility or failing
to yield to an overtaking vehicle
• Vision obscured by rain, snow, fog, smoke, sand, or dust
• Improper or erratic lane change
All other driver factors were equally likely in fatal crashes of cars with
heavy or medium-weight trucks.
Taken together, the results of all the likelihood analyses suggest (1) that
improper or erratic lane changes and obscured vision were more likely to con-
tribute to fatal car-truck crashes than to fatal car-car crashes, and (2) that
among car-truck crashes, these factors had a greater effect on crashes involv-
ing heavy trucks than on crashes involving medium-weight trucks. Passing
with insufficient distance or adequate visibility and failing to yield to an over-
taking vehicle were as likely to contribute to fatal crashes between cars and
trucks as to fatal crashes between cars. However, among car-truck crashes,
these factors were more likely to contribute to a fatal crash between a car and
a heavy truck than to a fatal crash between a car and a medium-weight truck.
Driver sleep or fatigue and improper following—although more likely to con-
tribute to fatal car-truck crashes than fatal car-car crashes—did not differen-
tially affect heavy versus medium-weight trucks.
12
The preceding analysis did not identify which driver in each crash was
coded with the driver factor. Table 1.5 above shows the numbers and percent-
ages of car and truck drivers assigned the driver factor.
For crashes in which driver sleepiness or fatigue was a contributing factor,
87% of the time it was the car driver and 13% of the time it was the truck
driver who was asleep or fatigued. When improper following and improper
lane changes contributed to a fatal car-truck crash, the unsafe maneuver was
performed by the car driver approximately three-quarters of the time and the
truck driver one-quarter of the time. For crashes in which obscured vision
contributed to the crash, the factor was recorded for both the driver of the
car and the driver of the truck in 40% of the crashes.
CONCLUSIONS
An examination of the FARS records for two-vehicle fatal crashes from
1995 to 1998 showed that driver factors were much more likely to be recorded
for car drivers than for truck drivers involved in fatal crashes The distributions
of the driver factors for car drivers involved in fatal car-car crashes and in fatal
car-truck crashes appeared to be similar. Because of the complexity and uncer-
tainty of identifying contributing actions and conditions, and their coding in
the crash record, a Bayesian approach was used to estimate the likelihood of
specific driver factors being recorded in fatal car-truck crashes as compared
with car-car crashes. The results indicate that most driver factors were equally
likely to be recorded for fatal car-truck crashes as for fatal car-car crashes. In
crashes for which driver factors were recorded, five of these equally likely fac-
tors (failing to keep in lane, driving too fast for conditions or in excess of post-
ed speed limit, failing to yield right-of-way, speeding, failing to obey traffic
control devices and laws, and inattentive) comprised about 65% of reported
unsafe car driver acts in both car-truck and car-car crashes.
Four driver factors were found to be more likely in car-truck crashes than in
car-car crashes:
• Drowsy, sleepy, asleep, or fatigued
• Following improperly
• Vision obscured by rain, snow, fog, smoke, sand, or dust
• Improper or erratic lane change
13
Two of these driver factors—following improperly, and improper or erratic lane
change — are actions of the driver. The other two factors — drowsy, sleepy,
asleep, or fatigued; and vision obscured by rain, snow, fog, smoke, sand, or dust
— are conditions of the driver (the first one is an indication of the driver’s phys-
ical condition; the second one is an external environmental condition that possi-
bly interacts with the driver’s physical condition, e.g., poor vision). These four
driver factors, however, were found in only about 5% of the car-truck crashes.
These results imply that driver actions contributing to fatal car-truck crashes
are similar to those contributing to fatal car-car crashes. However, the higher
likelihood that the factors of improper lane changing, improper following, and
driving while drowsy or fatigued or with obscured vision will be recorded in
fatal car-truck crashes than in fatal car-car crashes indicates that the conse-
quences of these actions are more severe for car drivers when they occur in the
vicinity of trucks than in the vicinity of other cars.
14
CHAPTER 2
The Second Stage of Research:
Detailed Review of Car-Truck Crash Records
The second stage of our research was to examine the set of car-truck crashes
characterized by one or more of the four driver factors that disproportionately
contributed to fatal car-truck crashes and to look for patterns in precrash events
or in driver characteristics. For this, we turned to hard-copy materials from the
Trucks in Fatal Accidents (TIFA) files of the Center for National Truck Statistics
(CNTS).
These annual TIFA files contain detailed data on heavy and medium-weight
trucks involved in fatal crashes in the United States. CNTS develops the TIFA
files from Fatality Analysis Reporting System (FARS) data, police accident
reports, and interviews both with truck owners or drivers and with police offi-
cers investigating the crashes. Because CNTS made the hard-copy materials used
to develop the TIFA files available to our research team, we read the original
police report, examined crash diagrams, and in some cases read through inter-
views with surviving vehicle occupants and witnesses to glean more information
than was contained in the electronic record of the event.
CASES INVOLVING THE FOUR DRIVER FACTORS
Our analysis file obtained from FARS for the years 1995–98 contained
records of 1,125 car-truck crashes, with at least one of the four driver-related fac-
tors identified above as more likely to contribute to car-truck crashes than to car-
car crashes. From these 1,125 crashes, a sample of 532 cases (47%) was drawn
randomly, and hard-copy TIFA crash records for these cases were requested from
CNTS. The research team reviewed material for 529 of these cases (no informa-
tion was available for 3 cases), reconstructing the behavioral sequences and identi-
fying the unsafe driver actions and conditions that led to these car-truck crashes.
In the 529 car-truck crashes, 626 people died — 403 (64.38%) were car drivers,
187 (29.87%) were car passengers, 33 (5.27%) were truck drivers, and 3 (0.48%)
were truck passengers.
The unsafe driver actions and conditions that were obtained from the narra-
tive description of the crash and used in this analysis included the original driver
factor and other actions or conditions of the driver that appeared to have con-
tributed to the crash — for example, driving under the influence of alcohol or
drugs, cutting off another vehicle, running a red light, not stopping for a stop
sign, and making an unsafe U-turn. A database was prepared that contained
15
information about the crash (time and date, age and gender of drivers, type of
crash, roadway, configuration and weight of the truck, type of passenger vehicle,
unsafe actions or conditions of the drivers of both vehicles before the crash, and a
short summary of the narrative). Information from this detailed review was
grouped into four sets, based on the original driver factor. Example cases from
the database are given in appendix E, which consists of summary tables of unsafe
driver actions and conditions for each of the four sets of crashes.
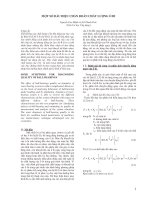
Table 2.1 gives some of the characteristics of the fatal car-truck crashes for
each of four sets of crashes defined by the original FARS driver factor. The table
summarizes much of what is known about car-truck crashes in general. More
than half of the fatal car-truck crashes in which a driver fell asleep were head-on
crashes, and more than one-quarter of these occurred between 3 and 6 a.m.
Most occurred on roads without physical barriers between opposing lanes (60%
occurred on undivided two-way roads, and 30% on divided roads without
median barriers). Almost all of the fatal crashes in which a driver was following
improperly were rear-end crashes. Although a greater portion occurred on divid-
ed roadways, the split between divided and undivided roads was relatively close.
Improper or erratic lane changes led to rear-end and sideswipe crashes. Most of
these crashes occurred on divided roadways. Two-thirds of the fatal car-truck
crashes that were a consequence of obstructed vision occurred on undivided
roadways, about a quarter occurred in January, and nearly a third occurred
between 6 and 9 a.m.
16
To explore patterns further, we grouped cases in each of the four sets accord-
ing to whether the unsafe actions and conditions were associated with the driver
of the car, with the driver of the truck, or with both (Table 2.2). Recall that
unsafe driver actions and conditions were identified in the review of the hard-
copy materials and included more information about the cause of the crash than
just the original driver factor.
Driver Factor Number
of Cases
Most
Frequent
Crash Type
(percent)
Most Frequent
Road Type
(percent)
Month with
Most Cases
(percent)
Hours with
Most Cases
a
(percent)
Drowsy,
sleepy,
asleep, or
fatigued
158 Head-on
(54.1)
Two-way, not
divided (60)
Divided with
median, no barrier
(30)
October
(12.7)
0300–0600
(27.4)
Following
improperly
172 Rear-end
(91.3)
Two-way, not
divided (42)
Divided (56)
October
(14.0)
1800–2100
(18.0)
Improper or
erratic lane
change
113 Rear-end
(31.8)
Sideswipe
(27.4)
Two-way, not
divided (15)
Divided (85)
Ap
(14.2)
ril 1500–1800
(18.6)
Vision
obstructed
by rain,
snow, fog,
smoke,
sand, or
dust
86 Angle
(44.2)
Two-way, not
divided (66%)
Divided (34%)
January
(24.4)
0600–0900
(30.2)
a
Hours are given in 24-hour style; e.g., 1300 = 1 pm.
Sources: Authors’ calculations using data from the Trucks in Fatal Accidents fi les of the Center for National
Truck Statistics and from the Fatality Analysis Reporting System.
17