Tài liệu Reclaiming city streets for people Chaos or quality of life? ppt
Bạn đang xem bản rút gọn của tài liệu. Xem và tải ngay bản đầy đủ của tài liệu tại đây (5.97 MB, 52 trang )
EUROPEAN COMMISSION
Directorate-General
for the Environment
Reclaiming city
streets for people
Chaos or quality of life?The quality of the environment in urban areas is of vital importance.
It is one of the main factors that determine whether a city is a healthy
place to live, whether we enjoy living there, and whether we want
our children to grow up there.
One of the key issues affecting the quality of the environment and the
quality of life in our towns and cities is road traffic. Heavy motor traffic
means poor air quality, unacceptable levels of noise and a weakened sense
of neighbourhood and local community. Traffic also gives rise to high costs
for the economy through delays caused by congestion.
Every year more than 3 million cars are added to the car fleet in Europe.
Total road traffic kilometres in urban areas will grow by 40 % between 1995
and 2030. Local authorities and citizens need to decide how to respond to
these pressures and decide what sort of place they want their town or city to
be in the future. One option is to try to eliminate congestion by building
more roads, but the costs — financial, social and environmental — can be
high and the relief short-lived. More and more cities are opting for a
different approach where they work together with their citizens to ensure
that they have access to the goods and services they need without having to
depend on road traffic.
There are many traffic management techniques and approaches and any
given city will probably need to develop a package of measures to manage
traffic effectively. This new handbook sets out some case studies where road
space has been reallocated for other uses. New, attractive and popular public
areas can be created on sites that were once blocked by regular traffic jams.
If these are properly planned, they need not result in road traffic chaos,
contrary to what might be expected.
I hope that cities and their citizens will consider this approach as part of the
solution to the growing levels of road traffic. This complements our earlier
publications, Cycling: the way ahead for towns and cities and Kids on the
move, which give examples of other case studies. I am convinced that traffic
management is the key to making our cities more attractive places to live in
and to improving the quality of our urban environment.
Margot WALLSTRÖM
Member of the European Commission
responsible for Environment
FOREWORD
S
e
f
c
CONTENTS
IDENTIFYING
THE ISSUES
T
he quality of life in many
European cities is affected by the
negative impacts of increasing traffic
levels. This chapter looks at ways in
which a dominance of car traffic
affects our lives in urban areas, and
suggests that there is a growing
consensus, from the global to the
local level, that the situation is
unsustainable.
Page 10
PROVIDING
GUIDELINES
R
edistributing road space in favour
of non-car modes can represent a
technically challenging and politically
sensitive planning option in urban
areas where road congestion is
already a problem.This chapter
brings together best practice from a
wide range of expertise and
experience in dealing with these
issues, in particular that drawn from
the schemes described in this
document. The objective is to assist
politicians and planners working to
develop more sustainable transport
strategies for Europe’s towns and
cities.
Page 50
FINDING
SOLUTIONS
T
he traditional response to the
problem of traffic congestion has
been to increase the road space
available for cars. In this chapter, the
theory of ‘traffic evaporation’ is
explored as a concept which
challenges the logic of this approach.
This theory supports the proposition
that reducing road capacity for cars
in congested city centres can
represent a sustainable, efficient
planning solution. In addition, once
freed from domination by car traffic,
reclaimed urban spaces can become
accessible, vibrant ‘living’ places.
Page 14
PRESENTING
THE CASE STUDIES
• Kajaani, Finland
• Wolverhampton, England
• Vauxhall Cross, London, England,
• Nuremberg, Germany
• Strasbourg, France
• Gent, Belgium
• Cambridge, England
• Oxford, England
T
his chapter presents the
experiences of a small selection of
European cities where urban
planners, with the political support of
local leaders, have had the vision and
the courage (often in the face of
considerable opposition) to take
away congested road space from
private cars. In each case study, after
an initial settling-in period, the
predicted traffic chaos did not
materialise and some of the traffic
‘evaporated’.
Page 20
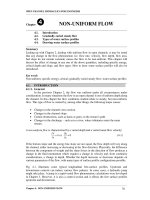
8 Traffic evaporation in urban areas
TRAFFIC EVAPORATION
IN URBAN AREAS
Introduction
b
9
he challenge facing urban planners and politicians in many European
towns and cities is that of balancing the demand for increasing personal
mobility and economic growth, with the need to respect the environment
and provide an acceptable quality of life for all citizens.
While it is clear that provision for car-based mobility will continue to be an
important part of traffic management planning, finding ways to encourage more
use of alternative modes of transport (public transport, cycling and walking) is
the goal of any sustainable urban policy. Where road space is restricted,
providing adequate space for these alternative modes may require a reallocation
of highway capacity. When the roads under consideration are already highly
congested, it is typically assumed that reducing the capacity available for cars will
result in increased traffic congestion in the surrounding streets. However, as the
evidence in this document demonstrates, this is not necessarily the case.
The experience in a number of European cities is that:
• traffic problems following the implementation of a scheme are usually far less
serious than predicted;
• after an initial period of adjustment, some of the traffic that was previously
found in the vicinity of the scheme ‘disappears’ or ‘evaporates’, due to drivers
changing their travel behaviour;
• as a result the urban environment becomes more liveable in many respects.
This handbook illustrates the concept of traffic evaporation using case studies
from a selection of European cities. Many of these cities have gone ahead with
road space reallocation schemes despite predictions that traffic chaos would
result. However, in each case any initial problems of traffic congestion were
short-lived, and after a ‘settling-in’ period a proportion of the traffic was found to
have ‘evaporated’.
In the attractive car-free spaces created in these cities, pedestrians and cyclists
now enjoy a cleaner, quieter and safer environment. These cases illustrate the
potential for more effective uses of urban road space, as ‘exchange space’ rather
than just ‘movement space’, recognising the social importance of streets and
squares.
Favouring more sustainable transport modes is an approach which promotes
social inclusion and accessibility for the nearly 30 % of European households
which have no access to a private car. Such strategies are also more equitable,
for they reduce those negative impacts of urban traffic and congestion which are
experienced by everyone, regardless of whether they are able to enjoy the
benefits of car use.
The purpose of this handbook is to show that such schemes can be highly
successful; they can represent a very positive sustainable planning option for
cities. The case studies here demonstrate the importance of well planned
integrated strategies, combined with effective public consultation and
communication. Above all, however, they show the need for vision and courage
on the part of the implementing local authority.
T
10 Identifying the issues
urope is the most urbanised continent in the world: at present over 80 % of its
population lives in towns and cities. At the same time car use in Europe is growing.
• In the EU between 1975 and 1995 the daily distance travelled per person doubled. A
further doubling of traffic is predicted by 2025.
• Half of all journeys in urban areas are less than 5 km long and a third are less than 3
km (
1
).
The challenges that increasing traffic and congestion pose in terms of environmental, social
and economic costs for urban communities are illustrated in the diagram opposite.
IDENTIFYING THE ISSUES
Chapter 1
GROWING TRAFFIC PROBLEMS IN
EUROPE’S CITIES
c
(
1
) Source: />E
11
COMPETITIVENESS
Traditional centres face competition from
less congested out-of-town retail centres.
SEVERANCE
Congested urban roads cause severance of
communities which can have a social cost.
EQUITY
Nearly 30 % of households in Europe have no access to
a car — they pay the price of traffic without enjoying
mobility benefits offered by car ownership.
THE MAIN PROBLEMS ASSOCIATED WITH INCREASING URBAN TRAFFIC
AND CONGESTION
ECONOMIC EFFICIENCY
Traffic congestion, pollution and accidents result in
significant direct and indirect costs. The total bill
has been estimated at EUR 502 billion per year
across the EU Member States (
2
).
LOSSOFURBAN‘LIVING SPACE’
Motorised transport infrastructure- such as roads and
car parking — takes up highly valuable city centre land,
and spoils and threatens existing open spaces.
AIR POLLUTION
Multiple effects including global warming, health problems
& building decay. The Department of Health in the United
Kingdom estimates the health costs of particulates in urban
areas of Britain to be up to GBP 500 million per year (
3
).
ACCIDENTS
Over 40 000 deaths on Europe’s roads/year, of these
four times more fatalities occur in urban areas (
5
).
ENERGY CONSUMPTION
Transport consumes 4 % more energy every
year which represents a doubling of energy
used every 20 years (
4
).
NOISE AND VIBRATION
Transport is one of the main sources of
urban noise pollution.
VISUAL INTRUSION
Diminished quality of the urban
environment caused by parked cars and
other infrastructure.
INCREASING MOTORISED VEHICLE
DOMINANCE AND CONGESTION
(
2
) External costs of transport: accident environmental and congestion costs of transport in western Europe, March 2000. INFRAS
consulting group for policy analysis and implementation (www.infras.ch) and IWW, Universitaet Karlsruhe, Germany
(www.iww.uni-karlsruhe.de).
(
3
) Economic appraisal of the health effects of air pollution, prepared by the ad-hoc group on the economic appraisal of the health
effects of air pollution, 1999.
(
4
) Source: Eurostat.
(
5
) Source: European Environment Agency, indicators on transport and environment integration in the EU, 2000.
N
e
g
a
t
i
v
e
i
m
p
a
c
t
o
n
u
r
b
a
n
q
u
a
l
i
t
y
o
f
l
i
f
e
N
e
g
a
t
i
v
e
i
m
p
a
c
t
o
n
u
r
b
a
n
q
u
a
l
i
t
y
o
f
l
i
f
e
it possible to most effectively solve environmental
problems linked to the traffic in town?’
13
Global pressure for change
The past two decades have seen growing international concern over the impact
of human activities on climate and the atmosphere. Increasing levels of
greenhouse gas emissions are central to these concerns (
6
). The rapidly growing
transport sector consumes an increasing proportion of total energy and
contributes a growing percentage of global air emissions. More sustainable
transport strategies (
7
) are needed as a matter of international priority.
Citizens in Europe are calling for change
In Europe a majority of citizens are calling for changes to promote modes of
transport which are more respectful of their environment. In 1999, 70 % of
Europeans said they were more worried than they were in 1994 about the quality
of the air they breathe. They put air pollution at the top of their list of
environmental concerns and quoted car traffic problems as the main reason for
their discontent as far as the environment in which they lived was concerned (
8
).
Recent surveys have shown that most EU citizens identify as a priority the need
to address the issue of too many cars in urban areas, and the pollution, noise
and dangers they present. In 2002, more than two-thirds of those surveyed
considered environmental factors to be the most important influences on their
quality of life and half identified traffic congestion and over reliance on the car as
key concerns where they lived (
9
). Furthermore, as the chart opposite
demonstrates (
10
), when people were asked to identify effective solutions to solve
environmental problems linked to traffic in towns, priority was given to improving
the quality of more sustainable transport modes and greatly reducing the
dominance of car traffic.
(
6
) The Kyoto Protocol, 1997 set the key target of the reduction of specified greenhouse gases to at least 5 % below 1990 levels by
2008–12.
(
7
) The September, 2001 EC White Paper, Communication COM(2001)370 ‘European transport policy for 2010; time to decide’ sets out
a European strategy for tackling the problems of rising personal motorised mobility.
(
8
) Source: European Commission Eurobarometer, />(
9
) Source: Flash Eurobarometer, April 2002 (EC — Environment DG).
(
10
) Source: Eurobarometer 1999.
Create more pedestrianised areas
Improve public transport
Greatly reduce car traffic
Greatly reduce the number of parking space
in town centres
Create more cycle lanes
Build new express routes within towns
Make motorists pay a toll to enter a town
Increase the price of fuel
Don't know
Others
Nothing
10% 20% 30% 40% 50% 60% 70% 80%
Source: Eurobarometer, 1999 (51.1).
14 Finding solutions
THE TRADITIONAL APPROACH TO THE PROBLEM
As car ownership and use have increased over the past 30 years the reaction to
the pressure created by additional traffic demand has often been to increase the
level of supply, in other words provide additional road space. This traditional
approach of providing supply to meet demand is no longer always appropriate.
There is a growing body of evidence indicating that the benefits of creating
additional road capacity are not as significant as was previously believed. In
extreme cases the provision of new road links may in fact increase congestion
problems. This occurs through a process that is known as traffic ‘induction’.
In 1994, the UK Government-commissioned Sactra report (
1
) provided evidence
on the impact of new road building on traffic levels in the area of the scheme.
The report revealed that when new road capacity is provided, overall traffic
levels in the vicinity of the scheme may actually increase. The evidence does not
offer a reliable means of predicting the extent of this traffic increase but case
studies suggest that it is typically around 10 % in the short term, and 20 % in
the longer term.
In our cities there is an additional reason as to why the provision of additional
road capacity is problematic for city planners — there is simply a lack of available
space in which to expand.
FINDING SOLUTIONS
Chapter 2
d
(
1
) Sactra (1994) Standing Advisory Committee on Trunk Road Assessment. ‘Trunk roads and the generation of traffic’. Link to this
report via European Federation for Transport and the Environment,
A NEW APPROACH
In some cities where there is enough space it may be possible to promote non-
car modes of transport (e.g. pedestrianising some streets or restricting them to
buses, bicycles and taxis only), without affecting the amount of road space
available to private cars. It may also be possible to consider these options where
traffic congestion is not severe and where taking road space from private cars
will not have much affect on traffic flows even during peak hours.
However, the principal challenge for most European cities is to find ways of
using the existing road capacity more efficiently. There is a growing recognition
that this may require giving greater priority to more sustainable forms of
transport — public transport, pedestrians and cyclists. Some pioneering cities, for
example Copenhagen in Denmark, have adopted such a policy for many years
with great success (see pages 16 and 17).
The greatest challenge is presented in cities or areas of cities where road
conditions are already congested, in particular during peak times. In these cases
the only way to provide more space for more sustainable modes of transport is
to take road space from private cars, either on a permanent 24-hour or on a
temporary ‘shift’ basis.
Taking capacity away from the dominant road user (i.e. the private car) is a
brave decision for an authority to take. Logic suggests that if a network is already
congested, the removal of capacity can only exacerbate the situation.
Public concerns usually focus on predictions of traffic chaos and adverse
economic impacts. In the face of such reaction, planning authorities and
politicians may lose courage and abandon proposals to reallocate road space. In
such circumstances new ideas, such as the concept of ‘traffic evaporation’ (which
challenges the assumption that traffic congestion will necessarily worsen if road
capacity is reduced), can lend valuable support as to the technical feasibility of
creative traffic management solutions.
15
Every mode of transport uses space for moving and parking
over a period of time. Moving and parking can be
aggregated into one unit of measurement: space x time
expressed in m
2
x hour.
The most demanding mode of transport in terms of space is
the private car. For example, a journey home or to work by
car consumes 90 times more space than if the same journey
was taken by bus or tram.
The waste of limited urban space
75 people are carried either
by 60 cars
or only 1 bus
Pedestrian
Rail user Private car
(shopping)
Private car
(home to work)
Parking
Moving
Area x time consumption
for a 5 km return trip
(10 km total trip)
Source: Sti, Thun, Switzerland
‘Instead of wide, noisy streets in and out of the city and
six storey underground parking all over the city centre,
Copenhagen has opted for fewer cars and an extremely
attractive city centre. Copenhagen is living proof that it
works’. (Jan Gehl and Lars Gemzøe 1996).
Development of
car-free streets and
squares in
Copenhagen city
centre —1962-96
1962 : 15 800 m
2
1996 : 95 750 m
2
16 Finding solutions
COPENHAGEN— A CITY WITH A VISION
Until 1962, all streets in the medieval city centre were filled with cars and all the
squares were used as car parks. As car traffic increased, conditions for
pedestrians were rapidly deteriorating.
On 17 November 1962, Copenhagen’s main street, Strøget was pedestrianised.
This conversion was hotly debated at the time. People argued that a pedestrian
street in Denmark would never work. However although scepticism was high,
the new car free environment proved extremely popular with local residents
from the first day.
This marked the beginning of a gradual transformation that has continued ever
since. Today Copenhagen has a vibrant city centre that attracts visitors
throughout the year.
Today the city of Copenhagen has over 96 000 m
2
(of which 33 % is street and
67 % city squares) of car-free space.
While pedestrian traffic levels have remained largely unchanged over past
decades, activities connected with stopping and staying are almost four times
greater than in 1968. During the summer months many of the pedestrian streets
are full to capacity with people enjoying the many outdoor social and cultural
activities. In the winter months attractions include festivals, and outdoor ice
skating.
Strædt before (left) and
after (right) pedestrian
prioritisation in 1992
Rådhuspladsen
(Town Hall Square)
before (above) and after
(below) transformation
in 1996
As the streets and squares in the city centre have been pedestrianised and
improved, the area has become more attractive yet also less accessible for the
motorist. The city authority has adopted an integrated traffic management
strategy for the city centre:
• limiting the number of parking spaces (charges for on-street parking are
relatively high);
• reducing the number of lanes on several main routes into the city and using
the space for bus and cycle lanes instead;
• restricting through traffic;
• while developing the suburban train, bus and bicycle networks.
In the city centre, 80 % of all journeys are made on foot, and 14 % by bicycle.
Car traffic in the city core has been reduced and congestion is not a problem.
The key to the success of these inner city transformations was undoubtedly the
gradual way these rather drastic changes were made. This incremental approach
has given residents time to adapt, to change from driving and parking their cars
to walking, using bicycles and public transport.
17
Source: ‘Public spaces, public life’, 1996, Jan Gehl and Lars Gemzøe, The Danish Architectural Press
and the Royal Danish Academy of Fine Arts School of Architecture Publishers.
Source: ‘New city spaces’, 2001, Jan Gehl and Lars Gemzøe, The Danish Architectural Press.
CHALLENGING ASSUMPTIONS:
THE CONCEPT OF TRAFFIC EVAPORATION
There is a growing body of evidence that where well-planned measures to
reduce road space for private cars are implemented in congested areas and
where no alternative network capacity is available, over the long term the
predicted traffic chaos does not occur. This evidence is most notably presented
in an important report (
2
) commissioned by the UK Department for
Environment, Transport and the Regions (
3
) and London Transport (
4
).
(
2
) Cairns S, Hass-Klau C, Goodwin P B (1998) ‘Traffic impact of highway capacity reductions: assessment of the evidence’: London,
Landor Publishing.
(
3
) Now the Department for Transport, Local Government and the Regions.
(
4
) Now Transport for London.
‘Traffic impact of highway capacity reductions —
assessment of the evidence (1998)’ S. Cairns, C. Hass-Klau
and P. B. Goodwin
Data taken from nearly 100 locations showed traffic chaos to be limited to a ‘settling-
in period’.
• Wide range of results, with a 25 % average overall reduction in traffic and
a 14 % median reduction in traffic (i.e.‘traffic evaporation’).
A proportion of traffic which had previously used the affected road(s)
could not be found in neighbouring streets.
Traffic evaporation is likely to occur where road space has been reduced for private
cars and where, due to general traffic levels or the design and area covered, drivers
cannot find:
• an alternative route, or
• an alternative time of day to travel,
without experiencing severe congestion (recognising that driver behaviour will also be
affected by additional factors such as the availability of alternatives including avoiding
the need to travel or making use of public transport).
18 Finding solutions
Contrary to widespread assumptions car drivers adapt to changes in road conditions
in highly complex ways which computer models cannot accurately predict.
Short term
• initial cramming of roads was followed by searching for alternative routes and times
to travel.
Medium term
• More varied and flexible trip-planning;
• changing mode of transport;
• reviewing the need to travel;
• trip combining.
Longer term
• switching locations of activities or even home or workplace.
Individually or in combination these diverse driver
responses to congestion can result in a proportion of
traffic ‘evaporating’
19
The traffic induction cycle
• In the short and medium term, some people will simply use the time
savings afforded by the new road to drive further — for example, to a
shopping centre.
• In the longer term the road will influence people’s locational decisions
particularly with respect to where they choose to live in relation to their
work.
• The evidence again suggests that some people will simply choose to travel
further in the same time rather than ‘accept’ the time-saving on offer.
INCREASE IN
ROAD PROVISION
Car user changes
Journey-specific
behaviour — for
example, route/time
of travel
(short term)
Car user changes
choice of amenities
frequented — for
example, for
shopping, leisure
(medium term)
Car user changes
locational choices
— for example,
housing, work,
retirement
(long term)
INCREASED
CONGESTION ON
EXISTING ROADS
The capacity of individual car users to change their travel behaviour
in a range of creative ways, when faced with the problem of severe
traffic congestion, presents real opportunities for urban planners who
seek to optimise the use of space and quality of life in the city.
Increase in travel demand
Increase in travel demand
Increase in travel demand
Support for the concept of traffic evaporation can be found indirectly in the
similar, but opposite phenomenon known as traffic induction (where traffic
generation occurs in response to new road provision). Whilst not proof itself
that traffic evaporation will always result from road capacity reduction, this
concept equally relies upon the complexity and adaptability of driver response
to changes in road conditions.
e
20 Case study
CASE STUDIES
Chapter 3
Ghent
Kajaani
Cambridge
Strasbourg
Opportunities for regeneration
• Case study 1 — Kajaani - FINLAND
• Case study 2 — Wolverhampton - ENGLAND
• Case study 3 — Vauxhall Cross — London — ENGLAND
From urban smog to urban life
• Case study 4 — Nuremberg — GERMANY
Creating space for sustainable transport
• Case study 5 — Strasbourg — FRANCE
• Case study 6 — Ghent — BELGIUM
• Case study 7 — Cambridge — ENGLAND
• Case study 8 — Oxford — ENGLAND
The case studies presented give a taste of some of the innovative approaches
that local authorities and politicians are taking in towns and cities in Europe to
tackle the growing problem of motorised traffic. Each city’s road space
reallocation project has been one part of an integrated strategy with a number of
complementary elements including upgrades to public transport, improvements
to walking and cycling facilities, and renovation of the urban streetscape. In each
case study it is possible to identify a particular benefit resulting from road space
reallocation. The case studies have been divided into groups in order to illustrate
the following themes:
• Opportunities for regeneration;
• From urban smog to urban life;
• Creating space for sustainable transport.
In the majority of the case studies, planners and politicians have encountered
opposition on two main counts: firstly that existing congested conditions will be
made worse and secondly that retail trade will suffer. In some cases the protests
have been very powerful. In each of the examples, a long period of consultation
and extensive communications campaigns have been undertaken, in some cases
lasting many years. At the end of this consultation period, despite opposition, the
road space reallocation has gone ahead. In all cases, after an initial ‘settling-in’
period, the predicted traffic chaos did not materialise and a proportion of the
traffic disappeared. The scale of the impacts on retailers is more difficult to
judge; however in the majority of cases, trade has improved.
The overriding motivation in all these examples has been a vision and
commitment to finding more sustainable and socially inclusive transport
solutions. The aim has been to improve the quality of life of those who visit,
work or live in the city.
Oxford
Nuremberg
Vauxhall Cross, London
Wolverhampton
CAVEATS
It is important to acknowledge that for some of the case studies included in this
report, the traffic data available is not always complete, or able to give a
sufficient perspective through time. Some cases necessarily rely upon
observations by transport department officers.
There may be a number of sources of bias in monitoring data which affect
interpretation of changes in traffic volumes. Note, in particular, the following
points:
. Random variations due to the ‘natural’ variability in traffic are not reflected in
one-day traffic counts.
. Traffic counts are unlikely to take full account of longer distance detours
(outside a measurement zone) made on some journeys by drivers avoiding
the road measures.
. Short distance diversions within the study area will not be detected using
screen line measurements which only record the number of vehicles passing
— changes in the number of trips or mode of transport used will not be
detected.
. Traffic growth which occurs due to non-road measure factors such as
increases in income, car ownership, demographic effects or land-use
changes will not be readily isolated from the actual impact of road capacity
reduction. This may lead to a significant underestimation of the positive
effects of road capacity reduction.
Despite these caveats, the case studies presented here confirm previous
research showing that, in the majority of road capacity reallocation case studies,
a significant reduction in traffic was observed, despite a broader context of rising
levels of car ownership and general increasing levels of traffic in urban areas.
21
22 Case study — ‘Opportunities for regeneration’
Case Study 1
Kajaani, FINLAND
This case study involved the closure of the main square and a section of the
main high street in Kajaani to traffic as part of an integrated response to
traffic congestion and urban decline.
Prior to the road reallocation scheme approximately 13 000 vehicles per day
drove through the main square. Now there is no car traffic. Traffic flow in
streets adjacent to the square has risen from 1 000 to 6 500 vehicles per day,
while in other streets there has been no change in traffic flows (
1
). Some of
the traffic has ‘evaporated’, more trips in the city centre are now made on
foot.
BACKGROUND
Kajaani lies 570 km to the north of Helsinki in north-east Finland. The city dates from
the 17
th
century and is the cultural, industrial, administrative and commercial centre of
its region.
During the early 1990s Kajaani city centre was in decline due to a combination of
factors including:
• traffic congestion in the main high street, and associated problems of air and noise
pollution;
• competition from hypermarkets;
• net migration of population from the city;
• high level of empty properties leading to urban decay.
THE STRATEGY: HYVÄ KAJAANI ‘GOOD KAJAANI’
An active strategy to regenerate the city centre was initiated in 1996 by the local
authority, as part of a national initiative ‘Better town centres’ financed by the Ministry
of Environment, the Ministry of Transport and the Ministry of Commerce.
Central to the strategy was the pedestrianisation of a section of the congested main
high street and main city square in 1998. Exclusion of car traffic from the main square
had been the subject of heated debate for over 20 years. It was finally made possible
in 1996 with the support of an alliance of the local authority, developers, shopkeepers
and residents (formalised in 1998 with the establishment of the ‘city-centre society’) in
the realisation that action was needed to stem the decline of Kajaani city centre.
(
1
) Source: City of Kajaani.
23
The project area has now been upgraded: the whole area is paved with stone, there
are new trees, benches, lighting, a performance stage and a fountain. The integrated
strategy also includes active marketing of the city centre, the development of new
shopping yards, and residential properties above shops along the main street, the
promotion of public transport services, some replacement parking outside the
pedestrian zone, and the development of new cycle paths both to and within the town
centre.
THE RESULTS
Traffic flows
Initially traffic congestion in the project area did increase, but this did not last long.
While a proposition of the 13 000 cars per day that once passed through the now
pedestrianised city square did transfer to adjacent streets, this did not account for all
of the previous traffic volume. Some of the traffic seems to have disappeared or
‘evaporated’. There has been an increase in pedestrian journeys to and within the city
centre (
2
).
Enhancement of public spaces and civic pride
A recent opinion poll (
3
) established that local residents feel that the town centre is
now prettier, more comfortable and safer than it was before. The main square is now
the place which is shown to visitors and of which the inhabitants are proud. Local
people now think that the best way to improve the city centre is to enlarge the
pedestrianised area.
(
2
) Parempi kaupunkikeskusta (Suomen ympäristö 186), Ympäristöministeriö, Helsinki 1998 (in Finnish).
(
3
) Two hundred on-street interviews were carried out in 1998 and 2000. In addition, 500 questionnaires were sent by post to
inhabitants in 1977 (269 responses) and in 2000 (124 responses).
Main square
before and after
pedestrianisation in
1998
LEGEND
■
Pedestrian zone
KAJAANI CITY CENTRE
Before the project: 60 % of inhabitants thought that Kajaani was a good town to live
in, and 47 % of the inhabitants thought that the centre of Kajaani was beautiful. (1977)
After the project: 80 % thought that Kajaani was a good town to live in and 60 %
thought that the centre was beautiful; 55 % wanted the pedestrian area to be enlarged.
(2000)
Commercial activity
A survey of retailers (
4
) found that 52 % felt that the scheme had improved or would
improve their business in the future.
24 Case study — ‘Opportunities for regeneration’
KEY SUCCESS FACTORS/LESSONS LEARNT (
5
)
• A partnership approach: the formation of a ‘coordinating group’
and a ‘city-centre society’ representing stakeholders (the city
authorities, developers, shopkeepers and residents) to provide
active support for the strategy was the key success factor in this
case study.
• Clear political vision and commitment by the city council to solving
problems of traffic congestion and urban decline, including the
difficult decision to prioritise funding for the initiative over
competing demands.
• An integrated regeneration strategy including road reallocation,
improvement of urban environment and a marketing strategy for
the city.
• Involvement of the public with surveys before and after the
implementation of the project.
(
4
) In 2000, a questionnaire was circulated to all retailers (190 in total) occupying first floor shops in the city centre, 110 responses were
received.
Main square
before (left) and after
(right) pedestrianisation
in 1998
(
5
) Source: Mr Seppo Karpinnen, Managing Director, Esisuunnittelijat Oy (Consultancy).
This case study examines a response to intense traffic congestion, worsening
environmental conditions and declining economic activity in
Wolverhampton in the face of competition from other shopping centres in
the city of Telford to the west, and the Merry Hill complex to the south-east,
and additional planned retail centres.
In 1986, the local authority commissioned ‘The Black Country Integrated
Transport study’ which concluded that building more roads would not solve
the growing transport problems. A more effective strategy would be to give
greater priority to public transport and to put greater emphasis on
improving the urban environment by creating an attractive physical space
that would meet the public’s expectations.
The response was a four-stage strategy, central to which was the removal of
approximately 8 000 through-traffic cars per day from the city centre. The
predicted traffic congestion did not occur. A significant percentage of traffic
appears to have disappeared from the city centre, a result which could not
be solely explained by displacement to other routes.
BACKGROUND
Wolverhampton is located 15 miles to the north-west of Birmingham on the fringe of the
West Midlands conurbation. During the 1980s the city experienced the decline of the
manufacturing industry and subsequent high unemployment levels.
During this period the city centre was experiencing worsening environmental conditions
due to increasing traffic flows, frequent traffic gridlock, decline in the reliability of public
transport and reduced access to city centre locations including car parks.
The public image of the city as a shopping centre was in decline. Surveys identified
traffic congestion and problems of access as having a significant detrimental impact on
the retail industry in the city.
THE STRATEGY: AFOUR-PHASE INTEGRATED TRANSPORT STRATEGY
Between 1987 and 1991, a four-phase transport strategy was introduced with the aim
of achieving ‘a major impact not only on travel, but also on the future promotion of
Wolverhampton as a subregional centre’ (
6
).
Private car through-traffic was gradually removed by closing the central core roads,
effectively blocking the main north-south and east-west routes through the city, and
rationalising circulation within the town centre while implementing complementary
upgrading and refurbishment of city centre streets. City centre access was restricted to
buses, taxis, pedestrians and cyclists, with restricted access for service traffic. Specific
parking spaces were provided for street traders and disabled ‘orange badge’ holders.
In 1991, the fourth phase was implemented which removed through traffic from the town
centre. While key to the success of the overall town centre strategy, this phase was also
the most contentious. In preparation for the changes, a lengthy and extensive consultation
process was undertaken, backed, critically, by firm political support.
25
(
6
) Malcolm Read, Chief Engineer and Assistant Director, Highways and Transportation Division. In traffic engineering and control,
1998.
Case study 2
Wolverhampton, ENGLAND
RESULTS
Traffic flows
With each phase, after an initial ‘adjustment’ period, drivers soon became used to the
new road layout and any initial congestion was short-lived.
After Phase 4 in which all through traffic was removed from the city centre, the data
suggests that the traffic absent from the inner ring road cordon (which had fallen by
14 % between 1990 before the closure and 1996) appears not to have transferred to
the outer ring road, where the cordon count went down by just over 1 %. Some of
the traffic appears to have ‘evaporated’.
Effects of road closure on traffic flows
24-hour, two-way November 1990 November 1996 Total
traffic flows before Phase 4 after Phase 4
change
Cordon on 222 900 220 300 -2 600 (-1.17 %)
approach roads
outside ring road
Cordon on roads 81 500 69 750 -11 750 (-14.42 %)
within the ring
road
TO M54 & STAFFORD
TELFORD A41, BRIDGNORTH A454
Pedestrian streets
Metro line
Parking
One way streets
Bus only lanes
LEGEND
BUS
STATION
WOLVERHAMPTON
STATION
A
4
1
2
4
W
E
D
N
E
S
F
I
E
L
D
&
L
I
C
H
F
I
E
L
D
A
4
4
9
S
T
A
F
F
O
R
D
,
M
5
4
&
M
6
(
N
)
DARLINGTON STREET
A41 BILSTO
N & W. BRO
MW
ICH
QUEEN SQ.
LICHFIELD STREET
PRINCESS STREET
DUDLEY STREET
VICTORIA STREET
CLEVELAND STREET
METRO
TERMINUS
A 449
A 459
RING ROAD
26 Case study — ‘Opportunities for regeneration’
Queen’s Square:
before (left) and after (right) renovation
Source: Wolverhampton City Council.
WOLVERHAMPTON CITY CENTRE
27
KEY SUCCESS FACTORS/ LESSONS LEARNT
‘The principal lessons learnt have been the need to have a clear
vision of the future importance of harnessing public support
through high-profile publicity and consultation, and when doubts
begin, of firm political support.’ (
7
)
Queen’s Square:
before (left) and after (right) renovation
(
7
) Malcolm Read, Chief Engineer and Assistant Director, Highways and Transportation Division. In traffic engineering and
control, 1998.
Public transport
With each phase of the scheme, public transport reliability improved. Public transport
has increased its modal share of trips from 23 % in 1994 to 26 % in 2000. The current
target is 29 % by 2006.
The project has been a success and has had knock-on effects in the proliferation of
public transport opportunities, which were contingent on the closure of the city centre
to through- traffic, including a number of priority bus lanes linking the city centre with
the city outskirts, and a new city centre connection with Birmingham via the light-rail
rapid transit system.
Public opinion
Initial negative reactions from the local media and some local groups became more
favourable as the benefits of the scheme, a cleaner, safer and more attractive city with
better access, became more apparent.
Civic pride
The improved image of the city and the enhanced shopping and general commercial
environment is one of the most positive aspects of the scheme. In 1993,
Wolverhampton won the ‘Town-centre environment award’, awarded by the British
Council of Shopping Centres. Wolverhampton was made a city in November 2000. The
quality of the centre continues to improve with new investment being attracted and a
major phase of expansion of the city’s university initiated. These improvements have
been contingent upon better city centre access and environmental quality.