Tài liệu Báo cáo khoa học: Influence of modulated structural dynamics on the kinetics of a-chymotrypsin catalysis Insights through chemical glycosylation, molecular dynamics and domain motion analysis pptx
Bạn đang xem bản rút gọn của tài liệu. Xem và tải ngay bản đầy đủ của tài liệu tại đây (1.01 MB, 17 trang )
Influence of modulated structural dynamics on the
kinetics of a-chymotrypsin catalysis
Insights through chemical glycosylation, molecular dynamics and
domain motion analysis
Ricardo J. Sola
´
and Kai Griebenow
Laboratory for Applied Biochemistry and Biotechnology, Department of Chemistry, University of Puerto Rico, Rı
´
o Piedras Campus, San Juan,
PR, USA
Unraveling the general mechanisms by which enzymes
catalyze chemical reactions is fundamental to the
understanding of biochemical processes. While the
chemical basis of enzyme catalysis is largely under-
stood the same cannot be said about the influence of
the intrinsic protein structural dynamics on enzyme
catalysis [1–4]. Although it has been known for dec-
ades that proteins are highly dynamic molecules which
undergo a variety of structural motions [5,6] only
recently has the relationship between protein structural
Keywords
a-chymotrypsin; enzyme catalysis;
glycosylation; molecular dynamics; serine
protease
Correspondence
K. Griebenow, Department of Chemistry,
University of Puerto Rico, Rı
´
o Piedras
Campus, Facundo Bueso Bldg Laboratory-
215, San Juan 23346, PR 00931-3346, USA
Fax: +1 787 756 7717
Tel: +1 787 764 0000 ext.7815
E-mail:
(Received 5 July 2006, revised 26
September 2006, accepted 4 October 2006)
doi:10.1111/j.1742-4658.2006.05524.x
Although the chemical nature of the catalytic mechanism of the serine pro-
tease a-chymotrypsin (a-CT) is largely understood, the influence of the
enzyme’s structural dynamics on its catalysis remains uncertain. Here we
investigate whether a-CT’s structural dynamics directly influence the kinet-
ics of enzyme catalysis. Chemical glycosylation [Sola
´
RJ & Griebenow K
(2006) FEBS Lett 580, 1685–1690] was used to generate a series of glycosyl-
ated a-CT conjugates with reduced structural dynamics, as determined
from amide hydrogen ⁄ deuterium exchange kinetics (k
HX
). Determination
of their catalytic behavior (K
S
, k
2
, and k
3
) for the hydrolysis of N-succinyl-
Ala-Ala-Pro-Phe p-nitroanilide (Suc-Ala-Ala-Pro-Phe-pNA) revealed
decreased kinetics for the catalytic steps (k
2
and k
3
) without affecting sub-
strate binding (K
S
) at increasing glycosylation levels. Statistical correlation
analysis between the catalytic (DG
„
k
i
) and structurally dynamic (DG
HX
)
parameters determined revealed that the enzyme acylation and deacylation
steps are directly influenced by the changes in protein structural dynamics.
Molecular modelling of the a-CT glycoconjugates coupled with molecular
dynamics simulations and domain motion analysis employing the Gaussian
network model revealed structural insights into the relation between the
protein’s surface glycosylation, the resulting structural dynamic changes,
and the influence of these on the enzyme’s collective dynamics and catalytic
residues. The experimental and theoretical results presented here not only
provide fundamental insights concerning the influence of glycosylation on
the protein biophysical properties but also support the hypothesis that for
a-CT the global structural dynamics directly influence the kinetics of
enzyme catalysis via mechanochemical coupling between domain motions
and active site chemical groups.
Abbreviations
a-CT, a-chymotrypsin; exchange, kinetics (k
HX
); GNM, Gaussian network model; H ⁄ D, hydrogen ⁄ deuterium; MD, molecular dynamics; pNA,
p-nitroanilide; QM, quantum mechanics; Suc, N-succinyl; SBzl, thio-benzyl; SS-mLac, mono-(lactosylamido)-mono-(succinimidyl) suberate;
SS-mDex, mono-(dextranamido)-mono-(succinimidyl) suberate; VDW, Van der Waals.
FEBS Journal 273 (2006) 5303–5319 ª 2006 The Authors Journal compilation ª 2006 FEBS 5303
dynamics and enzyme catalysis become generally evi-
dent within multiple enzyme systems [7–11]. Due to
this it has been proposed that enzymes can accelerate
chemical reactions by lowering the transition state
free-energy of activation barrier (DG
TS
) through
the influence of global thermally coupled structural
motions (DG
Dyn
) on the turnover step [12–15]. One
such enzyme for which this phenomenon has been pro-
posed to occur but has not been fully experimentally
shown is a-chymotrypsin (a-CT; EC 3.4.21.1) [16–19].
Being a representative member of the chymotrypsin-
fold serine protease family, it catalyzes the selective
hydrolysis of amide bonds adjacent to bulky hydro-
phobic side chains (Tyr, Trp, and Phe) from its peptide
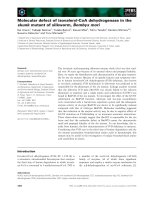
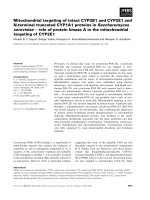
and protein substrates. Its catalytic cycle (Fig. 1) first
involves the formation of a substrate–enzyme complex
(ES), followed by formation and breakdown of the
first tetrahedral intermediate (ES)
TET1
leading to the
liberation of the reaction’s first product and enzyme
acylation. The catalytic cycle ends with the hydrolysis
of the acyl-enzyme intermediate, followed by forma-
tion and breakdown of a second tetrahedral intermedi-
ate (EP
2
)
TET2
, and liberation of the reaction’s second
product with restoration of the original free enzyme.
From a structural perspective a-CT is composed of
two six-stranded b-barrel domains with the nature of
its collective structural dynamics being attributed to
interdomain hinge-bending motions [16,20,21]. Due to
the location of the active site residues at the interface
between these two structurally rigid b-sheet domains it
has been suggested that global structural flexibility
could directly influence their displacements, thus
impacting the reaction kinetics [16,21–23]. Theoretical
free-energy calculations of the catalytic cycle for struc-
turally related serine proteases (trypsin, elastase) have
also suggested the necessity of structural displacements
for the catalytic residues so that acylation and deacyla-
tion can take place [24–29]. Thus, both local active site
residues and global domain motions are thought to be
implicated in the catalytically relevant structural
dynamics of the enzyme.
The influence of structural dynamics on the
enzyme’s kinetics has also been suggested in previous
experimental works. From
1
H-NMR studies on the
His57–Asp102 low barrier hydrogen bond, Frey and
coworkers proposed the involvement of a conforma-
tional change during the formation of the tetrahedral
intermediate [30]. Kawai et al. also studied the effect
of medium viscosity on the hydrolysis of p-nitrophenyl
ester and p-nitroanilide amide substrates [19,31]. While
for ester substrates the acylation and deacylation rates
were found to decrease with increasing viscosity, for
amide substrates they found the acylation step to be
viscosity-independent. From these results they pro-
posed a catalytic mechanism in which induced-fit con-
formational changes occur during the formation of the
first tetrahedral intermediate and during the break-
down of the second tetrahedral intermediate. Alternat-
ively, thermodynamic kinetic work by Stein and
coworkers revealed that the enzyme displays convex
Eyring plots only for the acylation step (k
2
) during the
hydrolysis of amide substrates of differing peptide
chain length [17]. From these results the researchers
proposed that the convex Eyring plots could arise from
the coupling of protein structural isomerizations to the
active site chemistry [17,18]. While all of these experi-
mental works suggest the possible involvement of
structural dynamics in the various kinetic steps of
a-CT catalysis, no actual measurements of protein
structural dynamics were performed to explain the
observed kinetic catalytic behavior. Thus, the question
of whether the kinetics of a-CT catalysis are influenced
by the enzyme’s intrinsic structural dynamics still
remains experimentally unanswered.
Due to the well documented effect of natural glycans
in modulating glycoprotein structural dynamics and
function [32–35], chemical glycosylation represents a
straightforward methodology to study the role of pro-
tein structural dynamics on enzyme catalysis [36].
Herein we designed a series of differentially glycosylat-
ed a-CT variants with sequentially reduced structural
dynamics through chemical glycosylation with mono-
functionally activated glycans of differing molecular
masses [36,37]. These were employed in this work to
address experimentally the questions of whether and
how the enzyme’s structural dynamics influence the
kinetics of a-CT catalysis. This was done by determin-
ing the changes in the global structural dynamics
(DG
HX
) [38] for the various chemically glycosylated
a-CT conjugates through amide hydrogen ⁄deuterium
(H ⁄ D) exchange kinetic (k
HX
) experiments and then
performing statistical correlation analysis with their
kinetic parameters (K
S
, k
2
, and k
3
) for the hydrolysis
of N-succinyl-Ala-Ala-Pro-Phe p-nitroanilide (Suc-Ala-
Fig. 1. General mechanism of serine prote-
ase catalysis.
Structural dynamics and serine protease catalysis R. J. Sola
´
and K. Griebenow
5304 FEBS Journal 273 (2006) 5303–5319 ª 2006 The Authors Journal compilation ª 2006 FEBS
Ala-Pro-Phe-pNA). Molecular modelling of the a-CT
glycoconjugates coupled with molecular dynamics
(MD) simulations and domain motion analysis
employing the Gaussian network model (GNM) was
additionally employed to provide structural insights
into the relation between the protein’s surface glycosy-
lation, the resulting structural dynamic changes, and
the influence of these on the enzyme’s collective
dynamics and catalytic residues.
Results and Discussion
Chemical glycosylation of a-CT
Chemical glycosylation was recently introduced by us
as a useful methodology for the sequential modulation
of protein structural dynamics without altering the
protein’s internal amino acid composition, thus allow-
ing the study of its impact on the protein fundamental
biophysical properties [36]. It was employed in this
work to study the influence of structural dynamics
on the kinetics of a-CT catalysis. Two glycans of
contrasting molecular mass [mono-(lactosylamido)-
mono-(succinimidyl) suberate (SS-mLac; 500 Da) and
mono-(dextranamido)-mono-(succinimidyl) suberate
(SS-mDex; 10 kDa)] were employed to highlight any
steric effects induced by the chemical glycosylation
that could potentially alter the substrate binding
affinities of the conjugates and thus impact their cata-
lytic behavior. The chemistry used for chemical glyco-
sylation is based on the succinimidyl functionality
(Fig. 2) which allows coupling of the glycans to the
protein surface via the lysine e-amino groups at pH 9
and above (Table 1). The resulting conjugates are het-
erogeneous mixtures of noncrosslinked single protein
species characterized by a variable distribution of gly-
cans attached to the protein’s surface. Average glycan
molar contents for these a-CT glycoconjugates were
sequentially increased to levels of around 7–8 mol of
glycan per mol of protein. This is approximately 50–
60% of the total glycan content that can theoretically
be attached to a-CT by the chemistry employed
because the protein has 14 surface accessible lysine
residues. Previous structural characterizations revealed
that protein structural integrity was not adversely
impacted during the chemical glycosylation and that
the thermodynamic stability of the conjugates was
increased with increasing glycosylation [36,37].
Changes in a-CT’s structural dynamics upon
chemical glycosylation
Determination of H ⁄ D exchange kinetics represents
one of the principal techniques for the experimental
measurement of changes in protein structural dynamics
[9,34,36,38–46]. Due to the heterogeneous nature of
the glycoconjugates we chose to determine the global
amide H ⁄ D exchange rates by FTIR spectroscopy
[7,36,44,45]. These measurements thus represent the
average dynamic nature of the enzyme. Figure 3 shows
the spectroscopic results from a typical FTIR H⁄D
exchange experiment for a-CT including both the spec-
tra of the undeuterated and completely deuterated
protein. H ⁄ D exchange kinetics were determined by
following the decrease in the absorbance of the amide
II band (N-H, 1500–1600 cm
)1
) relative to the non-
exchanging amide I band (C ¼ O, 1600–1700 cm
)1
).
From thermodynamic analysis (EX
2
exchange mechan-
ism; pH 7.1) of the H ⁄ D exchange kinetic plots
(Fig. S1), the global Gibbs free-energy of microscopic
unfolding (DG
HX,1
) for the various glycoconjugates
prepared was calculated. This parameter is representa-
tive of the global structural dynamic free-energy of the
protein (DG
Dyn
% DG
HX,1
) [13,38,47,48]. The results
(Table 2) show the reduced global structural dynamic
free-energy of a-CT as a function of the glycosylation
levels independent of the glycan size as had been previ-
ously described by us [36].
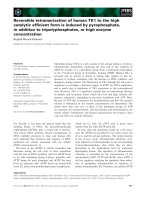
Additionally, molecular models of the Lac-a-CT
glycoconjugates (Fig. 4) were constructed based on the
lysine reactivity index presented in Table 1 (see below)
to provide a detailed picture of the possible changes in
structural dynamics upon chemical glycosylation. These
glycoconjugate structures were then subjected to
conformational energetic equilibration by molecular
dynamics (MD) simulation methods (Fig. S2). Models
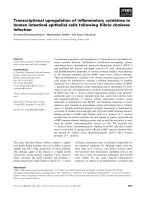
Fig. 2. Succinimidyl activated lactose mole-
cule (SS-mLac) employed for the chemical
glycosylation of a-CT and for the molecular
modelling and molecular dynamics simula-
tions. The succinimidyl functionality serves
as leaving group during the glycosylation
reaction.
R. J. Sola
´
and K. Griebenow Structural dynamics and serine protease catalysis
FEBS Journal 273 (2006) 5303–5319 ª 2006 The Authors Journal compilation ª 2006 FEBS 5305
for the dextran modified protein could not be construc-
ted due to the technical limitations involved in model-
ling linear polymeric molecules of such large size
(> 300 A
˚
). While molecular modelling and MD simula-
tions have previously been employed with great success
to provide a deeper mechanistic understanding towards
the roles of glycans on glycoprotein and glycocon-
jugates structure, stability, dynamics, and function
[13,49–55], the influence of the degree of glycosylation
on the protein biophysical properties has remained
unexplored. To obtain a general thermodynamic and
entropic picture from the MD simulations we calculated
the global energetic parameters and Debye–Waller
temperature B-factors for the protein portion of the
thermodynamically optimized a-CT glycoconjugate
structures (Table 3). Comparison with the parameters
for the full conjugates (protein-glycan) revealed that
these changes are not due to the presence of the glycans
because many of the energy parameters remained
unchanged when calculated with and without the gly-
cans (Table S1). The results from the MD simulations
show how the total energy of the protein decreases at
increasing glycosylation levels. This is in accord with
the increased thermodynamic stability exhibited by
natural glycoproteins [34,56–59] and also with data
obtained by differential scanning calorimetry for our
glycoconjugates [36,37]. Examination of the individual
energy parameters contributing to the decrease in total
energy of the glycoconjugates revealed that the bond,
angle, and Van der Waals (VDW) energy parameters
increased due to glycosylation with a decrease in the
dihedral and the coulombic electrostatic energy parame-
ters. Because the protein portion of the conjugates
remains constant for these models, the changes in bond,
angle, and dihedral energy must arise from a rearrange-
ment of their noncovalent interactions. While the
contributions of the VDW and coulombic energy
parameters to these changes are evident from the
results, other noncovalent interactions such as internal
hydrogen bonds could also contribute to the increase in
these parameters. Analysis of the changes in internal
hydrogen bond composition for the protein-glycan con-
jugates indicates that for all of the conjugates there was
also an increase in these internal hydrogen bonds
formed due to glycosylation (Table S2). However, they
are too small to sustain the observed changes in the
bond and angle parameters. These are most probably
increased due to the increased VDW interactions. The
changes in some of these parameters (e.g. reduced
dihedral and increased VDW energies) also suggest a
more rigid and compact protein structure for the glyco-
conjugates. This increase in rigidity due to glycosylation
can be also be appreciated from the decrease in the cal-
culated Debye–Waller temperature B-factors (Table 3,
[60]). This reduction in dynamics due to chemical glyco-
sylation does not appear to be caused by the modified
lysine residue charges as it has been well established that
natural glycosylation also reduces substantially the
dynamics of natural glycoproteins where the modifica-
tion occurs in noncharged residues [32–34]. However,
future experiments will be performed to investigate this.
The observed changes in the coulombic energy
parameter also highlight the large contribution that
the internal electrostatics have towards decreasing the
total energy of the conjugates, which agrees with the
hypothesis of global electrostatics being relevant to
Table 1. Reactivity order based on the calculated electrostatic pot-
entials (EP) for the N
e
of the lysine residues of a-CT at pH 9. EP,
EwaldEi. EP is the Ewald energy of placing a charge of +1 at the
location of the i
th
ionizable atom [89].
Reactivity order Lysine no. EP (kcalÆmol
)1
)
1 177 146.44
2 170 123.85
3 175 122.91
4 93 122.08
5 169 89.31
6 202 84.68
7 84 66.50
8 87 64.70
9 90 53.07
10 36 43.81
11 107 36.10
12 203 31.94
13 82 13.51
14 79 )24.94
Fig. 3. Measurement of global amide H ⁄ D exchange rates by FTIR
spectroscopy. Results from a typical H ⁄ D exchange experiment
for a-chymotrypsin (pD 7.1 at 25 °C). Arrows highlight both the
decreasing amide II band (N-H; 1550 cm
)1
) and the increasing
amide II¢ band (N-D; 1450 cm
)1
).
Structural dynamics and serine protease catalysis R. J. Sola
´
and K. Griebenow
5306 FEBS Journal 273 (2006) 5303–5319 ª 2006 The Authors Journal compilation ª 2006 FEBS
protein stability [61]. The decrease in structural
dynamics due to glycosylation could also be attributed
to the decrease in the coulombic energy parameter
because electrostatics are also known to influence
protein dynamics [62]. This decrease in the internal
electrostatic energy of the protein as a result of glyco-
sylation and its consequences on protein dynamics and
stability seems to be in agreement with the notion that
glycosylation perturbs the protein’s surrounding solva-
tion-shell [36]. This could lead to solvent dielectric
Table 2. Kinetic and thermodynamic parameters derived from amide H ⁄ D exchange rates for a-CT and for the various lactose-a-CT and
dextran-a-CT conjugates at pH 7.1, 25 °C.
Glycoconjugate A
1
b
k
HX,1
(min
)1
) A
2
b
k
HX,2
(min
)1
) A
3
b
ÆDG
HX,1
æ
c
(kcalÆmol
)1
)
Lac-a-CT
a
0.0 ± 0.0 0.56 ± 0.04 0.757 ± 0.139 0.22 ± 0.03 0.064 ± 0.016 0.22 ± 0.01 5.442
1.8 ± 0.7 0.53 ± 0.03 0.715 ± 0.109 0.19 ± 0.03 0.064 ± 0.017 0.28 ± 0.01 5.477
2.5 ± 0.4 0.51 ± 0.02 0.708 ± 0.102 0.16 ± 0.02 0.041 ± 0.010 0.33 ± 0.01 5.482
3.8 ± 0.4 0.48 ± 0.01 0.628 ± 0.049 0.11 ± 0.01 0.023 ± 0.003 0.41 ± 0.01 5.553
5.2 ± 0.3 0.46 ± 0.01 0.573 ± 0.029 0.10 ± 0.01 0.017 ± 0.002 0.44 ± 0.01 5.608
7.4 ± 0.3 0.43 ± 0.01 0.434 ± 0.019 0.08 ± 0.01 0.017 ± 0.003 0.49 ± 0.01 5.772
Dex-a-CT
a
0.0 ± 0.0 0.56 ± 0.04 0.757 ± 0.139 0.22 ± 0.03 0.064 ± 0.016 0.22 ± 0.01 5.442
1.4 ± 0.1 0.55 ± 0.01 0.741 ± 0.060 0.14 ± 0.01 0.029 ± 0.005 0.31 ± 0.01 5.455
2.5 ± 0.3 0.49 ± 0.02 0.677 ± 0.074 0.15 ± 0.02 0.058 ± 0.013 0.36 ± 0.01 5.509
4.2 ± 0.1 0.44 ± 0.03 0.650 ± 0.096 0.17 ± 0.02 0.063 ± 0.015 0.39 ± 0.01 5.533
6.7 ± 0.4 0.43 ± 0.01 0.539 ± 0.043 0.15 ± 0.01 0.023 ± 0.003 0.42 ± 0.01 5.643
7.6 ± 0.1 0.40 ± 0.02 0.394 ± 0.050 0.14 ± 0.01 0.021 ± 0.006 0.46 ± 0.01 5.830
a
Average moles of lactose and dextran per mole of a-CT.
b
A
i
are the fractions of amide protons in the i
th
population that exchange with a
rate constant k
HX,i
.
c
Gibbs free-energy of microscopic unfolding per mol of peptide hydrogen for the fast exchanging amide protons [48].
Fig. 4. Representative a-CT and Lac-a-CT glycoconjugates structures after equilibration of conformational energetics by MD simulations with
YASARA
Dynamics
. Coloring scheme: domain 1 (blue), domain 2 (red), catalytic triad (yellow), and mLac glycans (grey). Structures were ren-
dered with
PYMOL [92].
R. J. Sola
´
and K. Griebenow Structural dynamics and serine protease catalysis
FEBS Journal 273 (2006) 5303–5319 ª 2006 The Authors Journal compilation ª 2006 FEBS 5307
shielding [63] thereby transforming the protein bio-
physical properties from being solvent slaved to non-
slaved [64,65]. We have analyzed the effect that
glycosylation has on the protein-solvent hydrogen
bonds and the solvent accessible surface areas for the
protein portion of the conjugates to provide evidence
for this concept within our system. While the total
number of hydrogen bonds and solvent accessible area
increases for the conjugates with increased glycosyla-
tion levels, the actual number of protein-solvent hydro-
gen bonds and solvent accessible area decreases for the
protein portion of the conjugates (Tables S2 and S3)
providing support to this notion. While it is tradition-
ally believed that increased glycan-protein hydrogen
bonds are responsible for the changes in protein
dynamics and stability, our results clearly show that
this is not necessarily the case. These results thus high-
light an alternative fundamental mechanism by which
glycans can modulate the protein’s biophysical proper-
ties (dielectric shielding due to decreased contact of the
protein’s surface with the bulk solvent). This could
have profound implications for the design of novel
protein stabilization strategies as these effects in princi-
ple could be achieved by other types of chemical modi-
fications.
Next we performed a statistical analysis of variance
(anova) to determine if the changes in the theoretical
conformational dynamics and energetics parameters
for the modeled structures accurately reflect the chan-
ges in the experimental parameters of the glycoconju-
gates (Fig. 5). This was confirmed by the significant
statistical correlation (P<0.05) found. These results
also provide theoretical and experimental support to
the hypothesis that glycosylation leads to the thermo-
dynamic stabilization of proteins through a decrease
in their structural dynamics [7,34,36,58,66,67]. These
experimental and theoretical results thus provide evi-
dence that chemical glycosylation does indeed decrease
the global conformational dynamics of the protein.
This allowed us to then examine the effects of chemical
glycosylation on the kinetics of enzymatic catalysis
from both an experimental and theoretical perspective.
Changes in the kinetics of a-CT catalysis upon
chemical glycosylation
The catalytic behavior of a-CT after chemical glyco-
sylation was determined from the hydrolysis of
Table 3. Global energetic parameters and Debye–Waller temperature factors calculated for the protein portion of a-CT and the various lac-
tose-a-CT conjugate structures modeled and submitted MD simulations at pH 7.1, 25 °C. Energy values in McalÆmol
)1
.
Glycoconjugate
Energy
Global B-FactorBond Angle Dihedral Planar VdW Coulomb Total
a-CT 11.8 5.6 13.5 0.084 15.4 ) 136.5 ) 90.1 14.1
Lac
1
-a-CT 11.1 5.7 13.1 0.083 15.6 ) 133.3 ) 87.7 13.8
Lac
3
-a-CT 15.1 7.0 13.0 0.079 21.1 ) 168.2 ) 111.9 13.3
Lac
5
-a-CT 16.5 7.4 12.9 0.077 23.4 ) 182.5 ) 122.2 12.8
Lac
7
-a-CT 20.2 8.9 12.9 0.082 30.1 ) 224.1 ) 151.9 12.4
Lac
14
-a-CT 23.5 10.1 12.7 0.086 35.9 ) 259.4 ) 177.1 11.0
Fig. 5. Statistical correlation analysis (ANOVA) between the theoret-
ical (*) and experimental global conformational (A) dynamics and (B)
energetics parameters determined for the Lac-a-CT conjugates. T
M
values used from [36].
Structural dynamics and serine protease catalysis R. J. Sola
´
and K. Griebenow
5308 FEBS Journal 273 (2006) 5303–5319 ª 2006 The Authors Journal compilation ª 2006 FEBS
Suc-Ala-Ala-Pro-Phe-pNA (Table 4). These experi-
ments revealed that for the a-CT glycoconjugates only
the turnover rate (k
cat
) was reduced as a function of
the glycan molar content independent of the glycan’s
molecular mass; similarly to the behavior observed for
the global protein dynamics, while the substrate bind-
ing affinity (K
M
) remained unchanged. This reduction
in k
cat
with constant K
M
values upon chemical glycosy-
lation agrees with the results found previously during
the study of the catalytic behavior of natural glycopro-
teins [34,68]. Interestingly, this reduction in catalysis
was not caused due to inactivation during the chemical
glycosylation of the enzyme because it was previously
demonstrated that native-like activity and dynamics
could be restored at increased temperature regimes for
these glycoconjugates [36]. Evaluation of the glycocon-
jugates surface potential reveals that the decreased
kinetics are also not due to a perturbation of the
enzyme’s active site groove electrostatics due to lysine
charge modification (Fig. S3).
Because for the substrate used the k
cat
and K
M
parameters are a combination of the reaction’s individ-
ual rate constants (K
S
, k
2
, and k
3
) we determined these
by kinetic chemical dissection with a thio-benzyl (SBzl)
functionalized substrate as previously described by
Stein and coworkers [17]. This experiments revealed
that both the kinetics of enzyme acylation (k
2
) and
deacylation (k
3
) are reduced by chemical glycosylation,
also as a function of the glycan molar content of the
conjugates (Table 4). In contrast, the substrate binding
step (K
S
) was unaffected by the chemical glycosylation;
even for the high molecular mass dextran modified
a-CT conjugates, revealing that this type of modifica-
tion did not lead to any active-site steric effects that
could affect the catalytic steps. Here we want to point
out that while the values for the acylation and deacyla-
tion rates appear similar under the experimental condi-
tions employed in this work (25 °C, pH 7.1, Ca
+2
free), acylation does become slightly larger than deacy-
lation when the experimental conditions become
more traditional (30 °C, pH 8.0, 10 mm Ca
+2
) [17].
Although the similarity in k
2
and k
3
values for this
substrate might appear strange due to the notion that
acylation is rate limiting for amide substrates
(k
2
> k
3
) and deacylation is rate limiting for ester sub-
strate (k
2
? k
3
) this generalized assumption is not
always accurate for all substrates as previously pointed
out by Hedstrom [16]. This can be appreciated experi-
mentally in the already mentioned work by Stein [17],
where they measured the changes in k
S
, k
2
, and k
3
as a
function of pH and temperature for three different
sized amide substrates (Suc-F-pNA, Suc-AF-pNA, and
Suc-AAPF-pNA). While for the two smaller substrates
k
2
is generally smaller than k
3
, for the larger substrate
that we use in our study k
2
is equivalent to k
3
.
Correlation between the changes in a-CT’s global
structural dynamics and enzyme kinetics
Next we performed a statistical correlation analysis
(Fig. 6) between the structural dynamic (DG
HX,1
) and
catalytic (DG
„
k
2,
DG
„
k
3
) thermodynamic parameters
(Tables 2 and 5) for the glycoconjugates to determine
the dependence of the individual rate constants on the
changes in the enzyme’s structural dynamics. The
parameters for both the lactose and dextran conjugates
were combined within the analysis of variance to pro-
vide a larger and thus statistically more significant
sample group. This combination was possible because
both the dynamic and catalytic parameters derived
Table 4. Kinetic parameters for the a-CT-, lactose-a-CT-, and dextran-a-CT catalyzed hydrolysis of Suc-Ala-Ala-Pro-Phe-pNA at pH 7.1, 25 °C.
K
S
¼ K
M
[(k
2
+ k
3
) ⁄ k
3
]. k
2
¼ k
3
k
cat
⁄ (k
3
– k
cat
). k
3
is equal to k
cat
for the hydrolysis of Suc-AAPF-SBzl.
Glycoconjugate k
cat
(s
)1
) K
M
(mM) K
S
(mM) k
2
(s
)1
) k
3
(s
)1
)
Lac-a-CT
0.0 ± 0.0 9.9 ± 0.1 0.046 ± 0.001 0.096 ± 0.001 20.5 ± 0.2 19.1 ± 0.1
1.8 ± 0.7 7.9 ± 0.1 0.049 ± 0.002 0.098 ± 0.008 15.8 ± 0.9 15.7 ± 0.3
2.5 ± 0.4 7.3 ± 0.1 0.053 ± 0.001 0.108 ± 0.003 15.0 ± 0.8 14.4 ± 0.3
3.8 ± 0.4 6.7 ± 0.1 0.047 ± 0.001 0.101 ± 0.003 14.5 ± 0.4 12.5 ± 0.1
5.2 ± 0.3 6.6 ± 0.3 0.051 ± 0.005 0.109 ± 0.012 14.3 ± 0.8 12.8 ± 0.4
7.4 ± 0.3 5.4 ± 0.3 0.047 ± 0.006 0.099 ± 0.011 11.3 ± 0.5 10.2 ± 0.7
Dex-a-CT
0.0 ± 0.0 9.9 ± 0.1 0.046 ± 0.001 0.096 ± 0.001 20.5 ± 0.2 19.1 ± 0.1
1.4 ± 0.1 9.4 ± 0.1 0.052 ± 0.004 0.107 ± 0.006 19.5 ± 0.1 18.3 ± 0.5
2.5 ± 0.3 8.6 ± 0.1 0.048 ± 0.001 0.098 ± 0.003 17.7 ± 0.4 16.8 ± 0.5
4.2 ± 0.1 8.1 ± 0.2 0.046 ± 0.004 0.094 ± 0.007 16.5 ± 0.4 15.8 ± 0.4
6.7 ± 0.4 5.5 ± 0.4 0.044 ± 0.004 0.092 ± 0.007 11.5 ± 0.8 10.6 ± 0.9
7.6 ± 0.1 4.3 ± 0.1 0.046 ± 0.003 0.094 ± 0.006 8.8 ± 0.3 8.3 ± 0.1
R. J. Sola
´
and K. Griebenow Structural dynamics and serine protease catalysis
FEBS Journal 273 (2006) 5303–5319 ª 2006 The Authors Journal compilation ª 2006 FEBS 5309
were independent of the size of the glycan (Tables 2
and 5, [36]). The analysis revealed that the changes
in these parameters statistically correlate for both
the acylation and deacylation steps (DG
HX,1
⁄ DG
„
k
2
:
R ¼ 0.9245, P < 0.0001; DG
HX,1
⁄ DG
„
k
3
:R¼ 0.9370,
P < 0.0001). Interestingly, the reaction’s activation
energy for both steps increases linearly with a decrease
in the structural dynamics of the enzyme (DG
„
k
2
¼
1.06DG
HX,1
+ 9.94; DG
„
k
3
¼ 1.12DG
HX,1
+ 9.65).
This linear relation can be rationalized if one considers
that the enzyme’s dynamical free-energy can be trans-
ferred to the reaction’s activation energy by influencing
the transition-state activation energy (DG
„
¼ DG
TS
±
DG
Dyn
) [13–15,42,69,70]. Here we want to point out
that although DG
HX,1
is an experimental parameter
representative of DG
Dyn
, these two free-energy func-
tions are most probably not on the same energetic
scale, because the timescales of H ⁄ D exchange
measured in this work (k
HX,1
) are 10
3
times slower that
those observed during catalysis (k
2
and k
3
). This dis-
crepancy in timescales between the observed catalytic
rates and the rates of the H ⁄ D exchange process was
previously noted by Klinman and coworkers in their
correlation studies on a thermophilic alcohol dehy-
drogenase [71]. This was attributed to the fact that
during the employment of a composite global exchange
constant, the rates of the catalytically relevant residues
will probably be masked by the rates of slower resi-
dues and that the protein conformational fluctuations
responsible for H ⁄ D exchange are not necessarily in
the same timescales as the protein motions of catalysis.
Nevertheless, the slope values for the linear correla-
tions obtained here [which are close to unity (m % 1)]
clearly support the notion that the dynamical energy
of the enzyme is transferred directly into catalysis. The
correlations thus provide direct experimental evidence
indicating that both acylation and deacylation rates
are influenced by the changes in an enzyme’s structural
dynamics. This observed similar response for k
2
and k
3
to the changes in the enzyme’s structural dynamics
could be attributed to the fact that the enzyme
employs similar structural and chemical mechanisms
for proton transfer during the acylation and deacyla-
tion steps but just in a reverse order [16]. These results
provide support to the kinetic mechanism previously
presented by Kawai et al. [19,31] in which a substrate-
induced conformational change occurs during the for-
mation of the first tetrahedral intermediate and during
the breakdown of the second tetrahedral intermediate.
Nonetheless, an observation that becomes clearly
evident from our results is that to some degree the
Fig. 6. Statistical correlation analysis (ANOVA) between the Gibbs
free-energy of microscopic unfolding per mol of peptide hydrogen
for the fast exchanging amide protons (DG
HX,1
) and the Gibbs free-
energy of activation for reactions (A) acylation (DG
„
k
2
) and (B)
deacylation steps (DG
„
k
3
) for the Lac-a-CT (s) and Dex-a-CT (n)
conjugates.
Table 5. Thermodynamic activation parameters derived from the k
2
and k
3
steps for the hydrolysis of Suc-Ala-Ala-Pro-Phe-pNA by a-CT
and the various lactose-a-CT, and dextran-a-CT conjugates. DG
„
k
i
¼ –RTln(k
i
h ⁄ k
B
T).
Glycoconjugate DG
„
k
2
(kcalÆmol
)1
) DG
„
k
3
(kcalÆmol
)1
)
Lac-a-CT
0.0 ± 0.0 15.65 ± 0.01 15.69 ± 0.01
1.8 ± 0.7 15.81 ± 0.03 15.81 ± 0.01
2.5 ± 0.4 15.84 ± 0.03 15.86 ± 0.01
3.8 ± 0.4 15.86 ± 0.02 15.94 ± 0.01
5.2 ± 0.3 15.87 ± 0.03 15.93 ± 0.02
7.4 ± 0.3 16.00 ± 0.03 16.07 ± 0.04
Dex-a-CT
0.0 ± 0.0 15.65 ± 0.01 15.69 ± 0.01
1.4 ± 0.1 15.68 ± 0.01 15.72 ± 0.02
2.5 ± 0.3 15.74 ± 0.01 15.77 ± 0.02
4.2 ± 0.1 15.78 ± 0.02 15.81 ± 0.03
6.7 ± 0.4 16.00 ± 0.04 16.04 ± 0.05
7.6 ± 0.1 16.15 ± 0.02 16.19 ± 0.01
Structural dynamics and serine protease catalysis R. J. Sola
´
and K. Griebenow
5310 FEBS Journal 273 (2006) 5303–5319 ª 2006 The Authors Journal compilation ª 2006 FEBS
catalytically relevant dynamics of a-CT appear to be
an intrinsic structural feature of the protein. This
notion is indirectly supported by more detailed NMR
N
15
-relaxation experiments in another enzyme system
(cyclophilin A; prolyl cis-trans isomerase) with the
Suc-AAPF-pNA substrate employed in this work [11],
as this enzyme has similar substrate binding specificity
as a-CT. From these experiments it was deduced that
the presence of this type of substrate in the enzyme’s
active site during catalysis does not lead to new cata-
lytically relevant motions that were not already present
within the enzyme. Because we previously showed that
for a-CT these catalytically relevant motions are
thermally activated [36] we suggest a minor correction
to the mechanism proposed by Kawai et al. in which
the substrate triggered induced-fit conformational pro-
cess is modified by the enzyme’s intrinsic thermally
activated structural mobility (Fig. 7). While the results
presented here experimentally highlight the importance
of structural dynamics to rate acceleration by the
enzyme this is clearly not the only contributor to cata-
lysis as it is well known that other phenomena, such as
electrostatic stabilization of the transition state, forma-
tion of covalent intermediates, steric strain, near attack
conformations, substrate desolvation, low barrier
hydrogen bonds, and entropic effects are present in the
mechanism of serine protease catalysis [16,72]. Interest-
ingly, the observed relation between the changes in the
enzyme’s internal electrostatics and its structural
dynamics suggests that some of these phenomena may
be interconnected within the catalytic mechanism of
the enzyme.
Structural insights into the mechanochemical
nature of a-CT catalysis
A more detailed analysis of the influence of chemical
glycosylation on the dynamics of a-CT from the theor-
etical simulations was additionally performed to gain a
deeper perspective into the mechanism of coupling
between the structural dynamic and functional proper-
ties of the enzyme. Although decreases in the dynamics
of catalytically important regions (e.g. catalytic triad,
S1 binding site, and L1 specificity site) can certainly be
observed from the analysis of the MD trajectories
(Fig. S4 and Table S4), these changes are not necessar-
ily relevant to the changes in catalysis as the timescales
that are accessible to MD simulation techniques are
computationally limited so that catalytically important
phenomena which occur on larger time scales (e.g. col-
lective domain motions) are not accurately sampled.
The Gaussian network model (GNM) was developed
to provide a simple and computationally inexpensive
yet accurate description of residue mobilities within
the collective vibrational modes of proteins and supra-
molecular structures [73,74]. Results from this type of
calculation have been found to be in excellent agree-
ment with X-ray crystallographic B-factors, H ⁄ D
exchange free energies of amide protons, and NMR-
relaxation order parameters [75,76]. Due to this GNM
has been extensively used to describe the influence of
collective structural motions on the functional proper-
ties of proteins. Because these calculations are tradi-
tionally performed on crystal structures their only
drawback is that they do not take into consideration
environmental variables relevant to protein dynamics
(i.e. pH, pressure, temperature, and ions) [77]. We
overcame this problem in our analysis because we per-
formed our GNM calculations with structures for
which the protein-solvent system was previously equili-
brated with these variables during the MD simulations.
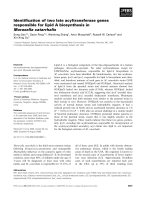
Figure 8 displays the average relative residue mobilities
([(DR
i
)
2
]
1)2
) for the two slowest collective vibrational
modes of a-CT and the interresidue mobility cross-
correlations within the structure. These two slowest
modes correspond to the most collective ones which
have been found to be the most significant to enzyme
function [78,79]. The relative mobility plot (Fig. 8A)
displays that a-CT’s structure is composed of two rigid
domains [domain 1 (residues 1–119) and domain 2
(residues 151–245)] linked by an interdomain hinge
(residues 120–150). Interestingly, the connection
between the two domains and the hinge appears to be
via two highly mobile loops (85–105, 160–175) located
at the structural edges of the two domains. Positive
cross-correlations within the two domains (Fig. 8B)
reveal how the motions of the residues comprising
both domains are correlated and thus move in the
Fig. 7. Catalytic steps influenced by the
enzyme’s intrinsic structural dynamics.
R. J. Sola
´
and K. Griebenow Structural dynamics and serine protease catalysis
FEBS Journal 273 (2006) 5303–5319 ª 2006 The Authors Journal compilation ª 2006 FEBS 5311
same direction (squared patterns in the upper left and
in the lower right areas of plot) within the collective
vibrational modes. Additionally, significant cross-
correlations are observed between catalytically relevant
residues (Cys42–Ser195, His57–Asp102, His57–Ser195,
Gly140–Ser195, Cys182–Ser214) present in similar and
in separate domains. The motion of these collective
vibrational modes can be better appreciated from a
movie generated with the normal mode analysis morph
server at Yale University ()
(Video S1) [80].
When the GNM analysis was applied to the a-CT
glycoconjugates (Fig. 9), the relative mobilities of both
interdomain connecting loops (85–105, 160–175) were
largely reduced with an increase in the relative mobility
of the interdomain hinge residues (120–150) and the
C-terminal a-helix (230–245) (Fig. 10). While most of
the glycosylation sites occur in these interdomain con-
necting loop regions (Fig. 9) we can also see a reduc-
tion in the dynamics of regions far away from the
glycosylation sites. This is most probably due to the
very well known fact that the network of hydrogen
bonds within the protein’s interior can relay informa-
tion to other distant regions of the protein. Also the
large increase in the mobility of some regions can be
expected to occur due to a redistribution of the pro-
tein’s configurational dynamics as to minimize the
potential entropy loss due to glycosylation [81].
20
A
B
0.5
0.4
0.3
0.2
0.1
0
–0.1
–0.2
40
60
80
100
120
Residue j
Residue i
140
160
180
200
220
50 100 150 200
Fig. 8. Relative mobility ([(DR
i
)
2
]
1)2
) in the
slowest two collective vibrational modes
versus residue index (A) and interresidue
cross-correlation map (B) for a-CT calculated
by GNM. Coloring scheme on scale: positive
correlations (red), negative correlations
(blue).
Structural dynamics and serine protease catalysis R. J. Sola
´
and K. Griebenow
5312 FEBS Journal 273 (2006) 5303–5319 ª 2006 The Authors Journal compilation ª 2006 FEBS
Because the cross-correlation maps for the glycosylated
conjugates were not significantly different from those
of the nonglycosylated protein (results not shown), this
result implies that glycosylation can reduce the kinetics
of the protein’s collective domain motions without
altering the shape of the collective vibrational mode,
the protein structure, or even the interresidue connec-
tions. More specifically the decrease in mobility of the
Asp102 loop (85–105) seems to be largely dependent
on the degree of glycosylation. Interestingly, the mobil-
ity of the His57 loop (55–65) and the calcium binding
loop (70–80) which are adjacent to the Asp102 loop
were also reduced (but to a lesser extent) as a function
of the glycosylation degree. The decrease in mobility
of the His57 and Asp102 loops could explain the
decreased acylation and deacylation rates observed for
the glycosylated a-CT conjugates as these residues are
directly involved in the hydrogen transfer steps of cata-
lysis. A decrease in the dynamics of these two loops
could reinforce the H-bond strength between the His57
and Asp102 residues leading to a possible anticatalytic
situation [29] which could indirectly affect the deproto-
nation and protonation rates of Ser195 thus reducing
the kinetics of catalysis. The results also suggest that
the dynamics of the calcium binding site in this struc-
tural class of proteins (chymotrypsin-fold proteases) is
directly interlinked with the dynamics of the regions
containing the His57 and Asp102 catalytic residues.
While the importance of this calcium binding site has
been primarily assigned as a contributor to increased
protease stability less emphasis has been put on the
increased rates of catalysis observed upon calcium
binding which might be linked to its allosteric regula-
tion in vivo [82]. Because the biophysical mechanism of
allosteric activation by calcium for chymotrypsin-fold
proteases has not yet been resolved we hypothesize
(based on the theoretical results presented herein and
on preliminary unpublished experimental results) that
the calcium induced activation is due to an increase in
the structural dynamics of these catalytically relevant
regions upon calcium binding. The results from GNM
analysis together with those from MD simulations thus
provide support to the proposal of mechanochemical
coupling between the enzyme’s conformational dynam-
ics and active-site chemistry through domain motions
[17,18,21,78].
Conclusions
In this article, we further demonstrate the value of
chemical glycosylation as a tool for studying the effects
of modulated structural dynamics on the protein bio-
physical properties. We have also been able to provide
some novel insights concerning the mechanism by
which glycans modulate the fundamental biophysical
protein properties. By applying this methodology to
the study of the kinetics of catalysis by the serine pro-
tease a-CT we were able to statistically correlate the
structurally dynamic behavior of the enzyme with its
kinetics of catalysis. From a mechanistic perspective
we have provided evidence that supports a catalytic
mechanism for a-CT in which both the enzyme acyla-
tion (k
2
) and deacylation (k
3
) steps are influenced by
the enzyme’s intrinsic thermally activated structural
dynamics. Additionally, through the use molecular
Fig. 9. Changes in relative mobility (D[(DR
i
)
2
]
1)2
) in the slowest two
collective vibrational modes versus residue index for the various
Lac-a-CT glycoconjugates structures with respect to a-CT. Circles
denote glycosylation sites.
Fig. 10. Structural regions in a-CT subject to changes in mobility
due to chemical glycosylation. Coloring scheme: decreased mobility
(blue), increased mobility (red), nonaltered mobility (yellow). Struc-
ture rendered with
PYMOL [92].
R. J. Sola
´
and K. Griebenow Structural dynamics and serine protease catalysis
FEBS Journal 273 (2006) 5303–5319 ª 2006 The Authors Journal compilation ª 2006 FEBS 5313
modelling and structural dynamics simulation tech-
niques (MD and GNM) we have provided structurally
dynamic insights supporting the proposal of mechano-
chemical coupling in a-CT catalysis.
Experimental procedures
Chemical glycosylation of a-CT
Mono-(dextranamido)-mono-(succinimidyl) suberate (SS-
mDex; 10 kDa) was synthesized by monofunctional
succinnylation as described previously [37]. a-CT glycocon-
jugates were prepared by chemical protein glycosylation
with SS-mLac and SS-mDex (10 kDa) as described previ-
ously [36]. Glycosylation levels (average glycan molar
content) and protein integrity were determined from
trinitrobenzene sulfonic acid assay, capillary zone electro-
phoresis, and circular dichroism spectroscopy as described
previously [36,37].
FTIR H
⁄
D exchange measurements
Amide H ⁄ D exchange FTIR spectra were recorded on a
Nicolet NEXUS 470 infrared spectrophotometer equipped
with a thermally controlled sample cell (Spectra-Tech Inc.,
Shelton, CT) using CaF
2
windows and 25 lm Teflon spac-
ers (Buck Scientific, East Norwalk, CT). Kinetic experi-
ments were designed and performed similarly to those
reported previously [7,36,42–46,69].
Processing of H ⁄ D exchange data
H ⁄ D exchange spectra were processed for quantitative ana-
lysis in the form of hydrogen exchange (HX) decay plots (X
versus time) [36,42,44,45]. In these plots the fraction of un-
exchanged peptide hydrogen atoms (X) was determined as:
X ¼
wðtÞÀwð1Þ
wð0ÞÀwð1Þ
where w(t) is the ratio of the amide II (1550 cm
)1
) and
amide I (1637.5 cm
)1
) absorbencies corrected with the base-
line absorbance (1789 cm
)1
) at time t, w(0) is the amide
II ⁄ amide I ratio of the undeuterated proteins and w [8] is
the amide II ⁄ amide I ratio for the fully deuterated proteins.
WðtÞ¼
A
amideII
ðtÞÀA
base
ðtÞ
A
amideI
ðtÞÀA
base
ðtÞ
w(0) was obtained from IR spectra for the undeuterated
proteins measured as KBr pellets. The value of w(¥) was
determined from samples incubated for 15 days in D
2
Oat
65 °C. These samples were prepared at pH 5 were a-CT’s
activity is negligible and the protein unfolding reversible
[36]. Kinetic quantitative analysis of the HX decay data
was done by a two-exponential model:
X ¼ A
1
exp
ðÀk
HX;1
Þt
þ A
2
exp
ðÀk
HX;2
Þt
þ A
3
where A
1
, A
2
, and A
3
are the fractions of the fast, slow and
stable amide protons and k
HX,1
and k
HX,2
are the apparent
exchange rate constants for the fast and slow amide pro-
tons. Results were interpreted thermodynamically under the
EX
2
exchange mechanism (pH 7.1) [41,43] where the Gibbs
free-energy of microscopic unfolding per mol of peptide
hydrogens for the fast exchanging amide protons is based
on the chemical exchange rate constant (k
0
) and the meas-
ured rate constant (k
HX,1
) [42,44,45]:
DG
HX;1
¼ÀRTlnðk
HX;1
=k
0
Þ:
Enzyme activity and kinetic measurements
Initial velocities were measured by spectroscopically follow-
ing the product formation of p-nitroanilide at 410 nm
(e
410
¼ 8.8 mm
)1
Æcm
)1
) on a Shimadzu (Columbia, MD,
USA) UV 160U spectrophotometer with a 0.1 cm path
length cuvette. Reactions were carried out in 10 mm KP
i
(pH 7.1) employing Suc-Ala-Ala-Pro-Phe-pNA as substrate
[17]. Calcium was excluded from the experiments to simplify
the analysis of the results because preliminary experiments
revealed that the binding of calcium to the protein surface
was perturbed by the chemical glycosylation [36]. The reac-
tion was started by addition of 60 lL of enzyme ([E]
o
¼
0.8 lm) to a 240 lL substrate solution ([S]
o
¼ 0.4 mm)ina
final volume of 1 mL. For determination of steady state
kinetic parameters, initial velocities were determined for
seven initial substrate concentrations in the range between
0.01 and 0.5 mm k
cat
and K
M
parameters were determined
from Eadie–Hofstee plot analysis. Determination of the indi-
vidual rate constants (K
S
, k
2
, and k
3
) was performed by
chemical kinetic dissection experiments employing as sub-
strate Suc-Ala-Ala-Pro-Phe-SBzl as described previously by
Stein and coworkers [17]. For these reactions the thiol
product derived from thioester hydrolysis was detected by
a coupled assay with 5,5¢-dithiobis(2-nitrobenzic acid)
(DTNB) (100 lL; [DTNB]
o
¼ 2mm) at 412 nm (e
412
¼
13 mm
)1
Æcm
)1
) [17]. The rest of the kinetic method was the
same as that used for the p-nitroanilide (pNA) substrate.
Glycoconjugate modelling and molecular
dynamics simulations
For all molecular modelling and molecular dynamics (MD)
simulation experiments the yasara suite of programs
(YASARA Biosciences, Neue-Welt-Hoehe, Graz, Austria)
was used [83]. The starting a-CT coordinates originated
from the 1.68 A
˚
atomic resolution crystal structure of
bovine a-CT [84]. These were acquired from the protein
data bank [85]; accession code 4CHA. All of the crystalliza-
tion waters and one of the crystallization dimers (B) were
removed. Hydrogen atoms were added and fractional bond
Structural dynamics and serine protease catalysis R. J. Sola
´
and K. Griebenow
5314 FEBS Journal 273 (2006) 5303–5319 ª 2006 The Authors Journal compilation ª 2006 FEBS
orders adjusted to the corresponding pH of the system
(pH 7.1). This ensemble was subjected to yasara’s energy
minimization protocol (steepest descent, simulated anneal-
ing minimizations) and yasara’s MD protocol (see param-
eters below) using the AMBER99 force field [86]. To
generate the various Lac-a-CT conjugates, the SS-mLac
molecule (Fig. 1) was modeled and parametrized quantum
mechanically (QM) with yasara’s AutoSMILES protocol
[83]. This methodology allows semiempirical quantum
chemical geometry optimization of newly modeled struc-
tures and generation of their general AMBER force field
using the AM1-BCC QM method [87] and COSMO solva-
tion model [88]. Lysine reactivity order (nucleophilicity) for
the in silico creation of the various glycoconjugates was
determined by calculating the electrostatic potentials (EP)
for the N
e
of the lysine residues of a-CT at pH 9 were the
chemical glycosylation reaction takes places using yasara’s
cell neutralization and pKa prediction module (Table 1)
[89]. The parametrized SS-mLac molecule was then coupled
in silico to the various lysine residues of the MD optimized
protein structure using this reactivity order, yielding the
glycoconjugates: Lac1-a-CT, Lac3-a-CT, Lac5-a-CT, Lac7-
a-CT, Lac14-a-CT. The novel amide bonds of the resulting
glycoconjugates were also QM parametrized with yasara’s
AutoSMILES protocol.
The protein models were subjected to yasara’s MD pro-
tocol using the AMBER99 force field with the GLYCAM
force field parameters for carbohydrates [54,86]. Simulation
temperature was 25 ° C, density 0.997, and pH 7.1. Van der
Waals pairs cutoff distance was 7.86 A
˚
and particle mesh
Ewald (PME) long range electrostatics were employed [90].
Multiple timesteps of 1.5 fs for intramolecular and 3 fs for
intermolecular forces and periodic cell boundaries with a
simulation cell 20 A
˚
larger than the protein along each axis
were used. Filling of the simulation cell with water, predic-
tion of charged residues pKa’s, placement of counter ions,
and cell neutralization were done automatically by yasara’s
MD protocol [83]. Simulations were started by a short
steepest descent minimization (atom speed < 2200 mÆs
)1
)
followed by 500 steps of simulated annealing (equilibration
phase) and finally a 660 ps MD production run. Simulation
snapshots were saved every 2500 steps (7.5 ps) yielding 88
snapshots for trajectory analysis for which rmsd’s were cal-
culated for the heavy atoms. Global energetic parameters
[86], Debye–Waller temperature B-factors [60], surface elec-
trostatics, hydrogen bonds, and solvent accessible surface
areas were calculated with YASARA’s analysis module.
Gaussian network model analysis
GNM analysis represents a simplified version of normal
mode analysis for describing the fluctuations in dynamics
of polymer networks. It has been used extensively to des-
cribe functionally relevant domain motions in proteins
[76,91]. Calculations were performed for the energetically
and conformationally optimized protein structures submit-
ted to 660 ps of solvated MD simulations by uploading the
generated PDB files to the iGNM online web-server calcu-
lation engine () [73]. Here, the
modeled glycoprotein structures were treated as three-
dimensional elastic networks where the amino acid a-car-
bons are defined as nodes interconnected by Hookean
springs with a uniform spring constant [c ¼ 1 kcal ⁄ (mol
A
˚
2
)] within a cutoff distance (r
c
¼ 6.0 A
˚
). The dynamics of
the resulting network are then defined by the Ni · Nj Kir-
chhoff connectivity matrix of interresidue contacts (G)
where the off diagonal elements of G are defined as: G
ij
¼
)1 if the distance between residues i and j (R
ij
) is shorter
than r
c
, meaning that they interact and G
ij
¼ 0ifR
ij
is lar-
ger than r
c
and the residues do not interact. The statistical
thermodynamics of the network are then described by its
potential V ¼ (c ⁄ 2)(DR)G(DR)
T
; where DR is a vector, with
DR
i
representing the displacement of the i
th
residue from its
equilibrium position. Cross-correlations between the fluctu-
ations (DR
i
and DR
j
) of residues i and j are then scaled
with the ij
th
off-diagonal elements of G
)1
:
hDR
i
Á DR
j
i¼ð3K
B
Tc
À1
Þ½C
À1
ij
where k
B
is the Boltzmann constant and T is the absolute
temperature. Correlations in GNM are normalized [)1 to 1]:
C
ij
¼hDR
i
Á DR
j
i=½hDR
2
i
iÁhDR
2
j
i
1=2
¼½C
À1
ij
=ð½C
À1
ii
½C
À1
ij
Þ
1=2
so that positive values describe residue movement in the
same direction while negative values describe movement in
opposite directions. From this analysis the dynamics of the
protein are described by a set of N
)1
normal modes, the k
th
eigenvector (u
k
)ofG gives the residue displacements along
mode k, and the k
th
eigenvalue, k
k
, scales with its fre-
quency. So that the contribution of mode k to the residue
mobility is described by the mean-squared fluctuations of
residue i which is scaled with the i
th
diagonal element of
[u
k
]
ii
:
½ðDR
i
Þ
2
k
¼ð3k
B
Tc
À1
Þk
k
½u
k
ii
Statistical analysis
All statistical analyses were performed by one-way analysis
of variance (anova) with a P-value of < 0.05 considered
significant using sigmaplot 8.0 (SPSS UKD Ltd, Woking,
UK) statistical analysis module.
Acknowledgements
We thank Dr Elmar Krieger at YASARA Biosciences
for the helpful discussions on the modelling studies.
This work was supported by Grant P20 RR16439 from
the National Institutes of Health (NIH-COBRE II) to
KG. RJS was supported by fellowships from the
R. J. Sola
´
and K. Griebenow Structural dynamics and serine protease catalysis
FEBS Journal 273 (2006) 5303–5319 ª 2006 The Authors Journal compilation ª 2006 FEBS 5315
Alfred P. Sloan Foundation and University of Puerto
Rico Deanship of Graduate Studies and Research
(UPR-DEGI).
References
1 Bruice TC & Benkovic SJ (2000) Chemical basis for
enzyme catalysis. Biochemistry 39, 6267–6274.
2 Somogyi B, Welch GR & Damjanovich S (1984) The
dynamic basis of energy transduction in enzymes.
Biochim Biophys Acta 768, 81–112.
3 Frauenfelder H & McMahon B (1998) Dynamics and
function of proteins: the search for general concepts.
Proc Natl Acad Sci USA 95, 4795–4797.
4 Blow D (2000) So do we understand how enzymes
work? Structure 8, R77–R81.
5 Careri G, Fasella P & Gratton E (1979) Enzyme
dynamics: the statistical physics approach. Annu Rev
Biophys Bioeng 8, 69–97.
6 Peticolas WL (1979) Low frequency vibrations and the
dynamics of proteins and polypeptides. Methods Enzy-
mol 61, 425–458.
7 Zavodszky P, Kardos J, Svingor & Petsko GA (1998)
Adjustment of conformational flexibility is a key event
in the thermal adaptation of proteins. Proc Natl Acad
Sci USA 95, 7406–7411.
8 Kohen A, Cannio R, Bartolucci S & Klinman JP (1999)
Enzyme dynamics and hydrogen tunnelling in a thermo-
philic alcohol dehydrogenase. Nature 399, 496–499.
9 Kohen A & Klinman JP (2000) Protein flexibility corre-
lates with the degree of hydrogen tunnelling in thermo-
philic and mesophilic alcohol dehydrogenases. J Amer
Chem Soc 122, 10738–10739.
10 Agarwal PK, Billeter SR, Rajagopalan PT, Benkovic SJ
& Hammes-Schiffer S (2002) Network of coupled pro-
moting motions in enzyme catalysis. Proc Natl Acad Sci
USA 99, 2794–2799.
11 Eisenmesser EZ, Millet O, Labeikovsky W, Korzhnev
DM, Wolf-Watz M, Bosco DA, Skalicky JJ, Kay LE &
Kern D (2005) Intrinsic dynamics of an enzyme under-
lies catalysis. Nature 438, 117–121.
12 Benkovic SJ & Hammes-Schiffer S (2003) A perspective
on enzyme catalysis. Science 301, 1196–1202.
13 Garcia-Viloca M, Gao J, Karplus M & Truhlar DG
(2004) How enzymes work: Analysis by modern rate
theory and computer simulations. Science 303, 186–195.
14 Hammes-Schiffer S (2002) Impact of enzyme motion on
activity. Biochemistry 41, 13335–13343.
15 Antoniou D, Caratzoulas S, Kalyanaraman C, Mincer
JS & Schwartz SD (2002) Barrier passage and protein
dynamics in enzymatically catalyzed reactions. Eur J
Biochem 269, 3103–3112.
16 Hedstrom L (2002) Serine protease mechanism and
specificity. Chem Rev 102, 4501–4524.
17 Case A & Stein RL (2003) Mechanistic origins of the
substrate selectivity of serine proteases. Biochemistry 42,
3335–3348.
18 Hengge AC & Stein RL (2004) Role of protein confor-
mational mobility in enzyme catalysis: acylation of
alpha-chymotrypsin by specific peptide substrates.
Biochemistry 43, 742–747.
19 Kawai Y, Matsuo T & Ohno A (2000) Kinetic study
on conformational effect in hydrolysis of
p-nitroanilides
catalyzed by a-chymotrypsin. J Chem Soc Perkin Trans
2, 887–891.
20 Gerstein M, Lesk AM & Chothia C (1994) Structural
mechanisms for domain movements in proteins.
Biochemistry 33, 6739–6749.
21 Dufton MJ (1990) Could domain movements be involved
in the mechanism of trypsin-like serine proteases? FEBS
Lett 271, 9–13.
22 Chen SC & Bahar I (2004) Mining frequent patterns in
protein structures: a study of protease families. Bioinfor-
matics 20 (Suppl. 1), I77–I85.
23 Ma W, Tang C & Lai L (2005) Specificity of trypsin
and chymotrypsin: loop-motion-controlled dynamic cor-
relation as a determinant. Biophys J 89, 1183–1193.
24 Ishida T & Kato S (2003) Theoretical perspectives on
the reaction mechanism of serine proteases: the reaction
free energy profiles of the acylation process. J Am Chem
Soc 125, 12035–12048.
25 Ishida T & Kato S (2004) Role of Asp102 in the cataly-
tic relay system of serine proteases: a theoretical study.
J Am Chem Soc 126, 7111–7118.
26 Topf M & Richards WG (2004) Theoretical studies on
the deacylation step of serine protease catalysis in the
gas phase, in solution, and in elastase. J Am Chem Soc
126, 14631–14641.
27 Topf M, Varnai P & Richards WG (2002) Ab initio
QM ⁄ MM dynamics simulation of the tetrahedral inter-
mediate of serine proteases: insights into the active site
hydrogen-bonding network. J Am Chem Soc 124,
14780–14788.
28 Topf M, Varnai P, Schofield CJ & Richards WG (2002)
Molecular dynamics simulations of the acyl-enzyme and
the tetrahedral intermediate in the deacylation step of
serine proteases. Proteins 47, 357–369.
29 Ishida T (2006) Low Barrier Hydrogen Bond Hypothe-
sis in the Catalytic Triad Residue of Serine Proteases:
Correlation between Structural Rearrangement and
Chemical Shifts in the Acylation Process. Biochemistry
45, 5413–5420.
30 Cassidy CS, Lin J & Frey PA (1997) A new concept for
the mechanism of action of chymotrypsin: the role of the
low barrier hydrogen bond. Biochemistry 36, 4576–4584.
31 Kawai Y, Matsuo T & Ohno A (1998) Conformational
effect (induced-fit) on catalytic activity of alpha-chymo-
trypsin. Bull Chem Soc Jpn 71, 2187–2196.
Structural dynamics and serine protease catalysis R. J. Sola
´
and K. Griebenow
5316 FEBS Journal 273 (2006) 5303–5319 ª 2006 The Authors Journal compilation ª 2006 FEBS
32 Joao HC, Scragg IG & Dwek RA (1992) Effects of gly-
cosylation on protein conformation and amide proton
exchange rates in RNase B. FEBS Lett 307, 343–346.
33 Joao HC & Dwek RA (1993) Effects of glycosylation
on protein structure and dynamics in ribonuclease B
and some of its individual glycoforms. Eur J Biochem
218, 239–244.
34 Rudd PM, Joao HC, Coghill E, Fiten P, Saunders MR,
Opdenakker G & Dwek RA (1994) Glycoforms modify
the dynamic stability and functional activity of an
enzyme. Biochemistry 33, 17–22.
35 Kohen A, Jonsson T & Klinman JP (1997) Effects of
protein glycosylation on catalysis: changes in hydrogen
tunneling and enthalpy of activation in the glucose
oxidase reaction. Biochemistry 36, 2603–2611.
36 Sola
´
RJ & Griebenow K (2006) Chemical glycosylation:
New insights on the interrelation between protein struc-
tural mobility, thermodynamic stability, and catalysis.
FEBS Lett 580, 1685–1690.
37 Sola
´
RJ, Al-Azzam W & Griebenow K (2006) Engineer-
ing of protein thermodynamic, kinetic, and colloidal
stability: Chemical glycosylation with monofunctionally
activated glycans. Biotechnol Bioeng 94, 1072–1079.
38 Bai Y, Englander JJ, Mayne L, Milne JS & Englander
SW (1995) Thermodynamic parameters from hydrogen
exchange measurements. Methods Enzymol 259, 344–
356.
39 Busenlehner LS & Armstrong RN (2005) Insights into
enzyme structure and dynamics elucidated by amide
H ⁄ D exchange mass spectrometry. Arch Biochem Bio-
phys 433, 34–46.
40 Eriksson MA, Hard T & Nilsson L (1995) On the pH
dependence of amide proton exchange rates in proteins.
Biophys J 69, 329–339.
41 Ferraro DM, Lazo ND & Robertson AD (2004) EX1
hydrogen exchange and protein folding. Biochemistry
43, 587–594.
42 Gekko K, Obu N, Li J & Lee JC (2004) A linear corre-
lation between the energetics of allosteric communica-
tion and protein flexibility in the Escherichia coli cyclic
AMP receptor protein revealed by mutation-induced
changes in compressibility and amide hydrogen-deuter-
ium exchange. Biochemistry 43, 3844–3852.
43 Hvidt A & Nielsen SO (1966) Hydrogen exchange in
proteins. Adv Protein Chem 21, 287–386.
44 Li J, Cheng X & Lee JC (2002) Structure and dynamics
of the modular halves of Escherichia coli cyclic AMP
receptor protein. Biochemistry 41, 14771–14778.
45 Tatulian SA, Cortes DM & Perozo E (1998) Structural
dynamics of the Streptomyces lividans K
+
channel
(SKC1): secondary structure characterization from
FTIR spectroscopy. FEBS Lett 423, 205–212.
46 Zavodszky P, Johansen JT & Hvidt A (1975) Hydro-
gen-exchange study of the conformational stability of
human carbonic-anhydrase B and its metallocomplexes.
Eur J Biochem 56, 67–72.
47 Pace CN (1990) Conformational stability of globular
proteins. Trends Biochem Sci 15, 14–17.
48 Privalov PL & Tsalkova TN (1979) Micro- and macro-
stabilities of globular proteins. Nature 280, 693–696.
49 Bohne A & von der Lieth CW (2002) Glycosylation of
proteins: a computer based method for the rapid
exploration of conformational space of N-glycans.
Pac Symp Biocomput 285–296.
50 Bosques CJ, Tschampel SM, Woods RJ & Imperiali B
(2004) Effects of glycosylation on peptide conformation:
a synergistic experimental and computational study.
J Am Chem Soc 126, 8421–8425.
51 Karplus M & Kuriyan J (2005) Molecular dynamics
and protein function. Proc Natl Acad Sci USA 102,
6679–6685.
52 Mandal TK & Mukhopadhyay C (2001) Effect of glyco-
sylation on structure and dynamics of MHC class I gly-
coprotein: a molecular dynamics study. Biopolymers 59,
11–23.
53 Mukhopadhyay C (1998) Molecular dynamics simula-
tion of glycoprotein-glycans of immunoglobulin G and
immunoglobulin M. Biopolymers 45, 177–190.
54 Woods RJ, Dwek RA, Edge CJ & Fraserreid B (1995)
Molecular Mechanical and Molecular Dynamical Simu-
lations of Glycoproteins and Oligosaccharides.1.
Glycam-93 Parameter Development. J Phys Chem 99,
3832–3846.
55 Zuegg J & Gready JE (2000) Molecular dynamics simu-
lation of human prion protein including both N-linked
oligosaccharides and the GPI anchor. Glycobiology 10,
959–974.
56 Broersen K, Voragen AG, Hamer RJ & De Jongh HH
(2004) Glycoforms of beta-lactoglobulin with improved
thermostability and preserved structural packing.
Biotechnol Bioeng 86, 78–87.
57 Wang C, Eufemi M, Turano C & Giartosio A (1996)
Influence of the carbohydrate moiety on the stability of
glycoproteins. Biochemistry 35, 7299–7307.
58 Wormald MR & Dwek RA (1999) Glycoproteins: gly-
can presentation and protein-fold stability. Structure 7,
R155–R160.
59 Mer G, Hietter H & Lefevre JF (1996) Stabilization of
proteins by glycosylation examined by NMR analysis of
a fucosylated proteinase inhibitor. Nat Struct Biol 3,
45–53.
60 Kundu S, Melton JS, Sorensen DC & Phillips GN Jr
(2002) Dynamics of proteins in crystals: comparison of
experiment with simple models. Biophys J 83, 723–732.
61 Strickler SS, Gribenko AV, Gribenko AV, Keiffer TR,
Tomlinson J, Reihle T, Loladze VV & Makhatadze GI
(2006) Protein stability and surface electrostatics: a
charged relationship. Biochemistry 45, 2761–2766.
R. J. Sola
´
and K. Griebenow Structural dynamics and serine protease catalysis
FEBS Journal 273 (2006) 5303–5319 ª 2006 The Authors Journal compilation ª 2006 FEBS 5317
62 Simonson T (2003) Electrostatics and dynamics of pro-
teins. Reports on Progress in Physics 66, 737–787.
63 Affleck R, Haynes CA & Clark DS (1992) Solvent
dielectric effects on protein dynamics. Proc Natl Acad
Sci USA 89, 5167–5170.
64 Fenimore PW, Frauenfelder H, McMahon BH & Parak
FG (2002) Slaving: solvent fluctuations dominate pro-
tein dynamics and functions. Proc Natl Acad Sci USA
99, 16047–16051.
65 Fenimore PW, Frauenfelder H, McMahon BH &
Young RD (2004) Bulk-solvent and hydration-shell fluc-
tuations, similar to alpha- and beta-fluctuations in
glasses, control protein motions and functions. Proc
Natl Acad Sci USA 101, 14408–14413.
66 Haouz A, Glandieres JM & Alpert B (2001) Involve-
ment of protein dynamics in enzyme stability. The case
of glucose oxidase. FEBS Lett 506, 216–220.
67 Tsai AM, Udovic TJ & Neumann DA (2001) The
inverse relationship between protein dynamics and ther-
mal stability. Biophys J 81, 2339–2343.
68 Rudd PM, Woods RJ, Wormald MR, Opdenakker G,
Downing AK, Campbell ID & Dwek RA (1995) The
effects of variable glycosylation on the functional activ-
ities of ribonuclease, plasminogen and tissue plasmino-
gen activator. Biochim Biophys Acta 1248, 1–10.
69 Kohen A & Klinman JP (2000) Protein flexibility corre-
lates with degree of hydrogen tunneling in thermophilic
and mesophilic alcohol dehydrogenases. J Am Chem
Soc 122, 10738–10739.
70 Kurzynski M (1997) Protein machine model of enzymat-
ic reactions gated by enzyme internal dynamics. Biophys
Chem 65, 1–28.
71 Liang ZX, Lee T, Resing KA, Ahn NG & Klinman JP
(2004) Thermal-activated protein mobility and its corre-
lation with catalysis in thermophilic alcohol dehydro-
genase. Proc Natl Acad Sci USA 101, 9556–9561.
72 Olsson MH, Parson WW & Warshel A (2006) Dynami-
cal contributions to enzyme catalysis: critical tests of a
popular hypothesis. Chem Rev 106, 1737–1756.
73 Yang LW, Liu X, Jursa CJ, Holliman M, Rader AJ,
Karimi HA & Bahar I (2005) iGNM: a database of
protein functional motions based on Gaussian Network
Model. Bioinformatics 21, 2978–2987.
74 Bahar I, Erman B, Haliloglu T & Jernigan RL (1997)
Efficient characterization of collective motions and
interresidue correlations in proteins by low-resolution
simulations. Biochemistry 36, 13512–13523.
75 Haliloglu T & Bahar I (1999) Structure-based analysis
of protein dynamics: comparison of theoretical results
for hen lysozyme with X-ray diffraction and NMR
relaxation data. Proteins 37, 654–667.
76 Bahar I, Wallqvist A, Covell DG & Jernigan RL (1998)
Correlation between native-state hydrogen exchange
and cooperative residue fluctuations from a simple
model. Biochemistry 37, 1067–1075.
77 Hilser VJ, Garcia-Moreno EB, Oas TG, Kapp G &
Whitten ST (2006) A Statistical Thermodynamic
Model of the Protein Ensemble. Chem Rev 106, 1545–
1558.
78 Yang LW & Bahar I (2005) Coupling between catalytic
site and collective dynamics: a requirement for
mechanochemical activity of enzymes. Structure 13,
893–904.
79 Bahar I, Atilgan AR, Demirel MC & Erman B (1998)
Vibrational dynamics of folded proteins: Significance of
slow and fast motions in relation to function and stabi-
lity. Phys Rev Lett 80, 2733–2736.
80 Flores S, Echols N, Milburn D, Hespenheide B, Keating
K, Lu J, Wells S, Yu EZ, Thorpe M & Gerstein M
(2006) The Database of Macromolecular Motions: new
features added at the decade mark. Nucleic Acids Res
34, D296–D301.
81 Gohlke H, Kuhn LA & Case DA (2004) Change in
protein flexibility upon complex formation: analysis of
Ras-Raf using molecular dynamics and a molecular
framework approach. Proteins 56, 322–337.
82 Adebodun F & Jordan F (1989) Multinuclear magnetic
resonance studies on the calcium (II) binding site in
trypsin, chymotrypsin, and subtilisin. Biochemistry 28,
7524–7531.
83 Krieger E, Darden T, Nabuurs SB, Finkelstein A &
Vriend G (2004) Making optimal use of empirical
energy functions: force-field parameterization in crystal
space. Proteins 57, 678–683.
84 Tsukada H & Blow DM (1985) Structure of alpha-chy-
motrypsin refined at 1.68 A
˚
resolution. J Mol Biol 184,
703–711.
85 Berman HM, Westbrook J, Feng Z, Gilliland G, Bhat
TN, Weissig H, Shindyalov IN & Bourne PE (2000)
The Protein Data Bank. Nucleic Acids Res 28, 235–
242.
86 Wang JM, Cieplak P & Kollman PA (2000) How well
does a restrained electrostatic potential (RESP) model
perform in calculating conformational energies of
organic and biological molecules? J Comput Chem 21,
1049–1074.
87 Stewart J (2000) MOPAC: a semiempirical molecula
orbital program. J Comput Aided Mol Des 4, 1–103.
88 Klamt A (1995) Conductor-Like Screening Model for
Real Solvents – a New Approach to the Quantitative
Calculation of Solvation Phenomena. J Phys Chem 99,
2224–2235.
89 Krieger E, Nielsen JE, Spronk CA & Vriend G (2006)
Fast empirical pK(a) prediction by Ewald summation.
J Mol Graph Model, doi:10.1016/j.jmgm.2006.02.009.
90 Essmann U, Perera L, Berkowitz ML, Darden T, Lee H
& Pedersen LG (1995) A Smooth Particle Mesh Ewald
Method. J Chem Phys 103, 8577–8593.
91 Chennubhotla C, Rader AJ, Yang LW & Bahar I
(2005) Elastic network models for understanding
Structural dynamics and serine protease catalysis R. J. Sola
´
and K. Griebenow
5318 FEBS Journal 273 (2006) 5303–5319 ª 2006 The Authors Journal compilation ª 2006 FEBS
biomolecular machinery: from enzymes to supramolecu-
lar assemblies. Phys Biol 2, S173–S180.
92 DeLano WL (2002) The PyMOL molecular graphics
system. .
Supplementary material
The following material is available for this article
online:
Fig. S1. H⁄ D exchange kinetic decay plots for a-CT,
the a-CT-lactose conjugates and the a-CT-dextran con-
jugates.
Fig. S2. Total energy equilibration during the produc-
tion phase of MD simulations for the various
glycoconjugates.
Fig. S3. Particle mesh Ewald electrostatic potential cal-
culated for a-CT and for the Lac14-CT conjugate
(positive potential: blue surface; negative potential: red
surface).
Fig. S4. Changes in root-mean squared displacements
(nrmsd) (A
˚
) versus residue index for the various
Lac-a-CT glycoconjugates structures with respect to
a-CT after MD simulations with YASARA
Dynamics
.
Video S1. Global domain motions for a-CT within the
protein’s most collective vibrational mode.
Table S1. Global energetic parameters and Debye–
Waller temperature factors calculated for a-CT and
the various lactose-a-CT conjugate structures modeled
including the glycan portion of the conjugates.
Table S2. Structural hydrogen bond composition and
protein-solvent hydrogen bond contacts calculated for
a-CT and the various lactose-a-CT conjugate struc-
tures modeled.
Table S3. Solvent accessible surface areas calculated
for a-CT and the various lactose-a-CT conjugate struc-
tures modeled.
Table S4. Average rmsd (A
˚
) for the conserved catalytic
residues calculated from MD simulations of a-CT and
the various Lac-a-CT conjugates modeled.
This material is available as part of the online article
from
R. J. Sola
´
and K. Griebenow Structural dynamics and serine protease catalysis
FEBS Journal 273 (2006) 5303–5319 ª 2006 The Authors Journal compilation ª 2006 FEBS 5319