The bar chart illustrates the quantity of Asian elephants in nine different countries over a period of 7 years
Bạn đang xem bản rút gọn của tài liệu. Xem và tải ngay bản đầy đủ của tài liệu tại đây (162.02 KB, 3 trang )
Homework 2
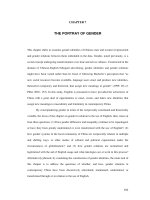
The bar chart illustrates the quantity of Asian elephants in nine different
countries over a period of 7 years.
It is clear that there was a slight decline in the number of Asian elephants in
all nations from 1997 to 2004. However, the figure for India and Myanmar
considerately increased and reached their peaks in the period given.
Outline body
Body 1
Body 2
In 1997
India: about 10,000
VN, Cambodia, Laos, China: around 1000
Myanmar: over 5000
Malaysia, Sri Lanka: 3000
Thailand: 4000
In 2004
India: 7500
VN, Laos: giảm nhẹ
Myanmar: giảm nhẹ 4500
Cambodia: tăng nhẹ
Malaysia: giảm mạnh 1000 China: giảm mạnh còn 500
Sri Lanka: 3000
In 1997, Asian elephants of India and Myanmar witnessed a significant
increase with the number of Indian elephants twice as many as that of
Myanmar, 10000 and 5000 respectively. Moreover, elephants in Thailand
stood at around 4000 while there were merely 3000 elephants for both of
Malaysia and Sri Lanka. In seven years later, those figures declined
moderately to 7500 for India and 4500 for Myanmar. Also, Sri Lanka still
remained unchanged about the number of elephants.
In term of the rest, Vietnam, Cambodia, Laos and China had 1000
elephants in 1997 while, after seven years, there were unstable changes
the figures for those countries, in which Vietnam and Laos remained
unchangeable. Otherwise, China hit a low of approximately 500 elephants
in the same period.
Homework 2
You should spend about 20 minutes on this task.
The chart and table below give information about healthcare
resources and life expectancy in different countries.
Summarize the information by selecting and reporting the main
features, and make comparisons where relevant.
You should write at least 150 words.
Hospital beds per thousand of the population
Pesron
Government health spending
The bar chart compares the number of hospital bed facilities for each thousand
patients in 8 countries while the table indicates the statistics about medical funds
and average lifespan in Japan, Netherlands and US.
Overall, although Japan allocates less money for healthcare, it has the highest
lifespan and the most beds available for its citizens while the others are not true.
According to the bar chart, while Japanese hospitals supply 14 beds available for
each thousand people, followed by Germany with 8 beds, the rest of the given
nations have roughly 4 beds per thousand of their patients.
From the table we can see that the US, which spends the most money on medical
services with 6,719 US dollars per person, has an average lifetime of only 78. In
contrast, as mentioned above, Japan invests the least expenditure for healthcare,
about 2,581 US dollars, but its population is expected to be the highest with the age
of 83, 3 years longer than the Netherlands, whose authority consumes
approximately 3,481 US dollars for health cost.