Tài liệu MARKAZ SECTOR REPORT GCC ASSET MANAGEMENT - 2011 doc
Bạn đang xem bản rút gọn của tài liệu. Xem và tải ngay bản đầy đủ của tài liệu tại đây (975.69 KB, 17 trang )
Summary Version: For Full Report, please contact
Jenevivu Lasrado at:
Disclaimer
This report has been prepared and issued by Kuwait Financial Centre S.A.K (Markaz), which is regulated by the Central Bank
of Kuwait. The report is owned by Markaz and is privileged and proprietary and is subject to copyrights. Sale of any copies of
this report is strictly prohibited. This report cannot be quoted without the prior written consent of Markaz. Any user after
obtaining Markaz permission to use this report must clearly mention the source as “Markaz “. The report is intended to be
circulated for general information only and should not to be construed as an offer to buy or sell or a solicitation of an offer to
buy or sell any financial instruments or to participate in any particular trading strategy in any jurisdiction.
The information and statistical data herein have been obtained from sources we believe to be reliable but no representation or
warranty, expressed or implied, is made that such information and data is accurate or complete, and therefore should not be
relied upon as such. Opinions, estimates and projections in this report constitute the current judgment of the author as of the
date of this report. They do not necessarily reflect the opinion of Markaz and are subject to change without notice. Markaz has
no obligation to update, modify or amend this report or to otherwise notify a reader thereof in the event that any matter
stated herein, or any opinion, projection, forecast or estimate set forth herein, changes or subsequently becomes inaccurate,
or if research on the subject company is withdrawn.
This report may not consider the specific investment objectives, financial situation and the particular needs of any specific
person who may receive this report. Investors are urged to seek financial advice regarding the appropriateness of investing in
any securities or investment strategies discussed or recommended in this report and to understand that statements regarding
future prospects may not be realized. Investors should note that income from such securities, if any, may fluctuate and that
each security’s price or value may rise or fall. Investors should be able and willing to accept a total or partial loss of their
investment. Accordingly, investors may receive back less than originally invested. Past performance is not necessarily
indicative of future performance.
Kuwait Financial Centre S.A.K (Markaz) does and seeks to do business, including investment banking deals, with companies
covered in its research reports. As a result, investors should be aware that the firm may have a conflict of interest that could
affect the objectivity of this report. This report may provide the addresses of, or contain hyperlinks to, websites. Except to the
extent to which the report refers to website material of Markaz, Markaz has not reviewed the linked site and takes no
responsibility for the content contained therein. Such address or hyperlink (including addresses or hyperlinks to Markaz’s own
website material) is provided solely for your convenience and information and the content of the linked site does not in any
way form part of this document. Accessing such website or following such link through this report or Markaz’s website shall be
at your own risk.
For further information, please contact ‘Markaz’ at P.O. Box 23444, Safat 13095, Kuwait; Email: ; Tel:
00965 1804800; Fax: 00965 22450647.
R E S E A R C H
Kuwait Financial Centre “Markaz” 2
Table of Contents
Executive Summary 4
Market Structure 4
Leadership Position 5
Performance 6
Cost 9
Benchmarks 10
Domicile 12
Managed Assets 13
GCC / MENA Funds 15
Equity Funds 16
Fixed Income Funds 19
Money Market Funds 21
Specialized Funds 24
Saudi Arabian Funds 26
Equity Funds 27
Fixed Income Funds 30
Money Market Funds 31
Specialized Funds 35
Kuwait Funds 36
Equity Funds 37
Fixed Income Funds 40
Money Market Funds 41
Specialized Funds 44
UAE Funds 45
Equity Funds 46
Money Market Funds 49
Qatar Funds 51
Equity Funds 52
Oman Funds 55
Equity Funds 56
Bahrain Funds 58
Equity Funds 58
Challenges 60
Appendices 65
Appendix 1: GCC Asset Management Industry - Geographic Classification / Asset Class wise –
1Q11 65
Appendix 2: GCC / MENA Funds Statistics – 1Q11 66
Appendix 3: Saudi Funds Statistics – 1Q11 72
Appendix 4: Kuwait Funds Statistics – 1Q11 77
Appendix 5: UAE Funds Statistics – 1Q11 80
Appendix 6: Qatar Funds Statistics – 1Q11 82
Appendix 7: Oman Funds Statistics – 1Q11 83
Appendix 8: Bahrain Funds Statistics – 1Q11 84
Appendix 9: Consolidated Fund Manager Ranking – 1Q11 85
Appendix 10: Consolidated Fund Manager Ranking – Equities – 1Q11 86
R E S E A R C H
Kuwait Financial Centre “Markaz” 3
Appendix 11: Fund Rankings (by Quarterly Alpha) – 1Q11 87
Appendix 12: Benchmark Details 89
Appendix 13: AUM Drill Down – Asset Class wise – 1Q11 90
Appendix 14: AUM Drill Down – Country wise – 1Q11 91
R E S E A R C H
Kuwait Financial Centre “Markaz” 4
GCC Asset Management - 2011
Executive Summary
Market Structure
GCC Asset Management Industry, with roughly 100 asset management
companies, manages USD 28.9bn
1
in assets in about 325 funds as of
31
st
March 2011.
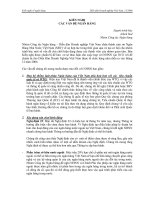
Geographically, Saudi Arabia country funds account for 62% of the total,
followed by Kuwait country funds with 19% share and GCC / MENA
mandated funds with 15% share. In terms of products, Money Market
funds lead the pack with a 50% share, followed by Equities at 44%
while the remainder is in Fixed Income and Specialized funds. Of the
total, Islamic funds manage USD 17.6bn (61%) in assets.
Figure 1: GCC Asset Management Industry – AUMs (1Q11)
Source: Zawya & Markaz Research
In terms of number of funds, GCC / MENA mandated funds top the table
with 131 funds (40%), followed by Saudi Arabia country funds with 109
funds (34%) and Kuwait country funds with 51 funds (16%). Product
wise, there are 200 Equity funds, 60 Money Market funds, 21 Fixed
Income funds and 44 Specialized funds. Contrary to assets under
management, there are more Conventional funds (176 funds) than
Islamic funds (149 funds).
Figure 2: GCC Asset Management Industry – Number of Funds (1Q11)
Source: Zawya & Markaz Research
1
Throughout this report, assets under management refers only to mutual fund assets unless mentioned explicitly
Markaz Research is
available on Bloomberg
Type “MRKZ” <Go>
Thomson Financial
Reuters Knowledge
Zawya Investor
Noozz
M.R. Raghu
CFA, FRM
Head of Research
+965 2224 8280
Layla Jasem Al-Ammar
Assistant Manager
+965 2224 8000 ext. 1205
Madhu Soothanan
Senior Research Analyst
+965 2224 8000 ext. 4603
Kuwait Financial Centre
“Markaz”
P.O. Box 23444, Safat 13095,
Kuwait
Tel: +965 2
224 8000
Fax: +965 2242 5828
markaz.com
R E S E A R C H
Kuwait Financial Centre “Markaz” 5
Kuwait, with USD 5.4bn of assets, had the highest AUM to GDP ratio of
4.1%, closely followed by Saudi Arabia with AUM to GDP ratio of 4%.
The ratio for all other countries was less than 0.5% implying lack of
institutional presence in the investment segment.
Table 1: GCC Asset Management Snapshot (1Q11)
Conventional
Funds Islamic Funds Total
No. of
Funds
AUM
($mn)
No. of
Funds
AUM
($mn)
No. of
Funds
AUM
($mn)
Average
Fund Size
($mn)
Mcap
($bn)
GDP
($bn)
AUM/GDP
Kuwait
30
4,219
21
1,182
51
5,401
106
114
131
4.1%
Saudi Arabia
38
2,941
71
14,915
109
17,856
164
355
444
4.0%
Qatar
9
392
1
17
10
409
41
88
129
0.3%
UAE
15
607
3
91
18
698
39
126
302
0.2%
Oman
5
100
0
0
5
100
20
16
56
0.2%
Bahrain
1
20
0
0
1
20
20
14
23
0.1%
GCC / MENA
78
3,022
53
1,345
131
4,367
33
713
N.A.
N.A.
Total
176
11,299
149
17,550
325
28,850
89
713
1,085
2.7%
Source: Zawya & Markaz Research
Leadership Position
The market is very concentrated amongst the top asset management
companies, with the top 10 asset managers accounting for 72% of the
total fund management industry. NCB Capital leads the list of large asset
management companies with USD 6bn in assets (21% market share),
followed by Sambacapital with USD 3.3bn in assets (11.5% share).
More than 65% of asset managers manage less than USD 100mn. The
bottom 50% of fund managers account for just 3.3% of the total
industry.
Table 2: Top 10 Fund Managers (1Q11)
No. Fund Manager
Total AUMs
($mn)
Market
Share
No. Fund Manager
Total AUMs
($mn)
Market
Share
1 NCB Capital 6,028 20.9%
6 Global Investment House 1,083 3.8%
2 Sambacapital 3,305 11.5%
7 Caam Saudi Fransi 1,053 3.7%
3 Riyad Capital 2,313 8.0%
8 National Investments Company 1,046 3.6%
4 Al Rajhi Capital 2,239 7.8%
9 Kuwait Financial Centre 918 3.2%
5 HSBC Saudi Arabia 1,940 6.7%
10 Kuwait Investment Company 788 2.7%
Source: Zawya & Markaz Research
In terms of segments, different asset managers take the top spot in
each segment. NCB Capital dominates Saudi Arabia with 33% market
share. Kuwait is a relatively more competitive market with the top asset
manager (National Investments Co.) having only 17% market share
closely followed by Kuwait Financial Centre (Markaz) at 16%. National
Bank of Abu Dhabi and Epicure Managers Qatar Ltd were the top asset
managers in UAE and Qatar, respectively.
Kuwait has the highest
AUM/GDP ratio of 4.1%
indicating high
institutionalization.
NCB Capital is the largest
fund management
company in GCC with
USD6bn in assets.
R E S E A R C H
Kuwait Financial Centre “Markaz” 6
Table 3: Top Asset Managers (By Segment) - 1Q11
Segment Manager
AUMs
($mn)
Segment
Market
Share
Saudi Arabia NCB Capital 5,908 33%
Kuwait National Investments Company 915 17%
GCC / MENA Caam Saudi Fransi 900 21%
UAE National Bank of Abu Dhabi 281 40%
Qatar Epicure Managers Qatar Limited 243 59%
Oman BankMuscat SAOG 30 30%
Bahrain N.M. N.M. N.M.
Source: Zawya & Markaz Research
Performance
Almost all GCC stock market indices were down in the first quarter of
2011. GCC Equity funds also mirrored the performance with majority of
funds giving negative returns in 1Q11. Among equity funds, Al Safwa
Investment fund (National Investments Company) was the best
performer (in terms of Alpha) with 1Q returns of 1.58% and alpha of
11.1%
2
. This was followed by Al Dar – Securities Fund with return of
0.41% and alpha of 9.88%.
MENA Income Fund (Al Mal Capital) was the best performer amongst
Fixed Income funds with return of 2.06% and alpha of 1.2% for the first
quarter. Al Mal - Liquidity Fund (Al Mal Capital) topped the list of Money
Market funds with a return of 0.76% and alpha of 0.62%.
On an Asset Weighted basis, Fixed Income & Money Market funds gave
better returns than equity funds in 1Q11. Islamic fixed income funds
were top performers in GCC (+1.4%) and Saudi Arabia (+0.2%). Islamic
money market funds topped in Kuwait (-0.3%) while Conventional
money market funds topped in UAE (+0.8%).
Table 4: Asset Weighted Returns – Top Returns (1Q11)
Segment Category 1Q11 (%)
Qatar Equity - Islamic 3.9%
GCC / MENA Fixed Income - Islamic 1.4%
UAE Money Market - Conventional 0.8%
Saudi Arabia Fixed Income - Islamic 0.2%
Kuwait Money Market - Islamic -0.3%
Oman Equity - Conventional -7.2%
Source: Zawya & Markaz Research
Contrary to returns, equity funds were the top Alpha generators.
Conventional equity funds produced highest alpha in Saudi, while Islamic
equity funds gave highest alpha in GCC, Kuwait, UAE and Qatar.
2
Alpha is based on our selection of benchmark and not necessarily based on the benchmark followed by the fund
On an Asset Weighted
basis, in 1Q11, Fixed
Income & Money Market
funds gave better returns
than equ
ity funds.
Equity funds mirrored the
stock markets with
majority of funds giving
negative returns in 1Q11.
R E S E A R C H
Kuwait Financial Centre “Markaz” 7
Table 5: Asset Weighted Returns – Alpha (1Q11)
Segment Category Alpha
Qatar Equity - Islamic 6.50%
Kuwait Equity - Islamic 6.40%
UAE Equity - Islamic 3.50%
Oman Equity - Conventional 1.50%
GCC / MENA Equity - Islamic 1.40%
Saudi Arabia Equity - Conventional 0.90%
Source: Zawya & Markaz Research
2010 Performance
In 2010, among equity funds, Qatar Conventional & Islamic funds
delivered the highest asset weighted returns of 27.59% and 19.95%
respectively. Kuwait conventional funds with asset weighted return of
18.89% gave the next best performance. In terms of Alpha, Watan -
NBK Kuwait Equity Fund was the best performer generating 17% alpha
for 2010.
In 2010, Saudi focused conventional equity funds returned 15.5% on an
asset weighted basis while Saudi Islamic funds delivered 13.61%.
Among Fixed income funds, GCC Conventional funds gave the highest
asset weighted return of 6.84% followed by GCC Islamic funds with
5.55% return. Makaseb - Income Fund was the top performer in GCC
conventional category with 14.7% returns in 2010.
UAE conventional Money Market funds gave the best performance
among money market funds on an asset weighted basis. UAE
conventional funds delivered 3.83% in 2010 followed by 1.63% by UAE
Islamic funds. There are only 2 money market funds in UAE, one each in
conventional and Islamic category.
In 2010, Qatar
Conventional & Islamic
equity funds delivered the
highest asset weighted
returns of 27.59% and
19.95% respectively.
R E S E A R C H
Kuwait Financial Centre “Markaz” 8
Table 6: Performance – 2010
Equity
Category
No. Of
Funds
Weighted
Return
(2010) Top Performer
2010
Alpha
Sharpe
Ratio
Inform
ation
Ratio
GCC - Conventional 57 13.07% PF(LUX) - Middle East & North Africa Fund 12.62% N.A. N.A.
GCC - Islamic 26 11.81% Jadwa - GCC Equity Fund 8.50% 0.01 1.47
Saudi - Conventional 23 15.47% Morgan Stanley - Saudi Equity Fund 8.03% N.A. N.A.
Saudi - Islamic 27 13.61% Anb Invest - Al Mubarak Saudi Equity Fund 8.70% -0.01 0.44
Kuwait - Conventional 22 18.89% Watan - NBK Kuwait Equity Fund 17.02% -0.04 0.24
Kuwait - Islamic 14 7.47% CapCorp - Local Fund -8.65% N.A. N.A.
UAE - Conventional 13 -4.12% Makaseb - Emirates Opportunities Fund 3.91% -0.09 0.26
UAE - Islamic 2 -3.81% NBAD - UAE Islamic Fund 4.17% -0.05 0.67
Qatar - Conventional 9 27.59% SHUAA - Qatar Gate N Fund 12.36% 0.05 0.13
Qatar - Islamic 1 19.95%
Global
-
Al Beit Al Mali Shariah Compliant
Fund -4.80% 0.11 N.A.
Oman - Conventional 5 7.55% Vision - Emerging Oman Fund 4.06% -0.03 0.21
Bahrain - Conventional 1 4.79% SIC - Selected Securities Fund 6.59% -0.02 -0.34
Fixed Income
Category
No. Of
Funds
Weighted
Return
(2010) Top Performer
2010
Alpha
Sharpe
Ratio
Informati
on Ratio
GCC - Conventional 8 6.84% Makaseb - Income Fund 3.38% N.A. 0.92
GCC - Islamic 6 5.55% FFTW - BNP Paribas Hilal Income Fund -3.02% N.A. N.A.
Saudi - Islamic 2 0.63% SHCC - Al Yusr Murabaha & Sukuk Fund 0.08% 2.66 0.72
Kuwait - Conventional 4 -5.50% Gulf - KD Bond Fund -2.60% -0.01 -0.19
Money Market
Category
No. Of
Funds
Weighted
Return
(2010) Top Performer
2010
Alpha
Sharpe
Ratio
Informati
on
Ratio
GCC - Conventional 3 0.64% CAAM - SAR Money Market Fund 0.45% 2.45 -0.95
GCC - Islamic 6 0.44% Jadwa - US Dollar Murabaha Fund 0.29% 0.91 -0.59
Saudi - Conventional 10 0.87% Samba - Al Razeen Riyal Fund 0.79% 3.33 4.68
Saudi - Islamic 32 0.63% The Investor - Saudi Riyal Murabaha Fund 2.92% N.A. N.A.
Kuwait - Conventional 2 -3.47% Global - KD Money Market Fund 1.10% N.A. 0.89
Kuwait - Islamic 5 -1.15% Al Imtiaz - Money Market Fund 3.13% 3.07 2.14
UAE - Conventional 1 3.83% Al Mal - Liquidity Fund 2.34% N.A. N.A.
UAE - Islamic 1 1.63% CBD - Al Dana Murabaha Fund 0.14% 0.23 N.A.
Source:
Zawya, S&P & Markaz Research
Note: Alpha against our selection of benchmark. Information Ratio against Fund's own benchmark (3 years), Sharpe Ratio (3 years)
R E S E A R C H
Kuwait Financial Centre “Markaz” 9
Cost
Equity Funds in the GCC region, on average, charge 1.48% as fund
management fee. This is apart from Administration and custodian fees.
UAE funds charge the highest management fee of 1.73%, followed by
Saudi Arabian funds (1.68%). Performance fee is virtually nonexistent in
Saudi funds.
Table : Average Cost of Equity Funds
Source:
Zawya & Markaz Research.
Note:
Performance fee is charged only after achieving a threshold return.
As in any other markets, Fixed Income and Money Market funds are
cheaper in GCC region as well. GCC / MENA mandated funds charge the
highest management fee of 1.06% in Fixed Income category.
Table: Average Cost of Fixed Income Funds
Administration Subscription Redemption Performance Custodian Management
Qatar N.A. N.A. N.A. N.A. N.A. N.A.
Oman N.A. N.A. N.A. N.A. N.A. N.A.
Bahrain N.A. N.A. N.A. N.A. N.A. N.A.
UAE N.A. N.A. N.A. N.A. N.A. N.A.
Kuwait 0.17% 0.25% 0.00% 0.00% 0.08% 0.69%
Saudi 0.00% 0.75% 0.25% 0.00% 0.25% 0.75%
GCC / MENA 0.15% 1.88% 0.38% 2.79% 0.13% 1.06%
Source: Zawya & Markaz Research
Saudi Arabian Money Market funds charge the highest
management fee of 1.61%, which is due to high cost associated with
some Trade Finance funds. GCC / MENA funds are the cheapest
(0.50%).
Table: Average Cost of Money Market Funds
Administration Subscription Redemption Performance Custodian Management
Qatar N.A. N.A. N.A. N.A. N.A. N.A.
Oman N.A. N.A. N.A. N.A. N.A. N.A.
Bahrain N.A. N.A. N.A. N.A. N.A. N.A.
UAE 0.03% 1.00% 0.00% 0.00% 0.03% 0.63%
Kuwait 0.16% 0.25% 0.09% 0.00% 0.09% 0.84%
Saudi 0.15% 0.01% 0.02% 0.00% 0.02% 1.61%
GCC / MENA 0.14% 0.78% 0.00% 0.00% 0.01% 0.50%
Source: Zawya & Markaz Research
Administration Subscription Redemption Performance Custodian Management
Qatar 0.14% 2.55% 0.80% 15.50% 0.32% 1.53%
Oman 0.33% 2.40% 2.20% 7.00% 0.15% 1.44%
Bahrain 0.08% 3.00% 0.00% 20.00% 0.09% 1.00%
UAE 0.14% 2.23% 2.23% 11.15% 0.14% 1.73%
Kuwait 0.07% 1.32% 0.32% 8.38% 0.10% 1.38%
Saudi 0.14% 1.68% 0.19% 0.60% 0.09% 1.68%
GCC / MENA 0.15% 2.55% 0.62% 9.64% 0.12% 1.63%
Equity Funds, on average,
charge 1.48% as fund
management fee.
R E S E A R C H
Kuwait Financial Centre “Markaz” 10
Benchmarks
Most GCC country funds adopt local stock market indices as their
benchmark. As local indices are price return indices, fund manager
performance (with respect to the benchmark) is overstated to the extent
of dividend yield. Among global index providers, MSCI and S&P are the
most active in the region. Majority of Shariah complaint funds use S&P
indices as benchmarks since MSCI discontinued Saudi securities from its
indices.
Table 7: Benchmark Used by Most Equity Funds
Conventional Islamic
Saudi Arabia Tadawul All Share Index (12) S&P Saudi Arabia Shariah Index (15)
Kuwait KSE Weighted Index (7) KSE Weighted / Global Islamic Index (2)
UAE MSCI UAE Index (5) N.A.
Qatar Doha Stock Market Index (6) N.A.
Oman Muscat SM Index (4) N.A.
GCC / MENA S&P GCC Index (8) S&P GCC Composite Shariah Index (10)
Note: Numbers in bracket indicate the number of funds using the benchmark.
Source: Zawya & Markaz Research
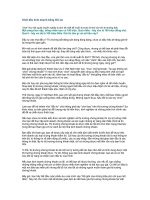
In Saudi Arabia, the TASI Index is used as a benchmark by 12 out of the
total 23 conventional equity funds. 16 of the 27 Islamic equity funds use
S&P Saudi Arabia Shariah Index as a benchmark. Among money market
funds, most funds in Saudi Arabia use SIBOR as the benchmark.
Figure 3: Benchmark Used by Saudi Conventional Equity Funds
Source: Zawya & Markaz Research
In Kuwait, 7 out of the 20 conventional equity funds use KSE Weighted
Index as their benchmark. 4 funds use KIC index (Kuwait Investment
Company). Most GCC / MENA equity funds use S&P GCC Index and S&P
Pan-Arab Shariah Index as benchmarks for conventional and Islamic
funds, respectively.
TASI Index is used by
most Saudi Arabian
Conventional equity
funds
.
Most GCC country funds
adopt local stock market
indices as their
benchmark.
R E S E A R C H
Kuwait Financial Centre “Markaz” 11
Figure 4: Benchmark Used by Kuwait Conventional Equity Funds
Source: Zawya & Markaz Research
KSE Weighted Index is
the most commonly used
benchmark for Kuwaiti
equity funds.
R E S E A R C H
Kuwait Financial Centre “Markaz” 12
Domicile
The ranking of GCC countries in terms of number of funds domiciled,
indicate that country of domicile relates to the size of each country’s
asset management industry with only a few exceptions. There were 140
funds domiciled in Saudi Arabia managing USD 19.3bn in assets,
followed by Kuwait with 58 funds managing USD 5.7bn.
Bahrain, true to its reputation as a financial hub, has 39 funds with USD
1.1bn in assets. Most of the funds domiciled in Bahrain are mandated to
invest in GCC/MENA region.
Table 8: Number of Funds and Fund Size as per Country of Domicile (1Q11)
Country No of Funds Fund Size ($mn)
Saudi Arabia 140 19,339
Kuwait 58 5,679
Bahrain 39 1,137
UAE 26 905
Luxembourg 16 317
Channel Islands 9 292
Oman 9 196
Qatar 8 279
Cayman Islands 6 47
Ireland 5 55
Bermuda 4 296
Jordan 2 3
Virgin Islands (British) 1 56
Isle of Man 1 243
Singapore 1 19
Grand Total 325 28,862
Source: Zawya & Markaz Research
Given that local investors make up the bulk of participants in GCC/MENA
funds, local markets tend to suffice as domiciles for these funds, with
Saudi Arabia, Kuwait and Bahrain being the most popular choices and
accounting for 73% of the total.
Outside of the region, Luxembourg is the most prevalent location for
domiciliation of funds, accounting for 5% of the total. Luxembourg was
the first European country to implement the Undertakings for Collective
Investment in Transferable Securities (UCITS) in the 1980’s and is
currently host to about 75% of UCITS authorized funds in the European
Union
3
.
As the GCC asset management industry grows and aims to diversify the
investor base by attracting more foreign and institutional investors, we
would expect to see managers increasingly turning to Luxembourg or
other European nations for domiciliation.
3
Chevalier & Sciales, a Luxembourg law firm
There were 140 funds
domiciled in Saudi Arabia
managing USD 19.3bn in
assets
R E S E A R C H
Kuwait Financial Centre “Markaz” 13
Figure 5: Funds Domiciled in each Country as % of Total (1Q11)
Source: Zawya & Markaz Research
Specialized Funds
Despite the fact that the majority of funds across the region are of the “plain
vanilla” equity variety, there are new and innovative types of funds which are
being introduced to deal with the unique dynamics and opportunities presented
by the GCC/MENA markets. In our database, such funds are grouped under
“Specialized” funds and they account for approximately 3.5% of total assets
under management.
These Specialized Funds have ranged from standard sector-specific funds
focused on such important sectors like Telecom, Banking & Financials and Real
Estate, to more specific funds such as those dedicated to IPO’s, infrastructure,
and capital protection etc. Markaz Forsa fund (based on call options) is also a
good example. Some funds use advanced quantitative tools to manage risks.
Given the unique opportunities and challenges facing the GCC/MENA markets,
these types of funds are expected to grow over the coming years as asset
managers and investors attempt to capitalize on local/regional developments.
The growth of this type of funds ought to be encouraged by local regulatory
authorities as an avenue for attracting institutional and foreign investors in order
to diversify the type of investors within the industry.
Managed Assets
The Central Bank of Kuwait on a monthly basis publishes a detailed break up of
the assets of the investment companies, which includes – Portfolio investments
(Managed Accounts), equity, debt and investment fund units held by local
investment companies, custody accounts, foreign funds and commitments and
guarantees. This is by far the most transparent break-up of assets of the asset
management industry available in the GCC region. This provides us with a
preliminary break-up between managed accounts and mutual funds for Kuwait.
As of May 2011, the size of Kuwait fund management industry size as disclosed
by CBK is at USD 6.6bn and the assets managed under portfolio’s is at USD 54bn
– a factor of 8x. Similarly for Saudi Arabia, CMA provides the total assets in
mutual funds, which amounts to USD 23.6bn. However, SAMA does not provide
R E S E A R C H
Kuwait Financial Centre “Markaz” 14
statistics for assets managed under managed accounts. This leads us to take an
intelligent guess on the proportion of managed accounts to investment funds for
the rest of the region.
We believe that Kuwait is an extreme outlier mainly due to the presence of
higher number of investment companies as compared to the rest of the region.
Therefore, we believe that, Saudi Arabia and UAE will have a lesser proportion of
managed accounts than Kuwait, but higher than smaller markets such as Qatar,
Oman and Bahrain. We believe that the assets managed under managed
accounts will be 4x and 3.5x larger than investment funds in Saudi Arabia and
the UAE as compared to 2x for the rest of the smaller markets. On a GCC level,
we believe that Managed accounts will be at least 5x larger than the assets
managed under mutual funds.
Table 9: – Estimating the Size of Managed Accounts (USD Bn) – 1Q11
Investment
Funds
Portfolio
Investments
(Managed
Accounts) Total
Managed
Accounts
Proportion to
Investment Funds
GDP
($ bn)
Total AUM
/ GDP
Saudi Arabia 19.18 76.72 95.90 400% 444 21.6%
Kuwait 6.58 54.00 60.58 821% 132 45.9%
UAE 1.55 5.43 6.98 350% 302 2.3%
Qatar 0.51 1.02 1.53 200% 129 1.2%
Bahrain 0.29 0.58 0.87 200% 56 1.6%
Oman 0.20 0.40 0.60 200% 23 2.6%
Total 28.31 138.15 166.46 488% 1,086 15.3%
Note: The Investment Funds figures represent AUMs managed in funds within each country regardless of
Fund focus and hence does not tally with overall figure
Source: CBK, SAMA, IMF, Zawya & Markaz Research
AUM to GDP ratio was 2.7% if only mutual fund assets are considered. If
Managed Accounts are also added, the AUM to GDP ratio increases to 15.3% -
an increase of nearly 6 times. After accounting for assets under managed
accounts, Kuwait had the highest AUM to GDP ratio of 46%, followed by Saudi
Arabia with 22%.
R E S E A R C H
Economics
MENA Unrest (Apr
-
11)
Kuwait Development Plan (Mar-11)
Kuwait Investment Sector (Sept-10)
The New Regulations on Kuwait Investment Sector (Jun-10)
Kuwait Capital Market Law (Mar-10)
The “Vicious Square” Monetary Policy options for Kuwait (Feb-08)
To Leap or To Lag: Choices before GCC Regulators (Apr-07)
GCC for Fundamentalists (Dec-06)
GCC Leverage Risk (Nov-06)
Sectors
Infrastructure
GCC Ports (Aug-11)
GCC Water (Aug-11)
GCC Roads & Railways (Aug-11)
GCC ICT (Jul-11)
GCC Airports (Jul-11)
GCC Power (Jul-11)
Real Estate
Abu Dhabi Algeria Dubai Egypt
Jordan KSA Kuwait Lebanon
Qatar Syria U.S.A.
Banking
Stress Testing Kuwait Banks (May-11)
GCC Banks - Done with Provisions? (Jan-10)
Shelter in a Storm (Mar-09)
Banking Sweet spots (Apr-08)
Oil & Gas
Diworsification: The GCC Oil Stranglehold (Jan-09)
Periodic Research
Monthly
Regional Petroleum Projects Commentary
Weekly
Real Estate Market Commentary
Daily
Oil & Gas Bulletin
Strategic Research
GCC Outlook 2H11 (Aug-11)
What to expect in 2011 (Jan-11)
The Golden Portfolio (Sept-10)
Persistence in Performance (Jun-10)
What to expect in 2010 (Jan-10)
What is left for 2009? (Sept-09)
Missing the Rally (Jun-09)
This Too Shall Pass (Jan-09)
Fishing in Troubled Waters (Dec-08)
Down and Out: Saudi Stock Outlook (Oct-08)
Mr. GCC Market-Manic Depressive (Sept-08)
Global Investment Themes (June-08)
To Yield or Not To Yield (May-08)
China and India: Too Much Too Fast (Oct-07)
A Potential USD 140b Industry: Review of Asset Management
Industry in Kuwait (Sep-07)
A Gulf Emerging Portfolio: And Why Not? (Jun-07)
Derivatives Market in GCC (Mar-07)
Managing GCC Volatility (Feb-07)
Periodic Research
Annual
GCC Market Outlook
Quarterly
Thought Speaks
GCC Equity Funds
GCC Corporate Earnings
GCC Equity Research Statistics
Monthly
Market Review
Weekly
MENA Market Intelligence
KSE Market Review
International Market Update
Daily
Markaz Daily Morning Brief
Markaz Kuwait Watch
Daily Fixed Income Update
Company Research
(See the list attached)
Capital Markets
Markaz Research Offerings
R E S E A R C H