Tài liệu Báo cáo khoa học: What makes biochemical networks tick? A graphical tool for the identification of oscillophores ppt
Bạn đang xem bản rút gọn của tài liệu. Xem và tải ngay bản đầy đủ của tài liệu tại đây (297.03 KB, 11 trang )
What makes biochemical networks tick?
A graphical tool for the identification of oscillophores
Boris N. Goldstein
1
, Gennady Ermakov
1
, Josep J. Centelles
3
, Hans V. Westerhoff
2
and Marta Cascante
3
1
Institute of Theoretical and Experimental Biophysics, Russian Academy of Sciences, Pushchino, Moscow Region, Russia;
2
BioCentrum Amsterdam, Departments of Molecular Cell Physiology (IMC, VUA) and Mathematical Biochemistry (SILS, UvA),
Amsterdam, the Netherlands;
3
Department of Biochemistry and Molecular Biology, Faculty of Chemistry and CeRQT at Barcelona
Scientific Parc, University of Barcelona, Spain
In view of the increasing number of reported concentration
oscillations in living cells, methods are needed that can
identify the causes of these oscillations. These causes always
derive from the influences that concentrations have on
reaction rates. The influences reach over many molecular
reaction steps and are d efined by the d etailed molecular
topology of the network. So-called Ôautoinfluence pathsÕ,
which quantify the influence of one molecular species upon
itself through a particular path through the network, can
have positive or negative values. The former bring a ten-
dency towards instability. In this molecular context a new
graphical approach is presented that enables the classifica-
tion of network topologies into oscillophoretic and non-
oscillophoretic, i.e. into ones that can and ones that cannot
induce concentration oscillations. The network topologies
are formulated in terms of a set of uni-molecular and
bi-molecular reactions, organized into branched cycles of
directed reactions, and presented as graphs. Subgraphs of
the n etwork topologies are then classified as negative ones
(which can) and positive ones (which cannot) give rise to
oscillations. A subgraph is oscillophoretic (negative) when it
contains more positive than negative autoinfluence paths.
Whether the former generates oscillations depends on the
values of the other subgraphs, which again depend on the
kinetic parameters. An example shows how this can be
established. By following the rules of our new approach,
various oscillatory kinetic models can be constructed and
analyzed, starting from the classified simplest topologies and
then working t owards desirable complications. Realistic
biochemical examples are analyzed with the new method,
illustrating two new main classes of oscillophore topologies.
Keywords: graph-theoretic approach; kinetic mode lling;
oscillations; s ystem identification; systems biology.
Oscillatory biochemical networks have regained intensive
interest during the past few years because of the importance
of oscillatory signaling for various biological functions.
Oscillations in glycolysis [1,2], oscillations of Ca
2+
concen-
trations [3,4], and the cell cycle as such [5] are well known.
Some of these have been predicted and analyzed by using
mathematical models [6,7]. The need for such mathematical
models is appreciated even more w hen studying biochemical
oscillations and their synchronization [7–13].
The behavior of potential biochemical oscillators may
depend on the kinetic properties of t heir surroundings,
interacting with t he oscillator through c ommon metabolites
(e.g [8,14]). Other systems, such as the cell cycle of tumor
cells may be more autonomous [9]. Most intracellular
oscillations involve more than five components that interact
in a nonlinear man ner [8]. This makes them unsuitable for
intuitive analysis, a phenomenon encountered more fre-
quently in Systems Biology [8]. New theoretical approaches
are needed that streamline the study of such cases of
Systems Biology, dissecting the system into various inter-
acting kinetic regimes, whilst relating to molecular mecha-
nisms.
Various types of approach can be helpful here. Graph-
theoretic approaches can help dissect the dynamics of
enzyme reactions [15,16] and this is what made others and
ourselves [20,25,26] examine whether these approaches can
also do this for networks. Earlier w e have applied graph
theory in order t o simplify the King–Altman–Hill [15,16]
analysis of steady-state enzyme reactions [17,18]. This
approach was later extended to presteady-sta te enzyme
kinetics [19], to s tability a nalysis o f enzyme systems [20],
and to the analysis of concentration oscillations in enzyme
cycles [21].
In this paper, the graph-theoretical stability analysis
developed b y C larke [ 22] as modified b y I vanova [21,23,24]
is the starting point for a more comprehensive approach
to the an alysis of biochemical networks. It enables us to
develop a graph-theoretical identification of networks that
may, and of networks that cannot, serve as oscillophores
(i.e. induce oscillations).
In some aspects our approach is similar to that reported
previously [25,26]. However, we use unimolecular a nd
bimolecular steps and simple c atalytic cycles, rather than
Correspondence to M. Cascante, Department of Biochemistry and
Molecular Biology, Faculty of Chemistry and CERQT-Parc Scientific
of Barcelona, University of Barcelona, c/Martı
´
iFranque
`
s 1, 08028
Barcelona, Spain. Fax: +34 934021219; Tel.: +34 934021593;
E-mail: or Hans V. Westerhoff, Faculty of Earth and
Life Sciences, Free University, De Boelelaan 1087, NL-1081 HV
Amsterdam, the Netherlands. Fax: +31 204447229;
E-mail:
(Received 6 July 2004, revised 30 J uly 2004, accepted 4 August 2004)
Eur. J. Biochem. 271, 3877–3887 (2004) Ó FEBS 2004 doi:10.1111/j.1432-1033.2004.04324.x
quadratic and cubic autocatalytic cycles. We identify
subschemes of the specific biochemical network that induce
instability. We then consider inte rconnections between such
a subscheme a nd other parts of the kinetic scheme with or
without eliminating the instability. The procedure o f this
paper uses so-called dual graphs with two types of vertices,
i.e. for both species and r eactions [21]. I n t his w ay all t ypes
of reactions can be analyzed in a uniform manner. The
procedure allows us to estimate the p arameter values for
which oscillations occur. Presence or absence of steady
states on the border of the phase space [21,23] then suffices
to predict the occurrence of limit-cycle oscillations. We
illustrate our method by applying it to two biochemical
systems, which include oscillophores of two different classes.
Results
Paths: graphical representation of kinetic influences
We represent kinetic schemes b y dual g raphs, combining
reaction-centered and substance-centered graphs [21].
Accordingly, our kinetic schemes for biochemical networ ks
have two kinds of vertices, i.e. one kind for species (here
shown by open circles) a nd one kind for reactions (shown by
closed circles). The circles are connected by arrows. For
example, the reaction x
i
+ x
j
fi x
m
is represented by the
following reaction-centered graph:
where x
i
, x
j
and x
m
are c hemical s pecies (substances ) and v
r
is the rate of the r
th
reaction. Graph 1 shows that two
species x
i
and x
j
participate in the same r
th
reaction as
substrates with corresponding stoichiometric coefficients a
ir
and a
jr
. The species x
m
is synthesized in this r
th
reaction at
a stoichiometry b
mr
. Using the mass-action law, in which
molecularity and k inetic order of reaction a re equal, we can
write:
v
r
¼ k
r
Á x
a
ir
i
Á x
a
jr
j
ð1Þ
where k
r
is the k inetic constant. T his implies t hat we do not
dissect biochemical networks i nto t he net enzyme-catalyzed
reactions, but into the unidirectional elementary r eaction
steps underlying the enzyme kinetics. The terms x
i
, x
j
and x
m
include the concentrations of both m etabolites and enzyme-
forms. Rates v
r
are always positive. As a consequence of the
dissection down to t he molecular p rocesses, the stoichio-
metric coefficients equal one or zero, i.e.
a
ir
; b
ir
¼ 1or0 ð2Þ
with 1 for participating and 0 for nonparticipating species.
Reactions involving more than one molecule of a single
species are described as a sequence of two independent
reactions. Assuming s patial homogeneity and a sin gle
compartment, the kinetic equations for t he reaction network
are then written as follows:
dx
i
dt
¼
X
r
ðÀa
ir
þ b
ir
Þv
r
; ði ¼ 1; 2; :::; nÞð3Þ
where summation is over all r ¼ 1, 2,…, R reactions.
Species x
i
(i ¼ 1, 2,…, n) participate in these reactions as
substrates and/or products, as illustrated graphically in the
species-centered Graph 2:
ðr À 1Þ
!
b
iðrÀ1Þ
x
i
À!
a
ir
ðrÞ
Graph 2:
Similarly to the procedure developed b y Clarke [22], we
linearize the system of Eqn (3) in the vicinity of the steady
state. We do this to investigate the stability of this state. In
this way we obtain the influence a small change in the
concentration of substance j, i.e. Dx
j
,hasonthetime
displacement of t he conc entration of species i from its
steady-state value:
dDx
i
dt
¼
X
r;j
ðÀa
ir
þ b
ir
Þ
@v
r
@x
j
Dx
j
; ði ¼ 1; 2; :::; mÞð4Þ
where the summation is over both all r ¼ 1, 2,…,R
reactions and all j ¼ 1, 2,…, m<nindependent concen-
trations. From t he law of m ass action ( Eqn 1) i t follows for
the kinetic order of the re actions that:
@v
r
@x
j
¼ a
jr
v
r
x
j
ð5Þ
Therefore, Eqn ( 4) can be rewritten as:
dDx
i
dt
¼
X
r;j
ðÀa
ir
þ b
ir
Þa
jr
v
r
x
j
Dx
j
¼
X
j
b
ij
Dx
j
ð6Þ
Coefficients b
ij
are the elements of the Jacobian (matrix) B
representing the direct influences of x
j
on x
i
:
b
ij
¼
X
r
ðÀa
ir
þ b
ir
Þa
jr
v
r
x
j
ð7Þ
For small deviations from the steady state, the elements of
b
ij
that multiply a b with an a characterize the sum of all
reactions that convert x
j
to x
i
in a single step, i.e. all
reactions directed as x
j
fi x
i
. Any reaction contributing to
that overall reaction x
j
fi x
i
does so to the absolute extent
v
r
/x
j
, t he sign o f its contribution depending on the direction
of the reaction, as specified by Eqn (7). The terms that
multiply an a and a b therewith represent the positive
influence that a substrate of a reaction has on the product o f
the r eaction. The terms of b
ij
that multiply two a’s, represent
the negative influences of two substances on each other
when both are consumed in that reaction. Indeed, each
element of the Jacobian corr esponds to one or a number of
such direct influences of one metabolite on another, direct in
the sense that the influence is through s ingle reaction steps.
A number of s uch reaction steps may operate in parallel
(but not in series) for each element of the Jacobian. In
addition, one reaction step may convey more than one
influence.
Graph 1.
3878 B. N. Goldstein et al.(Eur. J. Biochem. 271) Ó FEBS 2004
To predict t he dynamics of the system it is i ndeed helpful
to classify these influences into positive and negative ones.
Again, depending on whether the reaction stoichiometry
is an a or a b, two types of influence are seen in Eqn (7).
They are shown graphically in Eqns (8) and (9) together
with their corresponding contributions to b
ij
:
x
j
À!
a
jr
v
r
À!
b
ir
x
i
; b
ij
¼ a
jr
Áþb
ir
Á
v
r
x
j
¼þ
v
r
x
j
ð8Þ
x
j
À!
a
jr
v
r
À
a
ir
x
i
; b
ij
¼ a
jr
ÁÀa
ir
Á
v
r
x
j
¼À
v
r
x
j
ð9aÞ
Although they are similar to Graph (1), Eqns (8) and (9a)
have meanings that differ from t he meaning of Graph (1):
They do not represent chemical conversions but rather the
influences of one substance on another. For this reason w e
shall c all t hem one-step influences or one-reaction (influ-
ence) steps: they are not branched and correspond to any
step between two substances in graphs such as Graph (1),
i.e. any path that involves a single chemical reaction. One
actual chemical reaction may effect a number of such one-
step influences, typically from any s ubstrates onto any of its
products, b etween its substrates and of a substrate on itself.
Equations (8) a nd (9a) should be read as follows. They
indicate the influence the (production rate of the) substance
on the right may experience through reaction r,fromthe
substance o n the left, which is a substrate of that reaction r if
the l eft h and factor a equals 1 (and not zero, as other wise).
Such an influence exists a nd is positive if the substance on
the r ight is the product of that reaction (then there is a factor
b equal to 1) a nd the right hand arrows points towards that
substance. Such a n influence also exists but is negative when
the s ubstance on the right i s a substrate o f the reaction.
Then the a rrow points b ackward, i.e. a way from t he
substance and there is a right-hand factor – a equal to )1.
Influences of the type in Eqn (8) contribute positive
values to b
ij
and are called positive one-reaction (influence)
paths, or positive (influence) steps. This is the influence that
a substrate has on the product of a reaction. If i ¼ j,this
positive path becomes a positive loop (see bel ow).
Influences of the type in Eqn (9a) are designated as
negative one-reaction (influence) paths or negative i nfluence
steps [21] because they contribute negative values to b
ij
.
They correspond to the influence of a substrate on a nother
substrate o f the same reaction r. If i ¼ j, Eqn (9a) defines a
so-called negative half-step instead of a negative step (we
omit ÔinfluenceÕ for brevity):
x
i
À!
a
ir
v
r
À
a
ir
x
i
; b
ii
¼ a
ir
ÁÀa
ir
Á
v
r
x
i
¼À
v
r
x
i
ð9bÞ
which could also have b een symbolized as:
x
i
À!
ða
ir
Þ
2
v
r
; b
ii
¼ a
ir
ÁÀa
ir
Á
v
r
x
i
¼À
v
r
x
i
ð9cÞ
hence its name Ôhalf-stepÕ. This is the (negative) influence a
substrate has on its own removal. It is obtained for all
substrates of any elementary reaction.
The main point of the present section is that any Jacobian
matrix element equals the sum of a number of direct parallel
influence steps (one-step influence paths) in the kinetic
scheme, i.e. the sum of paths through reaction-centered
graphs of the type o f Graph 1 (these paths may contain
parallel and antiparallel arrows). The sign of that element
therefore depends on the both the sign and the magnitudes
of these influen ce paths (see below). If all its i nfluence paths
are positive, the Jacobian matrix element will be positive
and for the J acobian matrix eleme nt to b e negative at l east
one influence path must be negative. These are properties
that we shall use below.
How graphical structures relate to instability
For the linear system given in Eqn (6) the so-called
characteristic polynomial p(k)is:
pðkÞ¼detðB À kIÞ¼0 ð10Þ
Here B is again the Jacobian with elements b
ij
and I is the
unit matrix. The polynomial Eqn (10) can be expanded as
follows
pðkÞ¼k
m
þ a
1
k
mÀ1
þ a
2
k
mÀ2
þ ::: þ a
m
¼ 0 ð11Þ
where m<n continues to refer to the number of inde-
pendent concentration variables. The coefficient a
i
is related
to the element b
ij
of the Jacobian by:
a
1
¼ðÀ1Þ
1
Á
X
i
b
ii
; a
2
¼ðÀ1Þ
2
Á
X
i;j
b
ii
b
jj
À
X
i;j
b
ij
b
ji
;
a
3
¼ðÀ1Þ
3
Á
X
i;j;k
b
ii
b
jj
b
kk
À
X
i;j;k
b
ii
b
jk
b
kj
þ
X
i;j;k
b
ij
b
jk
b
ki
; ; a
m
¼ðÀ1Þ
m
Á det B ð12Þ
Each coefficient of the characteristic equation hereby is a
ÔsumÕ of products (with various signs, see below) of elements
of the Jacobian.
In graphic al terms the coefficient a
p
equals the sum of all
possible Ôp
th
order simplest combinations of minus auto-
influence pathsÕ. An autoinfluence path (or, shorter, a cycle)
is defined as a cyclic path of any length through the
diagram, such that any reactio n and any species occurs only
once on that path. Autoinfluence paths of lengths 1, 2 , 3, etc.
correspond to the terms b
ii
, b
ij
b
ji
, b
ij
b
jk
b
ki
, etc., respectively,
inEqn(12).Theycontain1,2,3,etc.speciesand1,2,3,etc.
influence steps, respectively. Autoinflu ence paths of length 1
are h alf-steps, graphically represented as i n Eqn (9c). An
autoinfluence path runs from some species k back to species
k an d travels through positive i nfluence steps [reaction
nodes with equally directed arrows, as in E qn (8)] or
negative influnce s teps [reaction nodes with oppositely
directed arrows, as in E qn (9a)]. Consequently, a Ôminus
autoinfluence pathÕ is negative (Ôeven cycleÕ) if t he number of
its negative s teps as shown in Eqn (9a) is even and positive
(Ôodd cycleÕ) if the number of its negative steps is odd.
A Ôminus combined autoinfluence path of order pÕ is
defined as a set of minus ÔcyclesÕ suchthat(a)eachofasetof
p species is involved precisely once in that set of cycles, a nd
(b) t he various cycles in this combination have n o reactions
or specie s in common (i.e. t he cycles in such a combination
do not touch each other). The value (the sign) of a cycle is
the product of the values (the signs) of its steps. The sign o f
the magnitude of a Ôminus combined autoinfluence path
of order pÕ equal those of the arithmetic product of its
Ó FEBS 2004 Graphical tool to identify oscillophores (Eur. J. Biochem. 271) 3879
component Ôminus cyclesÕ. Accordingly, the influence
(positive or negative) of a combined autoinfluence path
depends only on the number of its Ôeven cyclesÕ,havingan
even number of negative one-step influences (Eqn 9a) and
any number of positive one-step influences (Eqn 8). In other
words, if the number of Ôeven cyclesÕ in the combination is
even, this combination contributes to the coefficient of
characteristic equation a positive term. Thus, a single Ôeven
cycleÕ gives rise to a negative in the characteristic equation
(a positive autoinfluence). The absolute magnitude of a
combined autoinfluence path is the product of all the rates
divided by the product of all the concentrations of its
species. Therewith the c oefficient of o rder p of the
characteristic equation equals the sum of all simplest
combined Ôminus autoinfluence paths of order pÕ in the
network. That each coefficient of characteristic equation
therewith corresponds to a sum of minus paths in the
network, is the basis of the graphical analyses of the
characteristic equation and of t he method we develop here.
Inspection of Eqn 12 shows t hat in a ll coefficients a
p
the
term consisting of negative half-steps (Eqn 9c) only, which
corresponds to products of Jacobian elements b
ii
only, is
always positive: of the term of o rder p the sign is ( )1)
p
multiplied by ()1)
p
. I ndeed, a ll these terms always constitute
negative combined autoinfluence paths.
This graphical procedure allows us to determine all
coefficients of the characteristic polynomial for systems o f
simple reactions. The graphical determination of character-
istic polynomial co efficients for complex stoichiometries has
been elaborated by Ivanova [23].
The concentrations are restricted by balance constraints
(conserved sum concentrations, such as NADH + NAD)
and by the requirement that they be positive. These
restrictions define upper and lower limits for the values
the concentrations can assume (i.e. borders of the so-called
phase space). Any negative a
i
coefficient implies that the
system is unstable [22]. Such instability could lead t o infinite
growth (explosion) of some concentrations, unless the
highest-order coefficient a
m
is or becomes (the reference
state m ay shift) positive. If the system does not have steady
states on its border, all phase trajectories lead inward.
Steady states on the border are readily identified ([21] a nd an
example below).
That a
m
be positive and a
i
(i<m)benegativeina
(unstable) steady state [25] (together with the border
conditions mentioned above [21]) i s what w e shall here call
the ÔoscillophoreticÕ condition, i.e. the condition for a stable
limit cycle around the unstable s teady-state point. All phase
trajectories (i.e. a ll time evolution o f the system through t he
space of the concentrations) should then approach a cyclic
trajectory m ore a nd more closely as time proceeds,
approaching that stable limit cycle either from the outside
or from the inside.
In this paper we focus on this aspect of instability. We
shall ask when the above instability condition, i.e. at least
one a
i
being negative, is met. We shall not consider the
condition that a
m
be positive. The formalism described in
the preceding paragraphs will help us find the g raphical
structures, i.e. ÔsubgraphsÕ (see below), in t he kinetic s cheme
that contribute t erms to the coefficients of the characteristic
polynomial of a predictable sign and that hence help
determine th e stability properties of t he system. The aim of
this paper is to identify ÔnegativeÕ subgraphs, because they
can induce instability; their positive combined autoinfluence
bestows them with oscillophoretic potential.
The instability condition that a
p
be negative for s ome
p < m translates to the c ondition that the positive
combined autoinfluence paths of order p should outweigh
the negative combined autoinfluence paths of that same
order. From this, an Ôinstability ruleÕ follows. This is stated
as ÔInstability is promoted (counteracted) by positive
autoinfluence paths.Õ This c onnotes with instability be ing
generated by positive feedback loops.
Subgraphs favoring instability
As mentioned above we d eal here with the formulation t hat
decomposes biochemical networks into truly elementary
reactions. A network then c onsists of a great many such
reactions (each represented as a black node in our reaction
equations), each of which connects a number of species
(represented as white nodes). The entire network may
become unstable when part of it w ould by itself be unstable.
Consequently it can be useful to identify parts of the larger
network that are unstable.
The g raphical representation o f a subnetwork with e qual
numbers of species a nd reactions is here called a subgraph.
It is useful to consider subgraphs because all combined
autoinfluence paths that visit a ll reactions and species within
such a subgraph have equal absolute magnitudes (i.e. the
product o f the rates divided by the products of all the species
concentrations) but may differ in sign. By considering all
such combined autoinfluence p aths of a subgraph together ,
one can therefore decide whether t he subnetwork as a whole
promotes or counteracts instability: one simply determines
whether more positive than negative combined a utoinflu-
ence paths occur in that s ubnetwork. We shall speak of a
negative s ubgraph in this case. We define the value of a
subgraph that contains p reactions and p concentrations, as
minus the sum of all its combined autoinfluence paths of
order p. Note therefore that negativity of a subgraph and
positivity of autoinfluence connote with instability.
We shall now determine t he signs and hence the stability
properties of a number of s ubgraphs. We shall do this first
for subnetworks that consist of a single reaction, then for
subnetworks of two reactions, then f or subnetworks of three
reactions. F inally we shall consider subnetworks of arbi-
trary size.
One-reaction subgraphs. For the elements b
ii,r,1
that
correspond to the reactions r in which x
i
drives its o wn
production (i.e. x
i
fi x
i
), there is both a negative half step
(because, as usual, x
i
stimulates its own removal; Eqn 9c)
and a positive l oop [becau se x
i
now also stimulates its own
production; compare Eqn (8) with i ¼ j ]. Adding these two,
Eqn (7) shows t hat they cancel each other:
Àa
1
3 b
ii;r;1
¼ðÀa
ir
a
ir
þ b
ir
a
ir
ÞÁ
v
r
x
i
¼ 0; ð13Þ
where the symbol ’ means ÔcontainsÕ. The value of zero is
obtained because a ll stoichiometric coefficients equal one (i.e.
the reaction x
i
fi x
i
cannot lead to a net increase in x
i
because of the restrictions we here impose on the stoichio-
metries; we can only have such a reaction produce a single
3880 B. N. Goldstein et al.(Eur. J. Biochem. 271) Ó FEBS 2004
molecule of x
i
). These reactions are thus without any i nflu-
ence, as the negative i nfluence is balanced by the positive one.
In terms of autoinfluence p aths, the former negative half-
step is one cycle with one negative o ne-step influence, hence
a negative autoinfluence and stabilizing, whilst t he latter
positive loop is one cycle with no negative one-step
influence, hence a positive autoinfluence and destabilizing
but of equal magnitude (because it belongs to the same
subgraph): the two cancel. Autocatalytic processes such as
x
i
fi 2x
i
are not described as single reactions in our
formalism, as stoichiometry b would exceed one.
What remains for a
1
is all the reactions that have x
i
as
the substrate and not as the product. Therefore, a
1
is
constructed only from the corresponding negative half-steps
with the values [compare Eqns (7) and (9c)]:
Àa
1
3 b
ii;2
¼Àa
ir
a
ir
Á
v
r
x
i
¼À
v
r
x
i
ð14Þ
This corresponds to a single cycle (from x
i
back onto itself)
with a single n egative i nfluence step, i.e. it is negative in
terms of autoinfluence and promotes stability.
The sum total f or one-reaction subgraphs is thereby
always positive (their total autoinfluence is negative).
Indeed, it follows from Eqns (12) and (14) that the
coefficient a
1
is always positive, favoring stability. We
conclude that one-reaction subgraphs cannot give rise to
instability. These need not be analyzed therefore for
deciding on the potential instability o f large networks.
Two-reactions subgraphs. We here consider examples of
subgraphs with two species and two reactions, such as the
branched cycle:
According to Eqns (12) and (7) this subgraph contributes
to minus the a
2
coefficient of the characteristic polynomial
the two terms o n the right-hand side of the following
equation:
Àa
2
¼Àb
ii
b
jj
þ b
ij
b
ji
ð15Þ
where
Àb
ii
b
jj
¼ÀðÀa
ir
a
ir
ÞÁ ðÀa
js
a
js
Þþa
js
b
js
ÀÁ
Á
v
r
v
s
x
i
x
j
¼Àða
ir
a
ir
a
js
a
js
À a
ir
a
ir
a
js
b
js
ÞÁ
v
r
v
s
x
i
x
j
¼ 0 ð16Þ
b
ij
b
ji
¼ða
js
b
is
ÞÁða
ir
b
jr
ÞÁ
v
r
v
s
x
i
x
j
¼
v
r
v
s
x
i
x
j
ð17Þ
In the first facto r of Eqn (16), which corresponds to the
direct self-influence t erm b
ii
, one recognizes the influence
that x
i
has on itself through its own d egradation v
r
(the path
of influence –a
ir
a
ir
). In the s econd factor of Eqn (16), which
corresponds to the direct influence of j on itself (b
jj
), one
recognizes the two direct influences x
j
has on itself, i.e. one
through its degradation (–a
js
a
js
) and a second influence
through its autocatalytic feedback (+a
js
b
js
) through the
same reaction, v
s
. The latter influences cancel each other,
again as all stoichiometries are equal to one.
The second phrasing of Eqn (16) corresponds to the sum
of two autoinfluence paths of order two. Both of these
contain t he negative half step of x
i
back onto itself which is
negative. O ne of th em multiplies w ith the negative half-step
of x
j
back on to itself and constitutes n egative a utoinfluence
(even number of cycles and even number o f negative
influences). The other multiplies w ith the positive loop of x
j
back onto itself through v
s
: two cycles with one negative
influence constituting a positive (destabilizing) autoinflu-
ence. These two autoinfluence paths of order two cancel
each other.
In Eqn (17) one re cognizes the influence that x
j
has o n x
i
(+a
js
b
is
) b ecause t he former is the substrate of the reaction
v
s
that produces the latter, as well as the a nalogous influence
x
i
has on x
j
(+a
ir
b
jr
). Together they constit ute the positiv e
influence that x
i
has on itself through the negative path
constituted by the sequel of reactions v
r
and v
s
. Equation
(17) corresponds to a single even cycle with two positive
influence steps, i.e. promoting positive autoinfluence a nd
hence instability. The net sign of the three autoinfluence
paths is )1+(+1)+(+1)¼ +1, i.e. Graph (3) contri-
butes the negative (instability) term [Eqn (17)] to a
2
.Graph
(3) is ne gative.
As Graph (3) will be part of a larger network, whether it
actually will be able to cause instability ( oscillations)
depends on whether the precise kinetic parameter values
make its p ositive a utoinfluence dominate t he negative
autoinfluence in the other s ubgraphs of order two of the
network. It m ay b e noted that the corresponding subgr aph
that lacks the loop, i.e. in which reaction s does not
reproduce its substrate x
j
, cannot be negative, and hence
cannot cause instability. Then only the negative autoinflu-
ence path of Eqn (16) remains, which then cancels the
positive autoinfluence of Eqn (17). Revolving around the
cycle then does not lead to an increase in the number of
molecules. Elementary reactions producing more types of
product than types of substrate are essential for the
occurrence of instability, due to the restriction s on
stoichiometries that d erive f rom ou r descent t o t he
molecular level.
Another branched cycle, Graph (4), having two bran-
ches, contributes to –a
2
the same positive, destabilizing term:
Graph 3.
Graph 4.
Ó FEBS 2004 Graphical tool to identify oscillophores (Eur. J. Biochem. 271) 3881
Negative Graphs (3) and (4) involve positive paths with
branching that can be interpreted as positive feedback
interactions (autocatalysis). They can also be interpreted as
product activation in some enzyme reactions, because a
reaction product here stimulates the same re action. Another
example of such positive paths of influence occurs in the
case of the antiport of two ligands by a protein molecule
through the membrane [24].
Three-reaction subgraphs. Inthesamewayweidentify
the negative ( instability generating) subgraphs with three
species and three reactions, by pointing out that they
have positive p aths of influence. We divide these g raphs
into two classes, i.e. those with positive influence steps
only, and those including an even number (two) of
negative s teps in the cycle. The former class is s hown in
Graph (5):
The latter c lass of graphs, involving two negative s teps in
the cycle with three s pecies and three reactions, i s presented
in Graph (6).
All of the subgraphs in G raphs (5) and (6) contribute the
following 3! terms to the coefficient a
3
:
a
3
¼ðÀ1Þ
3
ðb
11
b
22
b
33
þ b
21
b
13
b
32
þ b
31
b
12
b
23
À b
11
b
23
b
32
À b
22
b
13
b
31
À b
33
b
12
b
21
Þ
The first term here corresponds to all h alf-steps multiplied,
the second and the third terms correspond to the circular
paths running through all three reactions and all three
species. The other three terms correspond each to a single
half-step, multiplied by a circular p ath running through two
reactions and two species.
Using the graphical rules mentioned above, we now
consider the left hand subgraph in Graph (6) as an example.
This subgraph contains the following three simplest com-
bined autoinfluence paths (simplest subgraphs):
1. One combined autoinfluence p ath is the positive c ycle
going through all three species and all three reactions,
from species one to species two to species three (corres-
ponding to b
12
b
23
b
31
). This one cycle i nvolves two
negative steps such as shown in Eqn (9a) and t hen a
positive step [as in Eqn (8)]. The rule then makes for odd
(number of cycles), even (number of steps), hence positive
combined autoinfluence: + 1. The second such auto-
influence path, i.e. the reverse of this cycle i s absent here.
2. A second combined autoinfluence path consists of one
cycle going through the two species and two reactions on
the l eft hand side of t he subgraph, and one n egative half
step on the right hand side (as i ndicated in bold;
b
12
b
32
b
33
). The arithmetic product of these two positive
autoinfluence paths is positive (once cycle, no negative
influences): +1. The mirror image combined autoinflu-
ence path (b
12
b
12
b
33
) would run through the two
reactions on the right hand side (negative), a nd one
negative half-step on the left (positive). However, the
latter would touch the cycle, hence this one does not
count. The third term, i.e. b
11
b
23
b
32
is also ÔemptyÕ for this
diagram.
3. The third type of combined autoinfluence is negative: a
combined influence of three separate anti half-steps: )1.
The sum of these t wo positive and one negative combined
autoinfluences contributes a negative term into the coeffi-
cient a
3
, and therewith promotes instability. The subgraph
on the left of Graph (6) is therewith negative.
In fact all of t he subgraphs in G raphs (5) a nd (6)
contribute the positive term
v
1
v
2
v
3
x
1
x
2
x
3
to minus the a
3
coefficient
of the characteristic polynomial (the negative term to the
coefficient a
3
), where subscripts 1, 2 and 3 refer to the
different sp ecies an d r eactions in the subgraph. C onsequently
they promote i nstability. All of these subgraphs are negative.
All subgraphs represented in Graphs (5) and (6) have a
single branched reaction, constituting two so-called Ôeven
cyclesÕ.AnÔeven c ycleÕ involves an even number (here 0 or 2 )
of equally directed influence steps and any number of positive
influence steps. Such cycles cause graphs to become negative.
In full reaction schemes some reactions start f rom species
in a n egative subgraph. These efflux reactions can eliminate
the negative subgraph, wh en the system r eaches its steady
state. In the steady sta te the equality of rates for internal and
external opposite reactions eliminates the negative term,
induced by the negative subgraph. Then only damped
oscillations can be observed (see below for examples). To
obtain sustained oscillations, the efflux reaction should be
reversible, leading, for example, to an inhibitory enzyme
complex (see below for an example). In the latter case the
reversible steady-state efflux equals zero and the negative
subgraph is upheld.
n-Reaction subgraphs. We can now formulate the proper-
ties of any negative subgraph t hat contains an arbitrary
equal number of species and reactions. Such a negative
graph should be constructed at least of two even cycles,
formed by a branched reaction. Moreover, species of the
negative subgraphs should not be connected with other
parts of the full scheme by outgoing irreversible reactions.
The outgoing i rreversible reactions cause t he correspond-
ing opposite stationary fluxes to be equal, canceling the
negative s ubgraph with a positive graph of th e same
absolute value (see b elow for a n example). Therefore,
only damped oscillations can be obtained in such a case.
Additional reversible reactions, leading through the
species of the n egative graph to dead-end species , do
not eliminate the negative graph.
Graph 5.
Graph 6.
3882 B. N. Goldstein et al.(Eur. J. Biochem. 271) Ó FEBS 2004
Examples of biochemical oscillations
Two interacting enzymes. Here we discuss one of the
simplest biochemical osc illators. Its kinetic scheme (Fig. 1)
contains a negative graph [Graph (4)] of second order (two
species and two reactions). This sug gests that the system of
Fig. 1 may oscillate. A more detailed analysis should then
be undertaken to determine whether it will actu ally oscillate.
We shall now do this.
In Fig. 1, two enzymes, E
1
and E
2
, modify each other
by releasing group P in the reactions E
2
-P fi P+E
2
and E
1
-P fi P+E
1
. The former reaction is catalyzed by
E
1
, the latter by E
2
. T he arrows indicate the p referential
reaction orientation. Various biochemical systems can be
recognized in Fig. 1, for example, mutual dephosphory-
lation (or phosphorylation) if P represents phosphate. P is
not considered to be a variable; it should be present in
excess.
The scheme in Fig. 1 is open for the fluxes through E
1
(e.g. synthesis, degradation) but the total concentration of
E
2
is conserved:
½E
2
-Pþ½E
2
¼E
2
or x
4
þ x
2
¼ 1 ð18Þ
The reaction participants and their normalized concentra-
tions x
i
(i.e. their concentrations divided by the total
concentrations of E
2
) are shown i n Fig. 1. The following
kinetic equations correspond to Fig. 1:
dx
1
dt
¼ k
2
x
2
x
3
À k
4
x
1
dx
2
dt
¼ k
1
x
1
x
4
À k
3
x
2
dx
3
dt
¼ k
5
À k
2
x
2
x
3
ð19Þ
Taking into account the constraint in Eqn (18), Eqns (19)
involve three independent variables, i.e. x
1
, x
2
, x
3
.
We shall now analyze the characteristic polynomial o f
the t hird order f or Eqns (19). We know that the
coefficient a
1
is always positive, and it is readily seen that
the coefficient a
3
is also positive h ere. The coefficient a
2
contains a negative t erm, which corresponds to the
negative graph highlighted in Fig. 1 by the heavy lines.
This negative term equals –v
1
v
2
/x
1
x
2
. At steady state v
2
¼
v
4
and v
1
¼ v
3
. Then the positive term +v
4
v
3
/x
1
x
2
,which
is also present in the coefficient a
2
for Fig. 1, cancels the
term –v
1
v
2
/x
1
x
2
of the negative graph. Therefore, in the
steady state a
2
is positive. Consequently, only damped
oscillations can be observed in Fig. 1.
Considering the structure of the reaction scheme in
Fig. 1, one recognizes that irreversible effluxes of species
of the negative graph must be present in order for the
steady state condition to be satisfied. For the same
reason, all the biochemical schemes involving a negative
graph of second order can only induce damped oscilla-
tions. Damped oscillations calculated for F ig. 1 are
shown i n F ig. 2.
Substrate inhibited bifunctional enzyme. Many kinetic
graphs that generate oscillations with only positive auto-
influence p aths are known from the literature. Some of them
have been classified [25]. A lthough the graphs with positive
paths implemented here e.g. Gra phs (3–5) are simpler t han
the kinetic graphs in [25], t hey can represent biochemical
reality. For example, t he second of the subgraphs in
Graph (5) has been used to analyze the network topological
basis for oscillatory antiport of t wo different ions across the
cell membrane [24].
Less studied are the graphs that include negative paths,
such as those in G raph (6). Two negative p aths in the c ycle
of subgraphs here reflect the competition of two r eactions
for a single species. For example, the competition of protein
X and the enzyme E
2
for the acetyl group in pyruvate
dehydrogenase c omplex has been shown to be important for
the prediction of o scillatory behavior [28].
The phenomenon of substrate inhibition is often associ-
ated with the potential for oscillations [33]. An earlier graph-
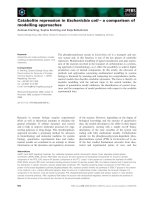
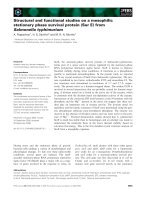
Fig. 2. Calculated time dependence of the normalized E
1
concentration
(X
1
) for Fig. 1. Time scale in relative units. The following parameter
values were used for these calculations: k
1
¼ 0.1, k
2
¼ 1, k
3
¼ 2.2, k
4
¼
5, k
5
¼ 1. The dimensions of these parameters values are not specified
because they depend on the time scale and can be d ifferent for different
actual systems. Species concentrations were normalized. The initial
values of the normalized concentratio ns were: x
1
(0) ¼ 1, x
2
(0) ¼ 0.4,
x
3
(0) ¼ 0.2, x
4
(0) ¼ 0.6. Calculations used the computer program
DBSOLVE
(created by I. I. Goryanin, Institute of Theoretical and
Experimental Bi ophysics, RAS, M oscow Region, Russia).
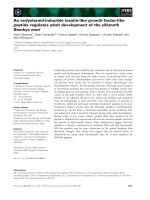
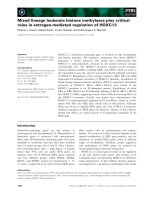
Fig. 1. Reaction scheme of two enzymes d emodify ing e ach other. Filled
circles represent reactions, open circles represent substances. T he rate
of the reaction t hat combines E
2
with P to yield E
2
-P is given as v
3
.IfP
represents a p hosphate group, reaction nu mbe r 3 could be a p rotein
kinase, and v
1
should t hen represent the dephosphorylation of E
2
-P, as
catalyzed by E
1
. This reaction re leases P a nd E
2
. In this reaction E
1
is
used but im mediately r eleased a s it i s a catalyst. The rate of reaction 2 i s
v
2
, which is catalyzed by E
2
(which then functions as a protein p hos-
phatase) and dephosphorylates E
1
-P. Reaction 4 d egrades E
1
. Reac-
tion 5 synthesizes E
1
-P de n ovo (i.e. not from E
1
).
Ó FEBS 2004 Graphical tool to identify oscillophores (Eur. J. Biochem. 271) 3883
theoretic analysis, however, [21] showed that some kinetic
schemes with substrate inhibition cannot induce sustained
oscillations. W e s hall here discuss a n e xample of subgraphs
with substrate inhibition, in the context of oscillations
observed f or phosphofructo-2-kinase:fructose-2,6-biphos-
phatase [21,27]. Nonlinear oscillations or bistable switches
in this bifunctional e nzyme could be highly important for a
switching mechanism between the opposing fluxes in
glycolysis/gluconeoge nesis. This case has been analyzed
before (e.g. in [21,27]), but this paper will now present the
detailed an alysis of conditions necessary for the negative
graph t o induce sustained oscillations. We shall analyze the
steady states, because the presence of steady states on the
phase-space border and the irreversible steady-state efflux
from the species of the negative g raph can eliminate
oscillations.
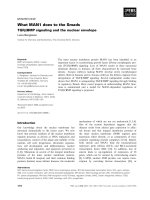
The following kinetic graph (compare [21,27]) is drawn to
illustrate the analysis of the steady states.
Graph (7) shows the substrate cycle, S
1
fi S
2
fi S
1
,as
catalyzed by the bifunctional enzyme (E
1
/E
2
;E
1
and E
2
are
two states of a single protein). H ere t he arrows between
symbols correspond to the preferential reaction orientation.
In reaction 1, E
1
catalyzes the f orward reaction S
1
fi S
2
and E
2
catalyzes reaction 2 , which runs in the opposite
direction, S
2
fi S
1
. Reaction 2 may be coupled to a s ource
of external free energy. Alternations between two enzyme
activities are caused by conformational transitions, i nduced
by the modifying enzymes, E
3
(catalyzing reaction 3) and
E
4
(E
4
is not shown in the scheme). The reaction S
1
fi S
2
is
merely catalyzed by E
1
alone, but during the reaction S
2
fi
S
1
the e nzyme undergoes cyclic conformational transitions
E
2
fi E
1
fi E
2
, where t he latte r transition is catalyzed by
E
3
. G raph (7) does not contain irreversible effluxes from
the s pecies (E
2
,E
3
and S
2
) of the negative graph that i s
shown b y h eavy ar rows, a nd contai ns only the influx to S
2
,
i.e. 1 fi S
2
(from reaction 1 to S
2
). Therefore it retains its
oscillophoretic potential. Inhibitory reversible reactions,
added to the negative graph, do not interfere with that
potential.
The subgraph highlighted by the heavy arrows in the
full Graph (7), is one of the negative g raphs identified
in this paper [i.e. the second left of the subgraphs in
Graph (6)]. This negative graph is the b ranched cycle
with one positive loop, represen ting the E
3
catalyzed
reaction tha t ma kes E
2
out of E
1
, and one longer cycle,
involving two negative i nfluence steps, E
3
fi 4 ‹ S
2
and
S
2
fi 2 ‹ E
2
. T hese two negative influence steps corres-
pond to the competitive interactions of S
2
with E
3
and
with E
2
. The reaction E
3
fi 4 ‹ S
2
is the forward
reaction for E
3
inhibition by S
2
. For simplicity, the
reverse reaction (not participating in the negative graph) is
not shown.
Oscillations can be expected if we add reversible inhibi-
tion of E
3
by substrate S
1
to Graph ( 7). The reversible
inhibitions of E
3
by both S
2
and S
1
do not eliminate the
negativity of the negative subgraph, because these reversible
steps d o not contribute additional terms to the terms of the
negative graph. Their contributed effluxes are eq ual to
influxes. However, t he number of s pecies of reactions
becomes larger with this new inhibition. Accordingly, a
positive graph with four species and four reactions, as well
as a negative graph with three species and three reactions,
are obtained in Graph (7). This is a sufficient condition for
oscillations to arise.
We shall now show how a necessary condition for
oscillations to occur follows from the absence of steady
states on the border of the phase space. The full s ystem
contains seven species variables:
x
1
¼½E
1
; x
2
¼½S
1
; x
3
¼½E
2
; x
4
¼½S
2
;
x
5
¼½E
3
; x
6
¼½E
3
S
2
; x
7
¼½E
3
S
1
These species are interdependent through the following
three balance constraints:
x
2
þ x
4
þ x
6
þ x
7
¼ S ¼ constant
x
1
þ x
3
¼ E ¼ constant ð20Þ
x
5
þ x
6
þ x
7
¼ E
0
¼ constant
These constraints reflect the conserved total concentra-
tions of the substrates (we shall use S ¼ 3.3 relative units) of
the b ifunctional e nzyme (E ¼ 0.2 relative units), and of the
modifying enzyme ( E¢ ¼ 0.31 relative units). The following
four equalities for the steady s tate reaction rates a re deduced
from the structure of Graph (7):
v
1
¼ v
2
¼ v
3
; v
4
¼ v
5
; v
6
¼ v
7
ð21Þ
where indices 1,2,3,… relate to various reactions, v
4
and v
5
relate to the reversible reaction E
3
+S
2
b « E
3
S
2
, v
6
and v
7
relate to the reversible reaction E
3
+S
1
b « E
3
S
1
.The
equalities [Eqn (21)] together with the constraints [Eqn (20)]
allow u s t o obtain all seven concentration values for one of
the steady states in the phase space [E
1
] ¼ 0, [S
2
] ¼ 0,
[E
3
S
2
] ¼ 0, [E
2
] ¼ E, and [S
1
], [E
3
], [E
3
S
1
] inside of the
phase space. No steady states exist on the borders of the
phase space. This is the necessary condition for sustained
oscillations to be observed in this s ystem.
The stability of the steady states was analyzed by using
four differential equations for four independent species
variables:
Graph 7.
3884 B. N. Goldstein et al.(Eur. J. Biochem. 271) Ó FEBS 2004
dx
1
dt
¼ k
2
x
3
x
4
À k
3
x
1
x
5
dx
2
dt
¼Àk
1
x
1
x
2
þ k
2
x
3
x
4
À k
6
x
2
x
5
þ k
7
x
7
dx
3
dt
¼ k
3
x
1
x
5
À k
2
x
3
x
4
dx
4
dt
¼ k
1
x
1
x
2
À k
2
x
3
x
4
À k
4
x
4
x
5
þ k
5
x
6
ð22Þ
In addition to referring to the a bsence of steady states on the
border of t he phase space, the procedure b y Clarke [22]
enables us to identify qualitatively phase trajectories that
lead to a stable limit c ycle. The c haracteristic polynomial o f
the system in Eqn (22) reads:
k
4
þ a
1
k
3
þ a
2
k
2
þ a
3
k þ a
4
¼ 0 ð23Þ
If in this polynomial a
4
> 0 for all concentration values
and a
3
< 0 in the unstable steady state, oscillations can be
obtained. Analysis of negative and positive subgraphs and
comparison of their values gives rise to the estimation of the
kinetic parameters t hat enable such oscillations. The main
result of such an analysis is that oscillations arise if t he
parameter k
3
is the l argest and the parameters k
6
and k
7
are
the smallest in the system. Oscillations in this system can
indeed be observed [27].
Discussion
Oscillatory phenomena in biochemical systems are be ing
studied more and more intensively. All known kinetic
models for calcium oscillations have been reviewed
recently [4]. Models for other oscillatory phenomena
continue to appear [33–39] and many more w ill appear in
the future with the increasing possibilities for inspecting
the d ynamics inside single c ells [40,41]. Our classification
of kinetic schemes (or ÔmotifsÕ [40]) into ones that may
and ones that cannot exhibit oscillations may be useful
for the analysis of th e existing models that are responsible
for the oscillations. Such an analysis may help to
understand the mechanisms underlying the oscillations,
and perhaps even suggest ways to influence the dynamics
of such systems. Our method is based on the molecular
mechanisms without any preliminary simplifications and
without using phenomenological equations. It may t here-
fore be suitable, especially now that functional genomics
is unraveling more and more of the molecular specifics
that underlie cell fun ction.
Our method to classify potential biochemical oscillators is
based on t he graphical analysis of t he kinetic schemes. Our
approach is similar in s ome aspects to the procedure
described previously [25,26]. However, the representation o f
the k inetic schemes i n terms of dual grap hs [ 21] is different,
and has enabled us t o simplify the identification a nd the
classification of oscillophoretic networks.
Because above we were most concerned with demon-
strating the basis of our method, we here summarize how
the approach may be implemented in the context of a
known reaction network. First the network kinetics
should b e drawn o ut i n a detailed molecular s cheme
making all molecular interactions, such as the binding of
a ligand to a n enzyme, exp licit. Then one should try to
recognize subgraphs of known s ign in that s cheme. Here
one may resort to the subgr aphs identified i n this p aper,
or to subgraphs that may appear i n future w ork
analyzing networks more extensively. Alternatively, one
may u se the method of making an inventory o f t he
autoinfluences within each subgraph and determine
whether there are more positive ones than negative ones,
in which case the subgraph is negative (unstable). Having
identified the (negative) subgraphs with oscillop horetic
potential, one may then analyze their effect quantitatively
and compare the results to those obtained for through
analysis of all other subgraphs of the same order in the
same network, as was illustrated for the two examples in
this paper. The network outside the former s ubgraph
may do away with the oscillophoretic potential of the
subgraph or maintain it by contributing subgraphs of
equal order but of different or equal sign and magnitude:
the dynamic development of a system is ultimately
dictated by the i nfluences the concentrations of its
substances have on each others (and their o wn) develop-
ment in time [7,35,42].
When systems are analyzed on a more coarse-grained
level than we do here, the influences are not defined in t erms
of rates, concentrations and reaction stoichiometries only.
In such analyses, other properties such as elasticity coeffi-
cients [31], Michaelis constants, and kinetic powers [29,30]
also determine the dynamics and s tability of the system [12].
To t he extent that these analyses deal with the origin of
dynamics in terms of n etwork topology, then that topology
is the topology of influences. This type of more coarse-
grained analysis is useful when the systems are not yet
understood to molecular kinetic detail, or when the systems
are so large that a detailed m olecular analysis is beyond
reach and modularization is required.
Because we here analyze at the level of complete
molecular detail (i.e. only reactions with zero and first order
kinetics), the topology of the influences coincides with the
topology of the network stoichiometries. Our method has
this as an important advantage, which comes w ith i ts ot her
advantage of b eing completely molecular. This very advant-
age can of course become a d isadvantage in cases where
molecular detail is not known or required. The d ynamics of
cellular systems are determined at many different levels of
the cellular control hierarchy. For different levels of the
hierarchy, different methods for the analysis of th e d ynam-
ics are needed.
We demonstrated how reaction networks that are
formulated down to the detail of simple unimolecular and
bimolecular reactions can be organized into topologies. The
latter can then be examined for their potential to induce
oscillations. Oscillophoretic topologies involve branched
directed cycles, c onstructed of a n even number of negative
paths a nd any number of positive paths. Our approach has
the advantage th at it considers positive and negative
interactions in a unified manner.
The implication o f the identification o f an oscillophoretic
subgraph is that if such a subgraph is found in a large
network, then that network may be unstable and give rise to
oscillations; the presenc e of an oscillophoretic subgraph is a
necessary condition for the network t o engage in t he
oscillations. However, i t is not a sufficient condition.
Ó FEBS 2004 Graphical tool to identify oscillophores (Eur. J. Biochem. 271) 3885
Whether the overall network actually engages in an
oscillation when an oscillophoretic subgraph is present
depends on the precise parameter values. To estimate the
parameter domain where oscillatory phenomena can be
observed, the numerical value of the negative graph should
be compared with the values of other graphs of the same
order in the system. In practice this means that to produce
oscillations, reactions involved in the negative graph should
be rapid enough a s compared with their surrou nding
reactions. We here p erformed such an analysis for two
examples, one with positive and one with negative inter-
actions.
We classified g raphs of different t opologies with two
species and two reactions as well as with three species and
three reactions, which can i nduce oscillations, if they are
connected with other parts of the system. Sustained
oscillations can be induced if these connections are
irreversible influxes or reversible dead-end reactions. All
considered topologies involved a single branched reaction.
More complicated topologies with additional reaction
branching do not eliminate o scillations. Graphs of similar
topologies but with different numbers of species and
reactions (the number o f species and r eactions in the
analyzed graphs is the same) retain the oscillophoretic
property.
On the basis of their network topologies, our approach
can predict a number of new biochemical oscillators that
fit the classification developed here, but were not included
in fo rmer classifications [25]. It turned out that not only
well-known substrate inhibition and product activation
induce oscillations. Any competition of a single, channeled
intermediate for multiple active sites in multienzyme com-
plexes can also induce osc illatory kinetics [28].
Our approach to Ôoscillophore topologiesÕ can b e com-
bined with other known theoretical approaches [29–32] to
simplify the study of complex b iochemical systems. It
contributes to the recognition t hat biochemical networks are
more subtle than hitherto realized. Not only the control of
flux but also the control of the occurrence o f oscillations is a
subtle function of network topology and (in the more
coarse-grained approaches) enzyme elasticitie s. There may
not be a single oscillophore, but rather a number of
component properties that contribute to the tendency of a
system to engage in more complex behavior such as limit-
cycle oscillations. Actual and subtle interactions of the
components then determine whe ther or not the oscillations
actually occur.
Acknowledgements
This work was supported by a grant from Ministry of Science and
Technology of the Spanish Government (SAF 2002–02785), INTAS
grant (97–1504), and the Netherlands’ Organization for Scientific
Research. We t hank T. Sukhomlin for disc ussions.
References
1. Betz, A. & Sel’kov, E. (1969) Control of phosphofructokinase
(PFK) activity in conditions simulating those of glycolysing yeast
extract. FEBS Lett. 3, 5–9.
2.Richard,P.,Bakker,B.M.,Teusink,B.,VanDam,K.&
Westerhoff, H.V. (1996) Acetaldehyde mediates the synchroni-
zation of sustained glycolytic oscillations i n p opulations of yeast
cells. Eur. J. Biochem. 235, 238–241.
3. Berridge, M.J., Bootman, M.D. & Lipp, P. (1998) Calcium – a life
and death signal. Nature 395, 645–648.
4. Schuster, S., Marhl, M. & Ho
¨
fer, T. (2002) Modeling of simple
and complex calcium oscillations. Eur. J. Biochem. 269, 1333–
1355.
5. Nurse, P. (2001) The cell cycle and development. Introduction.
Novartis Fou nd Symp 237, 1–2.
6. Heinrich, R., Rapoport, S.M. & Rapoport, T.A. (1977) Metabolic
regulation and mathematical models. Progr. Biophys. Mol. Biol.
32, 1–82.
7. Nicolis, G. & Prigogine, I. (1977) Self-Organization in Non-
equilibrium S ystems. John W iley & Sons, New York.
8. Wolf,J.,Passarge,J.,Somsen,O.J.,Snoep,J.L.,Heinrich,R.&
Westerhoff, H.V. (2000) Transduction of intrace llu lar and inter-
cellular dynamics in yeast glycolytic oscillations. Biophys. J. 78,
1145–1153.
9. Tyson, J.J. & Novak, B. (2001) Regulation of the eucaryotic cell
cycle: molecular antagonism, hysteresis, and irreversible transi-
tions. J. The or. Biol. 210, 249–263.
10. Goldbeter, A. (1990) Rythms et Chaos Dans les Syste
`
mes Bio-
chimiques et C ellulaires. Hasson, Paris.
11. Westerhoff, H.V. ( 2001) The silicon c ell, not dead b ut live! Metab.
Eng. 3, 207–210.
12. Kholodenko, B .N. (2000) Negative feed -back and ultrasensitivity
can bring about oscillations in the mitogen-activated protein
kinase cascades. Eur. J. Biochem. 267, 1583–1588.
13. Demin, O.V., Westerhoff, H.V. & Kholodenko, B.N. (1999)
Control analysis of stationary forced o scillations. J. Phys. Chem. B
103, 10695–10710.
14. Markus, M. & Hess, B. (1990) Control of metabolic oscillations:
unpredictability, critical slowing down, optimal stability, and
hysteresis. In Control of M etabolic Processes (Cornish-Bowden, A.
& Cardenas, M .L., eds.), pp. 303–313.
15. King, E.L. & Altman, C. (1956) A schematic method of deriving
the rate l aws for e nzyme-catalyzed reactions. J. Phys. Chem. 60,
1375–1378.
16. Hill, T.L. (1977) Fr ee Ene rgy Trans duction in Biology.Academic
Press, New Y ork.
17. Volkenstein, M.V. & Goldstein, B.N. (1966) A new method for
solving the problems of stationary kinetics of enzymological
reactions. Biochim. Biophys. Acta 115, 471–477.
18. Volkenstein, M.V. & Goldstein, B.N. (1966) Allosteric enzyme
models and their an alysis by the theory of graphs. Bioc him. Bio-
phys. A cta. 115, 478 –485.
19. Goldstein, B.N. (1983) Analysis of cyclic enzyme reaction
schemes by graph – the oretic method. J. Theor. Biol. 103 , 247–
264.
20. Goldstein, B.N. & Shevelev, E. (1985) Stability of multienzyme
systems with feedback regulation: a graph theoretical approach.
J.Theor. Biol. 112, 493–503.
21. Goldstein, B.N. & Ivanova, A. (1987) Hormonal regulation
of 6-phosphofructo-2-kinase/fructose-2,6-biphosphatase: kinetic
model. FEBS Lett. 217, 212– 215.
22. Clarke, B.L. (1980) Stability of complex reaction networks. Adv.
Chem. Phys. 43 , 1–115.
23. Ivanova, A.N. (1979) Conditions for the unique steady state of
kinetic systems as connected with struc ture of the reaction
schemes. Kinetika i K ataliz (in R ussian) 20, 1 019–1028.
24. Goldstein, B.N., Holmuhamedov, E.L., Ivanova, A.N. & Fur-
man, G.A. (1987) Ionophore-induced osc illations in erythrocytes.
Mol. Biol. 21, 1 10–117.
25. Eiswirth, M., Freund, A. & Ross, J. (1991) Operational procedure
toward the classification of chemical oscillators. J. Phys. Chem. 95,
1294–1299.
3886 B. N. Goldstein et al.(Eur. J. Biochem. 271) Ó FEBS 2004
26. Eiswirth, M., Freund, A. & Ross, J. ( 1991) Operational procedure
toward the classification of chemical oscillators. Adv. Chem. Phys.
190, 127–150.
27. Goldstein, B.N. & Maevsky, A.A. (2002) Critical switch of the
metabolic fluxe s by phospho-fructo-2-kinase: fruc tose- 2,6-
bisphosphatase. A kinetic m odel. FEBS Lett. 532, 2 95–299.
28. Selivanov, V.A., Zakrzhevskaya, D.T. & Goldstein, B.N. (1994)
Activity oscillations predicted for pyruvate dehydrogenase
complexes. FEBS Lett. 345, 151–153.
29. Savageau, M.A. (1969) Biochemical Systems Theory. J. Theor.
Biol. 25, 365–379.
30. Savageau, M.A., Voit, E.O. & Irvine, D.H. (1987) Biochemical
systems theory a nd metabolic control theory. Math. Biosci. 86,
147–169.
31. Kacser, H. & Burns, J.A. (1973) The control of flux. Symp Soc.
Exp. Biol. 27, 65–104.
32. Reder, Ch (1988) Metabolic control theory: a structural approach.
J. Theor. Biol. 135, 175–201.
33. McDonald, A.G. (2003) Implications of enzyme kinetics. Biochem.
Soc. Trans. 31, 719–722.
34. McDonald, M.J., Fahien, L.A., Buss, J.D., Hasan, N.M., Fallon,
M.J. & K endrick, M.A. (2003) Citrate o scillates in live r and
pancreatic beta cell mitochondria and in INS-1 insuloma cells.
J. Biol. Chem. 278, 51894–51900.
35. Aon, M.A., Cortassa, S ., Marban, E. & O’R ourke, B. (2003)
Synchronized whole cell oscillations in mitochondrial m etabolism
triggered by a local release of reactive oxygen species in cardial
myocytes. J. Biol. Chem. 278, 44735–44744.
36. Olsen, L.F., Hauser, M.J.B. & Kummer, U. (2003) Mechanism of
protection of peroxidase activity by oscillatory d ynamics. Eur. J.
Biochem. 27 0, 2796–2804.
37. Lloyd, D., Eshantha, L., Salgado, J., Turner, M.P. & Murray,
D.B. (2002) Respiratory oscillations in yeast: clock-driven
mitochondrial cycles of energization. FEBS Le tt. 519, 41–44.
38.Wolf,J.,Sohn,H.Y.,Heinrich,R.&Kuriyama,H.(2001)
Mathematical analysis of a mechanism for autonomous metabolic
oscillations in continuous of Saccharomyces cerevisiae. FEBS Lett.
499, 230–234.
39. Westermark, P.O. & Lansner, A. (2003) A model of phospho-
fructokinase and glycolytic oscillation s in the pancreatic cell.
Biophys. J . 85, 126–139.
40. Lahav, G., Rosenfeld, N., Sigal, A., Geva-Zatorsky, N., Levine,
A.J., Elowitz, M.B. & Alon, U. (2004) Dynamics of the p53-
Mdm2 feedback loop in individual cells. Nat. Genet. 36, 113–114.
41. Brady, N.R., Elmore, S.O., Van Beek, J.H.G.M., Krab, K.,
Courtoy, P.J., Hue, L. & Westerhoff, H.V. (2004) Coordinated
behavior of mitochondria in both space and time: a reactive
oxygen species-activated wave of mitochondrial depolarization.
Biophys. J . in press.
42. Westerhoff, H.V. & Van Dam, K. (1987) Thermodynamics
and Control of Biological Free Energy Transduction. Elsevier,
Amsterdam.
Ó FEBS 2004 Graphical tool to identify oscillophores (Eur. J. Biochem. 271) 3887