Tài liệu Functional Magnetic Resonance Imaging – Advanced Neuroimaging Applications Edited by Rakesh Sharma doc
Bạn đang xem bản rút gọn của tài liệu. Xem và tải ngay bản đầy đủ của tài liệu tại đây (7.28 MB, 224 trang )
FUNCTIONAL MAGNETIC
RESONANCE IMAGING –
ADVANCED
NEUROIMAGING
APPLICATIONS
Edited by Rakesh Sharma
Functional Magnetic Resonance Imaging – Advanced Neuroimaging Applications
Edited by Rakesh Sharma
Published by InTech
Janeza Trdine 9, 51000 Rijeka, Croatia
Copyright © 2012 InTech
All chapters are Open Access distributed under the Creative Commons Attribution 3.0
license, which allows users to download, copy and build upon published articles even for
commercial purposes, as long as the author and publisher are properly credited, which
ensures maximum dissemination and a wider impact of our publications. After this work
has been published by InTech, authors have the right to republish it, in whole or part, in
any publication of which they are the author, and to make other personal use of the
work. Any republication, referencing or personal use of the work must explicitly identify
the original source.
As for readers, this license allows users to download, copy and build upon published
chapters even for commercial purposes, as long as the author and publisher are properly
credited, which ensures maximum dissemination and a wider impact of our publications.
Notice
Statements and opinions expressed in the chapters are these of the individual contributors
and not necessarily those of the editors or publisher. No responsibility is accepted for the
accuracy of information contained in the published chapters. The publisher assumes no
responsibility for any damage or injury to persons or property arising out of the use of any
materials, instructions, methods or ideas contained in the book.
Publishing Process Manager Jana Sertic
Technical Editor Teodora Smiljanic
Cover Designer InTech Design Team
First published April, 2012
Printed in Croatia
A free online edition of this book is available at www.intechopen.com
Additional hard copies can be obtained from
Functional Magnetic Resonance Imaging – Advanced Neuroimaging Applications, Edited
by Rakesh Sharma
p. cm.
ISBN 978-953-51-0541-1
Contents
Preface IX
Section 1
Basic Concepts of fMRI
1
Chapter 1
Current Trends of fMRI in Vision Science:
A Review 3
Nasser H. Kashou
Chapter 2
Physiological Basis and Image Processing in
Functional Magnetic Resonance Imaging:
Neuronal and Motor Activity in Brain 29
Rakesh Sharma and Avdhesh Sharma
Section 2
fMRI Methods in Evaluation of Brain Functions
Chapter 3
fMRI Analysis of Three Concurrent Processing Pathways 83
Deborah Zelinsky
Chapter 4
Neural Correlates of Rule-Based
Perception and Production of Hand Gestures
Nobue Kanazawa, Masahiro Izumiyama,
Takashi Inoue, Takanori Kochiyama,
Toshio Inui and Hajime Mushiake
81
101
Chapter 5
Neural Cognitive Correlates of Orthographic Neighborhood
Size Effect for Children During Chinese Naming 121
Hong-Yan Bi and Qing-Lin Li
Chapter 6
Brain Plasticity Induced by
Constraint-Induced Movement Therapy:
Relationship of fMRI and Movement Characteristics
Urška Puh
Chapter 7
131
Reliability Maps in Event Related Functional MRI
Experiments 149
Aleksandr A. Simak, Michelle Liou, Alexander Yu. Zhigalov,
Jiun-Wei Liou and Phillip E. Cheng
VI
Contents
Chapter 8
Language Reorganization After Stroke:
Insights from fMRI 167
Vanja Kljajevic
Section 3
Multimodal Approaches
Chapter 9
The Brain Metabolites Within Cerebellum of Native
Chinese Speakers who are Using the Traditional
Logographic Reading and Writing Systems – A Magnetic
Resonance Spectroscopy Approach to Dyslexia 193
Ying-Fang Sun, Ralph Kirby and Chun-Wei Li
191
Preface
Functional Magnetic Resonance Imaging of brain is typically called fMRI. It has
become a fundamental modality of imaging at any MRI suite of service center or
hospital. Our book has been compiled with the aim of incorporating a wide range of
applied neuropsychological evaluation methods. It is aimed at those who are
embarking on neuropsychological research projects, as well as relatively experienced
psychologists and neuroscientists who might wish to further develop their
experiments. While it is not possible to detail every possible technique related to
functional evaluation of brain in activation by using fMRI, the book attempts to
provide working tips with examples and analysis to a wide range of the more
commonly available techniques.
The methods described in this book are aimed at giving the reader a glimpse of some
existing methods with the context in which each analytical fMRI method is applied, as
well as providing some basis of familiarizing oneself with these techniques. While
fMRI has been used in the study of cognition and neuroscience over the last two
decades, it was only in the later part of 20th century that it has become an integral part
of many psychological, behavioral and neuroscience research environments. This is, at
least in part, due to the continued development of new statistical analysis methods,
new fMRI hardware with scanning and monitoring accessories, better physiocompatible MRI suites, robust and fast acquisition techniques such as EPI-fMRI, GEfMRI, etc., thanks to the continued joint efforts of governmental, industrial and
academic institutions globally. Regardless of the MRI systems and the brands used,
one should always be able to understand and justify the use of the right imaging fMRI
protocol, designed for a specific study. With this aim, different approaches of fMRI
methods of neuropsychological evaluation are presented in separate chapters. For
learners, basic knowledge, safety issues, limitations and skepticism in fMRI data
analysis and interpretation is presented with a working fMRI protocol for
morphological MRI, MRSI data acquisition and analysis of neuronal dysfunction in
multiple sclerosis.
In chapter 1, the author emphasized the basic concepts of fMRI, the need for
quantitative calibration using gold standard, selection of correct paradigm, fMRI
parameters, accrued experience in study design including design type, Blocked, EventRelated stimulus or mixed events, number of subjects, data size for each subject,
X
Preface
stimulus conditions, and image acquisition parameters: repetitions for each condition,
applied stimulus, TR/TE, and Number of slices. In chapter 2, authors introduced the
physiological basis of neuroactivation in the brain during different motor-sensory
actions with technical aspects of BOLD signal generation and interpretation. Imaging
processing methods are discussed, with limitations and future prospects. fMRI
technique and applications are reviewed with several examples. In chapter 3, we can
read about the use of functional magnetic resonance imaging (fMRI) to obtain a
biomarker in motor processing pathways in order to indicate the relationship between
internal adaptation (influenced by conscious and non-conscious filtering and decisionmaking networks) and external environmental changes through the eye. The author
claims that the clinical applications of fMRI biomarkers could include assessments of
functional breakdowns in disease states, e.g., seizure disorders, memory deficits and
visuo-cognitive abilities in patients with Alzheimer’s disease, and eye movement
control and balance in patients with traumatic brain injuries or Parkinson’s disease. In
chapter 4, authors hypothesized the performance of the hand-gesture task under the
guidance of multiple rules for games such as rock–paper–scissors or null–two–five,
using a balanced rule-guided behavioral system with the mirror system to overcome a
covert and automatic tendency to imitate observed hand postures. Authors concluded
that two different brain regions, for perception and motor-sensory, act under the
guidance of behavioral rules in order to perform rule-guided behaviors and activities
in rule-selective brain regions. In chapter 5, authors explored the application of
Constraint-induced movement therapy in brain plasticity to evaluate the recovery
after stroke and identify the specific correlations between movement recovery clinical
endpoints and the fMRI data. Furthermore, the authors highlighted the needs such as
common methodology of analysis and reporting the fMRI data for better comparison
and interpretation of the results between studies, a comparison of different therapeutic
techniques on the brain cortex reorganization and upper extremity recovery, and the
establishment of optimal time for their application after stroke, with an aim to
understand the treatment programs. In chapter 6, authors presented the potential of
fMRI to evaluate the Reliability analysis required for the assessment of data to be
structured in similar events or replicates performing the same task in different days
under multiple experimental conditions. Authors emphasized the significance of
reliability maps in detection of local infringements and selection of ROIs, along with
temporal response functions into GLM for testing stimulus and task effects in the brain
for each individual patient. In chapter 7, authors emphasized the precise analysis of
different series in diagnosis and management of refractory SMA epilepsy in long-term
follow-up. Conceptually, surgical approaches of the fontal lobe (frontopolar, of the
convexity, central, orbitofrontal and SMA) must be considered separately and not as
one sole group. In chapter 8, the author emphasizes that brain supports language
processing via complex and sophisticated networks in Broca’s and Wernicke’s areas.
Furthermore, the author speculates with skepticism on the growing number of fMRI
studies on language in neurologically intact and injured brains to support relevant
linguistic generalizations and explore a better neural organization of language, postlesional neuroplasticity and recovery processes in support of rigorous investigations
Preface
on issues of linguistic computations, bilingual language functionality, non-dominant
hemisphere in brain. In chapter 9, authors reviewed the application of multimodal use
of fMRI combined with magnetic resonance spectroscopy (MRS) in dyslexia of brain.
Non-invasive technique was used to measure the neurochemicals distribution and Nacetylaspartate (NAA) and Choline (Cho) ratio within cerebellum to compare Western
vs. Eastern data. Chemical shift imaging and logographic writing, linguistics testing in
dyslexia demonstrated left vs. right cerebellar hemisphere differences. However, the
fMRI-MR spectroscopy multimodal approach is in infancy but has a high potential in
defining neuro disorders.
Functional MRI as imaging and evaluation modality
fMRI has become a very ‘fashionable’ technique and is often chosen as a research
method, rather than for its suitability to a particular research question or population.
Functional MRI serves as imaging and evaluation modality in basic sensory and
perceptual processing in cognition states such as vegetative state (VS) and minimal
conscious state (MCS). Wide applications of fMRI have been cited in useful auditory
signals from auditory complex in speech sound discrimination, signals from visual
cortex and tactile stimulation in a single vegetative conscious or severely injured
patient. From a functional anatomy standpoint, temporal, parietal and frontal gyri in
superior or inferior dimensions, occipital pole, and central sulcus regions in brain
clearly show distinct BOLD signal responses in task performance or use of
multisensory paradigm in neuroimaging. In the last decade, tremendous
advancements have been made in the applied science of fMRI, such as functional
connectivity, communication, emotion, familiarity, self-reference processing, conscious
awareness, and hippocampus regional differences in BOLD signals. Findings from
fMRI studies of cognition and consciousness all have one thing in common, but
enormous variability between subjects, even within the same diagnostic category. One
can wonder if this variability tells us anything about a patient’s likely outcome.
Clinically, it would be one of the most useful pieces of information fMRI could extract,
while most studies state prognosis as one of the main goals of fMRI research in disorders
of consciousness. In this direction, multimodal fMRI-PET, fMRI-MRS, fMRI-EEG, fMRIMEG have evolved for analysis of neurochemicals, oxygen rich regions, regional
electrophysiology etc. to classify the data from patients according to whether they
showed no activation; typical, low-level activation of primary sensory cortices; or higherlevel activation of associative cortices; atypical, higher-level associative cortex activation
to make decision on recovery of consciousness and other neuro dysfunctions.
Limit of resolution and detection by fMRI
fMRI has contributed immensely to our understanding of disorders of consciousness
and highlighted the need for brain-based tools to assess cognition and awareness in
patients in vegetative and minimally conscious states but is clearly not the most
practical solution to the problem by itself. Over the past few decades, improvements in
emergency and intensive care medicine have resulted in an increased number of
XI
XII
Preface
patients who survive severe brain injury. Some patients, unrecovered from coma, may
remain in a vegetative or minimally conscious state. The diagnosis of coma, locked-insyndrome and conscious state poses a challenge in accurate assessment of
consciousness by some verbal or behavioral sign. Functional MRI serves to
differentiate VS and MCS to generate verbal or motor responses by fMRI to indicate
sensory or perceptual impairments, motor impairments, and subclinical seizure
activity. However, fMRI does not allow inferring on patient’s level of awareness or
cognitive ability, but fMRI findings are crucial in the interpretation of data from
higher-order cognitive tasks, particularly negative findings. Assessment of cognition
function by fMRI BOLD activation patterns provides an opportunity to eliminate the
need of behavioral responses to cognitive tasks. However, there are many reasons to
fail to observe expected activations: a patient’s neuroanatomy may have been severely
altered and functional remapping may have occurred; a relevant sensory system (e.g.,
the auditory system for a speech recognition task) may have been damaged; the
coupling between neuronal firing and hemodynamic response may differ substantially
from that of healthy brains. Thus, proponents of fMRI argue that functional
neuroimaging assessments of cognition in patients with disorders of consciousness
should proceed in a hierarchical fashion, from basic sensory processing to high-level
cognition similar with EEG and evoked potentials were done over decades.
Major limitations in performing fMRI on patients with disorders of consciousness are
patient safety issues. Implanted devices such as neurostimulators, CSF shunts,
aneurysm clips, and bone flap fixation wires and clamps are of particular concern for
brain injury patients. Many of these devices have now been tested and deemed MRsafe at specific fields, but many are still contra-indicated or restricted. Some aneurysm
clips are ferromagnetic and may displace and cause serious injury or death. Some
shunt valves use magnetic components and exposure to the MRI’s magnetic field may
change the valve settings and lead to increase intracranial CSF pressure.
Neurostimulators may malfunction, overheat, or be displaced causing injury or death.
History of implanted devices and any other surgical hardware, patient background
regarding previous surgeries, implants, as well as possible embedded shrapnel or
bullets are some of the concerns. The Safety Committee of the Society for Magnetic
Resonance Imaging recommends that all patients who are unable to communicate
should be physiologically monitored. fMRI now becomes a more standard form of
evaluation in patients with disorders of consciousness in hospitals.
Choice of the fMRI protocol
Choice of fMRI method and task-paradigm chosen is a crucial issue. Once a patient has
passed through all the necessary safety screening steps, there are still many hurdles to
overcome in order to collect fMRI data from an unconsciousness patient. As a
researcher, one should consider whether the chosen MRI protocol is the most effective
and practical way to answer his/her research question. Since fMRI was introduced in
the early 90’s, it has had an immense impact on cognitive neuroscience research and its
use has grown exponentially. Once at the scanning facility, many difficulties may be
Preface
encountered in physical positioning of the patient in the scanner due to muscle
contractures or injuries that prevent them from performing a task after stimulus
delivery. fMRI studies in patients with disorders of consciousness are mostly
conducted in the auditory modality to circumvent difficulties with the delivery of
visual stimuli. However, auditory stimulation in the very noisy scanner environment
presents its own set of challenges. Without a doubt, the most problematic source of
artifact in patients is motion. Large, involuntary movements of the head or body are
common, and movement cannot be entirely prevented from occurring in the scanner.
Another source of artifact in brain-injured patients comes from devices implanted in
the head, such as aneurysm clips, shunts, and neurostimulators. Even when these
devices have been deemed non-ferromagnetic and completely MRI-safe, they are still
foreign, usually metallic objects with significantly different magnetic susceptibility
than the surrounding brain tissue. They can create significant artifacts, loss of signal,
and/or distortion of the image surrounding the object. Short-time event related tasks,
multi-sensory paradigms, and saccades are routinely used in prescribing fMRI
protocols. Echo planar EPI-fMRI and gradient-echo GE-fMRI are rapid acquisition
techniques. fMRI-DTI/PWI, fMRI-MPRAGE are variants in functional imaging. In
order for an assessment fMRI technique to be readily adopted into standard clinical
practice, it must be inexpensive, easily accessible, have few limitations in terms of
patient compatibility, and be relatively simple to administer (preferably at the
bedside). fMRI and patients with severe brain injuries can rarely or not at all combine
to meet these criteria. There are still many significant logistical and methodological
considerations that will in all likelihood prevent fMRI from becoming a part of routine
diagnostic assessments in standard clinical practice.
Image processing and interpretation
Several issues arise when analyzing both structural and functional MRI data from
patients with severe brain injuries. Most obvious is the issue of normalization. For
example, patients with traumatic injury may have abnormal or deformed brain
structures as a result of focal hemorrhages, hydrocephalus, shifting, craniotomy,
swelling, dilated ventricles, atrophy, etc. This complicates the co-registration of
functional data to anatomical data, as well as transformation into stereotaxic space
(e.g., Talairach space or MNI space) for comparisons between patients, or between
patients and controls. The heterogeneity of etiologies also complicates any betweensubjects comparisons. In my opinion, even if normalization can be performed, it must
be considered that, depending on the injury, a great deal of functional remapping
should have taken place, so that functional areas may no longer correspond to the
coordinates of the same functional areas in healthy controls or other patients. Better
software for image processing is now becoming available. For more details, see
Appendix 1 at the end of book.
BOLD signal is a measure of hemodynamic response, not a direct measure of neural
activity. Neurovascular coupling is the relationship between neural activity and the
hemodynamic response reflected by the BOLD signal. It is dependent on intact
XIII
XIV Preface
signaling between neurons and blood vessels, and on the various components of
vascular reactivity such as changes to metabolic or neurotransmitter signaling,
vascular tone, cerebral blood volume, blood flow, blood oxygenation, or oxygen
consumption (see chapter two). It is now established that many diseases and
pathologies, including brain injuries, alter neurovascular coupling and change the
BOLD signal without necessarily affecting the neuronal function. The good part is that
one can attribute changes in the BOLD signal to changes in neural activity if, and only
if, signaling and vascular reactivity are not altered; and one can compare between
groups (e.g., patients and controls) only if these properties are the same in both
groups. Therefore, utmost caution must be used when interpreting the BOLD signal in
brain-injured patients, and the potential confounds in the intermediate steps of
neurovascular coupling must be considered. Several types of analysis software is
available now. For more details, see Appendix 1 at the end of book.
A working example of growing science in fMRI of motor activity in multiple
sclerosis
Over the years, we focused on neurochemical changes in multiple sclerosis with casual
observations of reduction in functional activity in the ipsilateral sensorimotor cortex.
Activation changes in ipsilateral motor areas correlated inversely with age, extent and
progression of T1 lesion load, and occurrence of a new relapse in support of evolved
brain plastic changes. It is now established that functional changes in the brain may
not be correlated with slow tissue injury or neuro dysfunction appearing as lesions,
sometimes normal-appearing brain tissue. Longitudinal fMRI studies on motor
activity suggest cortical motor organization as dynamic changes evolved with time as
a clinical correlate.
An example of fMRI study design and protocol is presented here for interested
neuroscientists on morphological MRSI and fMRI data using a 1.5 T magnet with echo
planar capabilities and a head volume radio frequency coil. Each subject lay supine in
the scanner with eyes closed with minimum head movements on foam padding and a
restraining strap. Data acquisition conditions: 1. localizer protocol- multiplanar T1weighted localizer at slice orientation (parallel to the bi-commissural plane) and the
same brain volume acquisition (last slice tangent to the cortical mantle surface) as
standard for different fMRI sessions; 2. T2*-weighted echo planar imaging (64 • 64
matrix over a 24-cm field of view) to get 25 consecutive, 4-mm thick axial sections,
TR/TE (repetition time/echo time) = 3000/50 ms, a 90_ flip angle and one excitation in
total time of functional study = 225 s, to acquire total of 75 consecutive dynamics. 3.
Motor task paradigm during fMRI acquisition, when both patients and healthy
subjects perform a self-paced sequential finger opposition task (thumb repeatedly
touched the other four fingers in a sequential order with the right hand). Seven
periods of hand movement and seven periods of rest were alternated (each period
lasting for 15 s) as ‘start’ and ‘stop’ acoustic signals were given during the acquisition
under supervision by an operator who remains present to record the rate of hand
movements for both patients and controls.
Preface
fMRI data analysis is done by SPM99 software to realign, normalize and spatially
smoothen the images using a Gaussian kernel of 8 mm. Step-by-step method is
followed. First, analysis of the time series of functional MR image from each subject is
done to estimate the effects of experimental paradigm on a voxel-by-voxel basis using
the principles of the general linear model. Second, data modeling is used for a boxcar
design, convolved with the hemodynamic response function chosen to represent the
relationship between the neuronal activation and blood flow changes. Four contrast
images are generated in two steps: (I) task-related activation at fMRI1; (II) task-related
activation at fMRI2; (III) task-related activity increase between the two fMRI studies
(fMR1 < fMRI2); and (IV) task-related activity decrease between the two fMRI studies
(fMR1 > fMRI2). These contrast images are then used for a second-level random effect
analysis, according to a 2 × 2 design with time (fMR1 and fMRI2) and group (patients
and controls) as factors. Next step is the analysis of main effects, interactions and
simple main effects using subject specific contrasts as the response variable and one or
two sample t-tests, presuming that clusters of voxels (corrected P < 0.05) have a peak Z
score >3.7 to show significant changes.
Multiple regression analysis provides the extent of activations by clinical and
radiological variables up to 11 or more within group to look at the effects of age and
disease progression. Regression analysis calculates the correlation; for example,
clusters of voxels (corrected P < 0.05) with peak Z score >2.4 are significantly
correlated. Within each region of statistical significance, local maxima of signal
increase (the voxels of maximum significance) and their location can be expressed in
terms of x, y, and z coordinates, and those can be converted to the Talairach space
using linear transformation (www.mrc-cbu.cam.ac.uk/Imaging/mnispace.html).
Activations in the brain are seen as Talairach coordinates in different brain regions in
x-, y-, and z- directions of left (L) and right (right) lobes in L-sensorimotor cortex (BA
1–4), L-inferior parietal lobule (BA 40), L-lateral premotor cortex (BA 6), Lsupplementary motor area (BA 6), L-lentiform nucleus, L-thalamus, L-insula, Lcerebellum, R-sensorimotor cortex (BA 1–4), R- inferior parietal lobule (BA 40), Rlateral premotor cortex (BA 6), R-superior parietal cortex (BA 7), R-lentiform nucleus,
R-thalamus, R-insula, R-cerebellum and Vermis.
Morphological fMRI acquisition and morphological MRI protocols are commonly used
for proton density weighted PWI images (n=40 contiguous axial slices with 4-mm
thickness, 256 × 256 matrix and 24-cm field of view) and T2-weighted spin-echo
images (T2-WI) (TR = 2000 ms; TE = 20/90 ms), and T1-weighted spin-echo images (T1WI) (TR = 550 ms; TE = 12 ms) before and after injection of an intravenous bolus of 0.3
mmoles/kg gadolinium diethyltriamine penta-acetic acid (Gd-DTPA). For MRSI,
chemical shift imaging (CHESS) protocol at selective frequencies is prescribed,
covering the whole brain for water suppressed metabolite mapping and metabolite
ratio in two dimensions. For more details, readers are welcome to read chapters 2 and
10. By supervised automated segmentation, hyperintense T2 and hypointense T1
lesion loads (LL) can be calculated for each patient, using the display program MRIAP
or Dispunc (D.L. Plummer, University College London, London, UK) with a semi-
XV
XVI Preface
automated contouring technique. Various software is available for metabolite
mapping and neurochemical analysis, SID, APSIP, and NMR2. However, fMRIneurochemical imaging multimodal techniques are still in infancy.
Present state of art on fMRI and future prospects
Present concerns on fast, safe, robust inexpensive and reproducible fMRI do not mean
that fMRI is incapable of solving the problem of diagnosis in disorders of unconscious
patient with severe brain injury. On the contrary, Electroencephalography (EEG), for
instance, is widely available, inexpensive, easy to administer at the bedside, robust to
many artifacts that can cause fMRI data to be unusable (e.g., motion), and has virtually
no restrictions regarding the patient compatibility and safety. Combined with fMRI,
some of the data interpretation problems inherent in fMRI could be easily solved with
EEG. For instance, periods of low arousal or sleep are common and complicate the
interpretation of negative findings unless arousal can be closely monitored during
scanning. EEG, particularly event-related potentials (ERPs) have a long history in
cognitive neuroscience research and many well-established ‘signature’ patterns related
to specific cognitive processes, to an even greater extent than does the fMRI. The use of
ERPs with fMRI seems promising for assessment of cognition in non-communicative
patients. Extensive, engineering-oriented literature on the classification of mental
imagery for the purposes of brain-computer interfacing using EEG already exists, as a
shift away from fMRI towards the use of EEG and ERPs for detecting covert
awareness. MR spectroscopy is emerging as yet another chemical fMRI option in terms
of neurochemical imaging.
In hope of wider acceptance of fMRI as a major clinical modality for neuropsychological
analysis, this book is a concise text source to introduce the intricacies of fMRI, safety
issues, recent applications in evaluation of behavioral and neurological disorders
beginning with the basic science, to applications in noninvasive evaluation of
disabilities in learning, linguistics, and surgery. In the end, the appendix is a handful
resource for software useful in fMRI, MRI methods, presently available online. This
book will be useful to learners, neuroscientists, and researchers dedicated to
experimental fMRI applied in cognitive science.
Rakesh Sharma, PhD,
MS-PhD, ABR II
Professor (Nanotechnology)
Amity University,
India
Research Professor, Center of Nano-Biotechnology,
Florida State University, Tallahassee, FL
USA
Section 1
Basic Concepts of fMRI
1
Current Trends of fMRI
in Vision Science: A Review
Nasser H. Kashou
Department of Radiology, Children’s Radiological Institute,
Nationwide Children’s Hospital
Department of Radiology, Department of Ophthalmology,
The Ohio State University Medical Center
Department of Biomedical, Industrial and Human Factors Engineering,
Wright State University
USA
1. Introduction
Studying brain functional activities is an area that is experiencing rapid interest in the field
of neuroimaging. Functional magnetic resonance imaging (fMRI) has provided vision science
researchers a powerful and noninvasive tool to understand eye function and correlate it with
brain activities. In this chapter, we focus on the physiological aspects followed by a literature
review. More specifically, to motivate and appreciate the complexity of the visual system, we
will begin with a description of specific stages the visual pathway, beginning from the distal
stimulus and ending in the visual cortex. More importantly, the development of ascending
visual pathway will be discussed in order to help in understanding various disorders
associated with it such as monochromacy, albinism, amblyopia (refractive, strabismic). In
doing so we will divide the first half into two main sections, the visual pathway and the
development of the ascending pathway. The first of these sections will be mostly an anatomy
review and the latter will discuss the development of this anatomy with specific examples of
disorders as a result of abnormal development. We will then discuss fMRI studies with focus
on vision science applications. The remaining sections of this chapter will be highlighting
the work done on mainly oculomotor function, some perception and visual dysfunction with
fMRI and investigate the differences and similarities in their findings. We will then conclude
with a discussion on how this relates to neurologists, neuroscientists, ophthalmologists and
other specialists.
2. Background
To motivate the discussion we begin by asking, what is the problem in visual perception? This
will be answered briefly. In visual perception, we have both a distal and a proximal stimulus.
The distal stimulus is what the subject is looking at, usually at a distance. In the case of
vision, it determines the pattern of light arriving at the cornea. The proximal stimulus hits the
sense organs directly. In the case of vision, it is the pattern of light arriving at the retina, for
instance as a result of looking at the distal stimulus. There are several features that distinguish
4
2
Functional Magnetic Resonance Imaging – Advanced Neuroimaging Applications
Will-be-set-by-IN-TECH
the distal and proximal stimuli. The distal stimulus is 3-dimensional, independent of point
of view, upright, and has no lens blur or filter. An example of the latter two is that when
we look at a person their head is on top and their feet are on the bottom and the physical
person does not get blurred. The proximal on the other hand is 2-dimensional, depends
on point of view, inverted, blurred and filtered by the lens. So the main problem in visual
perception becomes clearer; that is to retrieve information about the distal stimulus with
only the proximal stimulus to work with. This is important because it affects the perceptual
representation which is the endpoint of the perceptual process. Perceptual representation is
the state of the visually-guided motor behavior (keeps us from bumping into things), visual
pattern recognition, visual understanding, and memory. Basically, as the subject sees an object
(distal stimulus), the input falls on the retina (proximal stimulus) and an output of the distal
stimulus is perceived via perceptual representations. Note, that this is not the same as the
distal stimulus, because there are two kinds of perception, veridical and illusory. There
are many examples of visual illusions, in which the perceptual representation suggests an
incorrect distal stimulus. That is, the apparent distal stimulus differs from the veridical distal
stimulus. With this concept, we can now refine the problem in visual perception, as trying to
understand how the visual system creates a perceptual representation of the distal stimulus
with only the proximal stimulus as an input. Why is this a problem? Because the relationship
of distal to proximal is not one to one, that is a distal stimulus can be seen as many proximal
stimuli and proximal stimuli can be many distal stimuli. This leads to the inverse problem
of trying to recover a visual representation from the input, even when many representations
are consistent with the proximal stimulus. Thus, this is a motivation to begin discussing the
visual pathway and understand the retinal (proximal) input to the brain.
3. Visual pathway
The visual pathway consists of many stages. We will focus on the ganglion cells, lateral
geniculate nucleus (LGN), and the primary visual cortex (V1). The ascending visual pathway
begins when light hits the back of the retina and stimulates the photoreceptors (rods and
cones). These photoreceptors transform radiant energy into electrical activity, which is
transmitted to retinal bipolar cells and then into retinal ganglion cells. The retina has several
layers and sub-layers with corresponding cells, such as ganglion, amacrine, bipolar and
horizontal. Each of these cells play a role in the visual system and have their own receptive
fields. Again, in this chapter we choose to focus and discuss the ganglion cells.
3.1 Ganglion cells
There are two major classes of ganglion cells. The smaller midget, or parvo, cells comprise
about 80 percent of these cells and the larger parasol, or magno, cells about 10 percent
(Lennie et al., 1990). As with other cells in the retina, these ganglion cells have their own
receptive fields known as center surround with either on-center (off-surround) or off-center
(on-surround). There are several differences between these two types of cells. Parvo cells are
dominant in the fovea as opposed to the magno cells, which are dominant in the periphery.
The parvo cells are also characterized as having a sustained response while the magno have
a transient response (Purpura et al., 1990; Schiller & Malpeli, 1978). At any given eccentricity,
parvo cells have a higher spatial resolution, lower contrast sensitivity, slower conduction
velocity, and a more sustained response than do magno cells (Shapley et al., 1981). The parvo
cells have low contrast sensitivity and detect color and form, while the magno have high
Current Trends of fMRI in Vision Science: A Review
Science: A Review
Current Trends of FMRI in Vision
5
3
contrast sensitivity and detect motion. Parvo cells rarely respond well to luminance contrasts
below 10%, whereas magno cells often respond to stimuli with contrasts as low as 2% (Purpura
et al., 1988; Sclar et al., 1990; Shapley et al., 1981). In addition to these two, there are other types
of ganglion axons that exist; the more common of these are the konio cells which are small
bistratified cells (Kaas et al., 1978). They are common in the parafovea, have low contrast
sensitivity, and detect color. The major difference between the konio cells and the other two
is that the konio have a uniform receptive field and thus have no spatial opponency. To many
investigators the term konio has become synonymous with the blue-yellow pathway, just as
parvo is now equated, too simplistically, with the red-green pathway (Sincich & Horton, 2005).
But this is not always the case because, konio cells constitute a heterogeneous population of
cells, some lacking blue-yellow color opponency (Hendry & Reid, 2000). The axons of all these
ganglion cells exit the eye, forming the optic nerve and synapse in the midbrain. Since the
diameter of the optic nerve and the number of the ganglion cell axons it contains are limited
by the structure of the skull, not all the information that falls upon the retina is transmitted to
the brain proper (Schwartz, 2004). Although there are more than 100 million photoreceptors
within the retina, there are only 1 million ganglion cells, revealing an extensive degree of
neural convergence (Curcio & Allen, 1990; Osterberg, 1935). At the optic chiasm, ganglion cell
fibers from the nasal retina of each eye cross over to join the temporal fibers of the fellow eye to
form the optic tract (Schwartz, 2004). The long axons of the retinal ganglion cells leave the eye,
form the second cranial nerve (the optic nerve), and synapse in the dorsal lateral geniculate
nucleus (dLGN), a midbrain structure (Schwartz, 2004). We will now discuss the LGN.
3.2 Lateral geniculate nucleus (LGN)
The primary target of the optic tract is the dorsal lateral geniculate nucleus (dLGN), a thalamic
nucleus. In higher vertebrates, such as carnivores and primates, axons from the two eyes
converge onto their primary target, the dorsal lateral geniculate nucleus (dLGN), but occupy
distinct regions (the eye-specific layers) within this target (Guillery, 1970; Kaas et al., 1972;
Linden et al., 1981). In primates (Rakic, 1976; 1977), the axonal terminals of ganglion cells of
the two eyes initially share common territories within the dLGN, but through a process that
eliminates inappropriately placed branches, projections from the two eyes become restricted
to their appropriate layer. Most, but not all, retinal ganglion cells synapse in the six-layered
structure. Layers 2, 3, and 5 receive input from the ipsilateral eye, whereas layers 1, 4,
and 6 receive input from the contralateral eye, Fig. 1. The dorsal four layers, which are
constituted of comparatively small neurons called parvo, or P-cells, are the parvocellular
layers (layers 3,4,5,6). Larger neurons, commonly called magno or M-cells, comprise the two
ventral magnocellular layers (layers 1,2). Axons from midget ganglion cells synapse on P-cells
in the dLGN to form the parvo pathway, while axons from the parasol cells synapse on dLGN
M-cells to form the magno pathway. The layers between the parvocellular and magnocellular
layers contain very small neurons (konio cells). Studies have shown that konio cells provide
the only direct geniculate input to layers 1-3 (Hendry & Yoshioka, 1994). The subcortical
projection from the retina to cerebral cortex is strongly dominated by the two pathways (M
and P pathways) the magnocellular and parvocellular subdivisions of the lateral geniculate
nucleus (Shapley & Perry, 1986). The parvo layers receive input from color-opponent midget
ganglion cells, whereas the magno layers are supplied by broadband parasol ganglion cells
(Perry et al., 1984). Parvo pathway neurons show color opponency of either the red/green or
blue/yellow type, which means that they respond to color change regardless of the relative
luminance of the colors (Derrington & Lennie, 1984). The blue-yellow ganglion cells project to
6
4
Functional Magnetic Resonance Imaging – Advanced Neuroimaging Applications
Will-be-set-by-IN-TECH
the konio layers just ventral to the third and fourth parvocellular layers (Calkins & Hendry,
1996). Layers 5 and 6 have on-center receptive fields, and layers 3 and 4 have off-center
receptive fields. Layers 1 and 2 have both on- and off- center receptive fields. These projections
from the retina to the LGN then lead to the visual cortex.
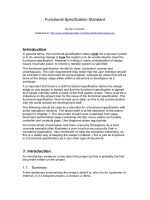
Fig. 1. Retinal ganglion cell projections to the lateral geniculate nucleus (LGN) of the
thalamus. Note that layers 1,4, and 6 of the LGN receive visual information from the
contralateral retina, whereas layers 2,3, and 5 receive visual information from the ipsilateral
retina.
3.3 Primary visual cortex (V1)
The cells of dLGN send most of their axons to the cerebral cortex, specifically, the primary
visual cortex (V1) along with the visual field representation in the retina and primary
cortex. Inputs to V1, which are stratified by magno, parvo, and konio, become thoroughly
intermingled by passage through the elaborate circuitry of V1 (Sincich & Horton, 2005). There
are about 8 or 9 layers in V1. Layer 4 consists of three sublayers, 4A, 4B, and 4C. Layer
4C also is subdivided into 4Cα, and 4Cβ. The projections from the LGN go specifically to
layer 4C and the information flows up and down from there (Merigan & Maunsell, 1993).
The projections from parvocellular layers terminate primarily in layers 4A and 4Cβ, whereas
those from magnocellular geniculate terminate in layer 4Cα (Fitzpatrick et al., 1985). Layer
4B receives direct input from 4Cα (M pathway), but not 4Cβ (P pathway) (Lund & Boothe,
1975; Lund et al., 1979). Layer 4Cβ projects to the blobs and interblobs (Horton & Hubel, 1981;
Humphrey & Hendrickson, 1980). The blobs also receive major inputs from the M pathway
by way of layers 4B and 4Cα (Blasdel et al., 1985; Fitzpatrick et al., 1985; Lachica et al., 1992;
Lund, 1988). Fig. 2 gives the details of these connections.
More recently, Yazar et al. (2004) have found that some geniculate fibers terminate in both
layers 4Cβ and 4A, implying either a direct parvo input to 4A or a konio input to 4Cβ. In layer
3B the cells in blobs and interblobs receive input from parvo (4Cβ), magno (4Cα), konio (4A),
or mixed (4B) layers, in a range of relative synaptic strengths (Sawatari & Callaway, 2000).
Cells in both 4Cα and 4Cβ project to layers 5 and 6 (Callaway & Wiser, 1996; Lund & Boothe,
1975). Feedback from layer 6 to the LGN is segregated only partially with respect to magno
Current Trends of fMRI in Vision Science: A Review
Science: A Review
Current Trends of FMRI in Vision
7
5
Fig. 2. Block diagram of ganglion cell mapping from retina through LGN, V1, and other
cortical areas.
and parvo, thus mixing the geniculate channels (Fitzpatrick et al., 1994). There are two main
types of cells in V1, stellate and pyramidal. The stellate cells are small interneurons found in
layers 2-6 and the pyramidal cells are large relay neurons found in layers 2, 3, 5, and 6. The
stellate cells are simple cells because of their receptive fields. The pyramidal cells are complex
cells. The simple cells’ receptive fields are of a certain size, are oriented in a certain way, and
are sensitive to phase. They increase their rate of firing when stimulated in some places, and
reduce it when stimulated in other places. The simple cells respond to a single spot of light
and are additive and linear. The complex cells do not respond to a single spot of light, rather
they respond to edges and bars, and are not sensitive to spatial phase. Many of the complex
cells respond best to stimuli that move in one direction. So, if the stimulus is stationary, in
the opposite direction, or a spot of light then the complex cells’ receptive field will have no
response. The complex cells are non-additive and are non-linear. Both the simple and complex
cells respond to most proximal stimuli. All together, these cortical cells are tuned for spatial
frequency, position, and orientation. This distinction is important in designing visual stimuli
for fMRI studies to understand normal and abnormal visual function.
4. Development of the ascending pathway
We now describe how the visual pathway develops and the effects of abnormal
development. During development anatomical projection patterns are restructured and
functional reorganization takes place (Campbell & Shatz, 1992; Hubel & Wiesel, 1977; Shatz
& Kirkwood, 1984; Wiesel, 1982). There are at least two ways by which neurons can be
wired up accurately: connections may be specified from the outset, or synapse formation may
initially follow an approximate wiring diagram, with precision achieved by the elimination of
inappropriate inputs and the stabilization and growth of appropriate connections (Goodman
& Shatz, 1993; Purves & Lichtman, 1985). The ganglion cells, LGN, and V1 are all wired up
in a "retinotopic" fashion; meaning that the order of points on the retina (proximal stimulus)
are preserved. In this mapping, the points that are further away from each other on the retina
will be further away on the brain. It is easy to see that the proximal image is retinotopically
related to the distal stimulus, simply because of the optics of the eye. However the retinotopic
mapping from the retina to the LGN and from the LGN to V1 is harder to appreciate. Studies
of patients with localized cortical damage showed that the receptive fields of neurons within
area V1 are retinotopically organized (Holmes, 1918; 1944; Horton & Hoyt, 1991). As a matter
of fact, the development of the retinotopic map is a general process for the central nervous
system. Cell bodies are born early in embryogenisis; axons and dendrites come later. The
nerve growth is then guided mechanically, probably by glial cells, to their overall destination.
The patterns of activity of the neurons themselves determine the exact position of the synapses
that are formed. Ganglion cells travel up the concentration gradient to the LGN. Target cells
send guiding chemical messages, giving crude directions to the cells’ overall destination by