Tài liệu Plant physiology - Chapter 6 Solute Transport pdf
Bạn đang xem bản rút gọn của tài liệu. Xem và tải ngay bản đầy đủ của tài liệu tại đây (817.61 KB, 22 trang )
Solute Transport
6
Chapter
PLANT CELLS ARE SEPARATED from their environment by a plasma
membrane that is only two lipid molecules thick. This thin layer sepa-
rates a relatively constant internal environment from highly variable
external surroundings. In addition to forming a hydrophobic barrier to
diffusion, the membrane must facilitate and continuously regulate the
inward and outward traffic of selected molecules and ions as the cell
takes up nutrients, exports wastes, and regulates its turgor pressure. The
same is true of the internal membranes that separate the various com-
partments within each cell.
As the cell’s only contact with its surroundings, the plasma mem-
brane must also relay information about its physical environment, about
molecular signals from other cells, and about the presence of invading
pathogens. Often these signal transduction processes are mediated by
changes in ion fluxes across the membrane.
Molecular and ionic movement from one location to another is known
as transport. Local transport of solutes into or within cells is regulated
mainly by membranes. Larger-scale transport between plant and envi-
ronment, or between leaves and roots, is also controlled by membrane
transport at the cellular level. For example, the transport of sucrose from
leaf to root through the phloem, referred to as translocation, is driven and
regulated by membrane transport into the phloem cells of the leaf, and
from the phloem to the storage cells of the root (see Chapter 10).
In this chapter we will consider first the physical and chemical prin-
ciples that govern the movements of molecules in solution. Then we will
show how these principles apply to membranes and to biological sys-
tems. We will also discuss the molecular mechanisms of transport in liv-
ing cells and the great variety of membrane transport proteins that are
responsible for the particular transport properties of plant cells. Finally,
we will examine the pathway that ions take when they enter the root, as
well as the mechanism of xylem loading, the process whereby ions are
released into the vessel elements and tracheids of the stele.
PASSIVE AND ACTIVE TRANSPORT
According to Fick’s first law (see Equation 3.1), the move-
ment of molecules by diffusion always proceeds sponta-
neously, down a gradient of concentration or chemical
potential (see Chapter 2 on the web site), until equilibrium
is reached. The spontaneous “downhill” movement of mol-
ecules is termed passive transport. At equilibrium, no fur-
ther net movements of solute can occur without the appli-
cation of a driving force.
The movement of substances against or up a gradient
of chemical potential (e.g., to a higher concentration) is
termed active transport. It is not spontaneous, and it
requires that work be done on the system by the applica-
tion of cellular energy. One way (but not the only way) of
accomplishing this task is to couple transport to the hydrol-
ysis of ATP.
Recall from Chapter 3 that we can calculate the driving
force for diffusion, or, conversely, the energy input neces-
sary to move substances against a gradient, by measuring
the potential-energy gradient, which is often a simple func-
tion of the difference in concentration. Biological transport
can be driven by four major forces: concentration, hydro-
static pressure, gravity, and electric fields. (However, recall
from Chapter 3 that in biological systems, gravity seldom
contributes substantially to the force that drives transport.)
The chemical potential for any solute is defined as the
sum of the concentration, electric, and hydrostatic poten-
tials (and the chemical potential under standard condi-
tions):
Here m
~
j
is the chemical potential of the solute species j in
joules per mole (J mol
–1
), m
j
*
is its chemical potential under
standard conditions (a correction factor that will cancel out
in future equations and so can be ignored), R is the uni-
versal gas constant, T is the absolute temperature, and C
j
is
the concentration (more accurately the activity) of j.
The electrical term, z
j
FE, applies only to ions; z is the
electrostatic charge of the ion (+1 for monovalent cations,
–1 for monovalent anions, +2 for divalent cations, and so
on), F is Faraday’s constant (equivalent to the electric
charge on 1 mol of protons), and E is the overall electric
potential of the solution (with respect to ground). The final
term, V
–
j
P, expresses the contribution of the partial molal
volume of j (V
–
j
) and pressure (P) to the chemical potential
of j. (The partial molal volume of j is the change in volume
per mole of substance j added to the system, for an infini-
tesimal addition.)
This final term, V
–
j
P, makes a much smaller contribution
to m
~
j
than do the concentration and electrical terms, except
in the very important case of osmotic water movements. As
discussed in Chapter 3, the chemical potential of water (i.e.,
the water potential) depends on the concentration of dis-
solved solutes and the hydrostatic pressure on the system.
The importance of the concept of chemical potential is that it
sums all the forces that may act on a molecule to drive net trans-
port (Nobel 1991).
In general, diffusion (or passive transport) always
moves molecules from areas of higher chemical potential
downhill to areas of lower chemical potential. Movement
against a chemical-potential gradient is indicative of active
transport (Figure 6.1).
If we take the diffusion of sucrose across a permeable
membrane as an example, we can accurately approximate
the chemical potential of sucrose in any compartment by
the concentration term alone (unless a solution is very con-
centrated, causing hydrostatic pressure to build up). From
Equation 6.1, the chemical potential of sucrose inside a cell
can be described as follows (in the next three equations, the
subscript s stands for sucrose, and the superscripts i and
o stand for inside and outside, respectively):
The chemical potential of sucrose outside the cell is calcu-
lated as follows:
m
~
s
o
= m
s
*
+ RT ln C
s
o
(6.3)
We can calculate the difference in the chemical potential
of sucrose between the solutions inside and outside the cell,
∆m
~
s
, regardless of the mechanism of transport. To get the
signs right, remember that for inward transport, sucrose is
being removed (–) from outside the cell and added (+) to
the inside, so the change in free energy in joules per mole
of sucrose transported will be as follows:
(6.4)
Substituting the terms from Equations 6.2 and 6.3 into
Equation 6.4, we get the following:
∆
˜
ln ln
mm m
s
s
*
s
i
s
*
s
o
s
i
s
o
s
i
s
o
ln ln
ln
=+
(
)
−+
(
)
=−
(
)
=
RT C RT C
RT C C
RT
C
C
∆
σσ
ι
σ
ο
˜˜˜
mm m=−
Chemical
potential
of sucrose
solution
inside the
cell
µ
s
i
~
Chemical
potential
of sucrose
solution
under
standard
conditions
Concentration
component
µ
s
*=+RT ln C
s
i
Chemical
potential
for a given
solute, j
µ
j
~
Chemical
potential
of j under
standard
conditions
Concentration
(activity)
component
µ
j
*=+RT ln C
j
Electric-
potential
component
+ z
j
FE
Hydrostatic-
pressure
component
+ V
j
P
–
88 Chapter 6
(6.1)
(6.2)
(6.5)
If this difference in chemical potential is negative, sucrose
could diffuse inward spontaneously (provided the mem-
brane had a finite permeability to sucrose; see the next sec-
tion). In other words, the driving force (∆m
~
s
) for solute dif-
fusion is related to the magnitude of the concentration
gradient (C
s
i
/C
s
o
).
If the solute carries an electric charge (as does the potas-
sium ion), the electrical component of the chemical poten-
tial must also be considered. Suppose the membrane is per-
meable to K
+
and Cl
–
rather than to sucrose. Because the
ionic species (K
+
and Cl
–
) diffuse independently, each has
its own chemical potential. Thus for inward K
+
diffusion,
(6.6)
Substituting the appropriate terms from Equation 6.1 into
Equation 6.6, we get
∆m
~
s
= (RT ln [K
+
]
i
+ zFE
i
) – (RT ln [K
+
]
o
+ zFE
o
) (6.7)
and because the electrostatic charge of K
+
is +1, z = +1 and
(6.8)
The magnitude and sign of this expression will indicate the
driving force for K
+
diffusion across the membrane, and its
direction. Asimilar expression can be written for Cl
–
(but
remember that for Cl
–
, z = –1).
Equation 6.8 shows that ions, such as K
+
, diffuse in re-
sponse to both their concentration gradients ([K
+
]
i
/[K
+
]
o
)
and any electric-potential difference between the two
compartments (E
i
– E
o
). One very important implication
of this equation is that ions can be driven passively
against their concentration gradients if an appropriate
voltage (electric field) is applied between the two com-
partments. Because of the importance of electric fields in
biological transport,
m
~
is often called the electrochemical
potential, and ∆
m
~
is the difference in electrochemical
potential between two compartments.
TRANSPORT OF IONS ACROSS A
MEMBRANE BARRIER
If the two KCl solutions in the previous example are sep-
arated by a biological membrane, diffusion is complicated
by the fact that the ions must move through the membrane
as well as across the open solutions. The extent to which
a membrane permits the movement of a substance is called
membrane permeability. As will be discussed later, per-
meability depends on the composition of the membrane, as
well as on the chemical nature of the solute. In a loose
sense, permeability can be expressed in terms of a diffusion
coefficient for the solute in the membrane. However, per-
meability is influenced by several additional factors, such
= + F(E
i
– E
o
)RT ln
[K
+
]
i
[K
+
]
o
∆µ
K
~
∆
ΚΚ
ι
Κ
ο
˜˜ ˜
mm m=−
Solute Transport 89
Chemical potential
in compartment A
Chemical potential
in compartment B
Description
Passive transport (diffusion) occurs
spontaneously down a chemical-
potential gradient.
Semipermeable
membrane
>
Active transport occurs against a
chemical potential gradient.
At equilibrium, . If there
is no active transport, steady
state occurs.
=
∆G per mole for movement of j from
A to B is equal to
– . For an
overall negative ∆G, the reaction
must be coupled to a process that has
a ∆G more negative than –( – ).
<
m
j
A
˜
m
j
A
˜
m
j
A
˜
m
j
B
˜
m
j
A
˜
m
j
A
˜
m
j
A
˜
m
j
B
˜
m
j
B
˜
m
j
B
˜
m
j
B
˜
m
j
B
˜
m
j
B
˜
m
j
B
˜
m
j
A
˜
m
j
A
˜
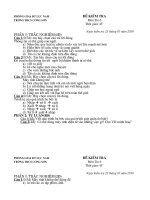
FIGURE 6.1 Relationship
between the chemical poten-
tial, m
~
, and the transport of
molecules across a permeabil-
ity barrier. The net movement
of molecular species j
between compartments A and
B depends on the relative
magnitude of the chemical
potential of j in each com-
partment, represented here
by the size of the boxes.
Movement down a chemical
gradient occurs sponta-
neously and is called passive
transport; movement against
or up a gradient requires
energy and is called active
transport.
as the ability of a substance to enter the membrane, that are
difficult to measure.
Despite its theoretical complexity, we can readily mea-
sure permeability by determining the rate at which a solute
passes through a membrane under a specific set of condi-
tions. Generally the membrane will hinder diffusion and
thus reduce the speed with which equilibrium is reached.
The permeability or resistance of the membrane itself, how-
ever, cannot alter the final equilibrium conditions. Equilib-
rium occurs when ∆m
~
j
= 0.
In the sections that follow we will discuss the factors
that influence the passive distribution of ions across a
membrane. These parameters can be used to predict the
relationship between the electrical gradient and the con-
centration gradient of an ion.
Diffusion Potentials Develop When Oppositely
Charged Ions Move across a Membrane at
Different Rates
When salts diffuse across a membrane, an electric mem-
brane potential (voltage) can develop. Consider the two
KCl solutions separated by a membrane in Figure 6.2. The
K
+
and Cl
–
ions will permeate the membrane indepen-
dently as they diffuse down their respective gradients of
electrochemical potential. And unless the membrane is
very porous, its permeability for the two ions will differ.
As a consequence of these different permeabilities, K
+
and Cl
–
initially will diffuse across the membrane at dif-
ferent rates. The result will be a slight separation of charge,
which instantly creates an electric potential across the
membrane. In biological systems, membranes are usually
more permeable to K
+
than to Cl
–
. Therefore, K
+
will dif-
fuse out of the cell (compartment A in Figure 6.2) faster
than Cl
–
, causing the cell to develop a negative electric
charge with respect to the medium. A potential that devel-
ops as a result of diffusion is called a diffusion potential.
An important principle that must always be kept in
mind when the movement of ions across membranes is
considered is the principle of electrical neutrality. Bulk
solutions always contain equal numbers of anions and
cations. The existence of a membrane potential implies that
the distribution of charges across the membrane is uneven;
however, the actual number of unbalanced ions is negligi-
ble in chemical terms. For example, a membrane potential
of –100 mV (millivolts), like that found across the plasma
membranes of many plant cells, results from the presence
of only one extra anion out of every 100,000 within the
cell—a concentration difference of only 0.001%!
As Figure 6.2 shows, all of these extra anions are found
immediately adjacent to the surface of the membrane; there
is no charge imbalance throughout the bulk of the cell. In
our example of KCl diffusion across a membrane, electri-
cal neutrality is preserved because as K
+
moves ahead of
Cl
–
in the membrane, the resulting diffusion potential
retards the movement of K
+
and speeds that of Cl
–
. Ulti-
mately, both ions diffuse at the same rate, but the diffusion
potential persists and can be measured. As the system
moves toward equilibrium and the concentration gradient
collapses, the diffusion potential also collapses.
The Nernst Equation Relates the Membrane
Potential to the Distribution of an Ion at
Equilibrium
Because the membrane is permeable to both K
+
and Cl
–
ions, equilibrium in the preceding example will not be
reached for either ion until the concentration gradients
decrease to zero. However, if the membrane were perme-
able to only K
+
, diffusion of K
+
would carry charges across
the membrane until the membrane potential balanced the
concentration gradient. Because a change in potential
requires very few ions, this balance would be reached
instantly. Transport would then be at equilibrium, even
though the concentration gradients were unchanged.
When the distribution of any solute across a membrane
reaches equilibrium, the passive flux, J (i.e., the amount of
solute crossing a unit area of membrane per unit time), is
the same in the two directions—outside to inside and
inside to outside:
J
o→i
= J
i→o
90 Chapter 6
Compartment A Compartment B
– +
Membrane K
+
Cl
–
Initial conditions:
[KCl]
A
> [KCl]
B
Equilibrium conditions:
[KCl]
A
= [KCl]
B
Diffusion potential exists
until chemical equilibrium
is reached.
At chemical equilibrium,
diffusion potential equals
zero.
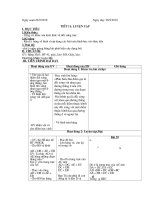
FIGURE 6.2 Development of a diffusion potential and a
charge separation between two compartments separated by
a membrane that is preferentially permeable to potassium.
If the concentration of potassium chloride is higher in com-
partment A ([KCl]
A
> [KCl]
B
), potassium and chloride ions
will diffuse at a higher rate into compartment B, and a dif-
fusion potential will be established. When membranes are
more permeable to potassium than to chloride, potassium
ions will diffuse faster than chloride ions, and charge sepa-
ration (+ and –) will develop.
Fluxes are related to ∆m
~
(for a discussion on fluxes and
∆m
~
, see Chapter 2 on the web site); thus at equilibrium,
the electrochemical potentials will be the same:
m
~
j
o
= m
~
j
i
and for any given ion (the ion is symbolized here by the
subscript j):
m
j
*
+ RT ln C
j
o
+ z
j
FE
o
= m
j
*
+ RT ln C
j
i
+ z
j
FE
i
(6.9)
By rearranging Equation 6.9, we can obtain the difference
in electric potential between the two compartments at equi-
librium (E
i
– E
o
):
This electric-potential difference is known as the Nernst
potential (∆E
j
) for that ion:
∆E
j
= E
i
– E
o
and
or
This relationship, known as the Nernst equation, states
that at equilibrium the difference in concentration of an ion
between two compartments is balanced by the voltage dif-
ference between the compartments. The Nernst equation
can be further simplified for a univalent cation at 25°C:
(6.11)
Note that a tenfold difference in concentration corresponds
to a Nernst potential of 59 mV (C
o
/C
i
= 10/1; log 10 = 1).
That is, a membrane potential of 59 mV would maintain a
tenfold concentration gradient of an ion that is transported
by passive diffusion. Similarly, if a tenfold concentration
gradient of an ion existed across the membrane, passive
diffusion of that ion down its concentration gradient (if it
were allowed to come to equilibrium) would result in a dif-
ference of 59 mV across the membrane.
All living cells exhibit a membrane potential that is due
to the asymmetric ion distribution between the inside and
outside of the cell. We can readily determine these mem-
brane potentials by inserting a microelectrode into the cell
and measuring the voltage difference between the inside of
the cell and the external bathing medium (Figure 6.3).
The Nernst equation can be used at any time to determine
whether a given ion is at equilibrium across a membrane.
However, a distinction must be made between equilibrium
and steady state. Steady state is the condition in which influx
and efflux of a given solute are equal and therefore the ion
concentrations are constant with respect to time. Steady state
is not the same as equilibrium (see Figure 6.1); in steady state,
the existence of active transport across the membrane pre-
vents many diffusive fluxes from ever reaching equilibrium.
The Nernst Equation Can Be Used to Distinguish
between Active and Passive Transport
Table 6.1 shows how the experimentally measured ion con-
centrations at steady state for pea root cells compare with
predicted values calculated from the Nernst equation (Hig-
inbotham et al. 1967). In this example, the external concen-
tration of each ion in the solution bathing the tissue, and
the measured membrane potential, were substituted into
the Nernst equation, and a predicted internal concentration
was calculated for that ion.
Notice that, of all the ions shown in Table 6.1, only K
+
is
at or near equilibrium. The anions NO
3
–
, Cl
–
, H
2
PO
4
–
, and
SO
4
2–
all have higher internal concentrations than pre-
dicted, indicating that their uptake is active. The cations
∆µς
ϕ
ϕ
ο
ϕ
ι
E
C
C
= 59 log
∆
ϕ
ϕ
ϕ
ο
ϕ
ι
E
RT
zF
C
C
=
23.
log
∆
ϕ
ϕ
ϕ
ο
ϕ
ι
E
RT
zF
C
C
=
ln
EE
RT
zF
C
C
io
j
j
o
j
i
−=
ln
Solute Transport 91
–
+
Voltmeter
Microelectrode
Conducting
nutrient
solution
Plant tissue
Ag/AgCl junctions to
permit reversible
electric current
Salt
solution
Glass
pipette
Cell wall
Plasma
membrane
seals to
glass
Open tip
(<1 mm
diameter)
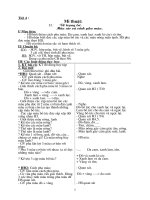
FIGURE 6.3 Diagram of a pair of microelectrodes used to
measure membrane potentials across cell membranes. One
of the glass micropipette electrodes is inserted into the cell
compartment under study (usually the vacuole or the cyto-
plasm), while the other is kept in an electrolytic solution
that serves as a reference. The microelectrodes are con-
nected to a voltmeter, which records the electric-potential
difference between the cell compartment and the solution.
Typical membrane potentials across plant cell membranes
range from –60 to –240 mV. The insert shows how electrical
contact with the interior of the cell is made through the
open tip of the glass micropipette, which contains an elec-
trically conducting salt solution.
Na
+
, Mg
2+
, and Ca
2+
have lower internal concentrations
than predicted; therefore, these ions enter the cell by diffu-
sion down their electrochemical-potential gradients and
then are actively exported.
The example shown in Table 6.1 is an oversimplification:
Plant cells have several internal compartments, each of
which can differ in its ionic composition. The cytosol and
the vacuole are the most important intracellular compart-
ments that determine the ionic relations of plant cells. In
mature plant cells, the central vacuole often occupies 90%
or more of the cell’s volume, and the cytosol is restricted to
a thin layer around the periphery of the cell.
Because of its small volume, the cytosol of most
angiosperm cells is difficult to assay chemically. For this rea-
son, much of the early work on the ionic relations of plants
focused on certain green algae, such as Chara and Nitella,
whose cells are several inches long and can contain an appre-
ciable volume of cytosol. Figure 6.4 diagrams the conclusions
from these studies and from related work with higher plants.
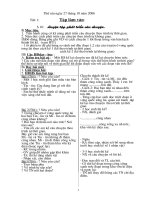
• Potassium is accumulated passively by both the
cytosol and the vacuole, except when extracellular K
+
concentrations are very low, in which case it is taken
up actively.
• Sodium is pumped actively out of the cytosol into the
extracellular spaces and vacuole.
• Excess protons, generated by intermediary metabo-
lism, are also actively extruded from the cytosol. This
process helps maintain the cytosolic pH near neutral-
ity, while the vacuole and the extracellular medium
are generally more acidic by one or two pH units.
• All the anions are taken up actively into the cytosol.
• Calcium is actively transported out of the cytosol at
both the cell membrane and the vacuolar membrane,
which is called the tonoplast (see Figure 6.4).
Many different ions permeate the
membranes of living cells simultane-
ously, but K
+
, Na
+
, and Cl
–
have the high-
est concentrations and largest permeabil-
ities in plant cells. A modified version of
the Nernst equation, the Goldman equa-
tion, includes all three of these ions and
therefore gives a more accurate value for
the diffusion potential in these cells. The
diffusion potential calculated from the
Goldman equation is termed the Goldman
diffusion potential (for a detailed discus-
sion of the Goldman equation,
seeWeb
Topic 6.1).
Proton Transport Is a Major
Determinant of the Membrane
Potential
When permeabilities and ion gradients are known, it is
possible to calculate a diffusion potential for the membrane
from the Goldman equation. In most cells, K
+
has both the
greatest internal concentration and the highest membrane
permeability, so the diffusion potential may approach E
K
,
the Nernst potential for K
+
.
In some organisms, or in tissues such as nerves, the nor-
mal resting potential of the cell may be close to E
K
. This is not
92 Chapter 6
TABLE 6.1
Comparison of observed and predicted ion concentrations in
pea root tissue
Concentration
in external
medium
Internal concentration (mmol L
–1
)
Ion (mmol L
–1
) Predicted Observed
K
+
174 75
Na
+
174 8
Mg
2+
0.25 1340 3
Ca
2+
1 5360 2
NO
3
–
2 0.0272 28
Cl
–
1 0.0136 7
H
2
PO
4
–
1 0.0136 21
SO
4
2–
0.25 0.00005 19
Source:Data from Higinbotham et al.1967.
Note:The membrane potential was measured as –110 mV.
Plasma membrane
Tonoplast
K
+
Na
+
H
+
K
+
K
+
Na
+
Na
+
Ca
2+
Ca
2+
Ca
2+
H
+
H
+
H
2
PO
4
–
H
2
PO
4
–
H
2
PO
4
–
NO
3
–
NO
3
–
NO
3
–
Cl
–
Cl
–
Cl
–
Vacuole
Cytosol
Cell wall
FIGURE 6.4 Ion concentrations in the cytosol and the vac-
uole are controlled by passive (dashed arrows) and active
(solid arrows) transport processes. In most plant cells the
vacuole occupies up to 90% of the cell’s volume and con-
tains the bulk of the cell solutes. Control of the ion concen-
trations in the cytosol is important for the regulation of
metabolic enzymes. The cell wall surrounding the plasma
membrane does not represent a permeability barrier and
hence is not a factor in solute transport.
the case with plants and fungi, which may show experimen-
tally measured membrane potentials (often –200 to –100 mV)
that are much more negative than those calculated from the
Goldman equation, which are usually only –80 to –50 mV.
Thus, in addition to the diffusion potential, the membrane
potential has a second component. The excess voltage is pro-
vided by the plasma membrane electrogenic H
+
-ATPase.
Whenever an ion moves into or out of a cell without
being balanced by countermovement of an ion of opposite
charge, a voltage is created across the membrane. Any
active transport mechanism that results in the movement
of a net electric charge will tend to move the membrane
potential away from the value predicted by the Goldman
equation. Such a transport mechanism is called an electro-
genic pump and is common in living cells.
The energy required for active transport is often pro-
vided by the hydrolysis of ATP. In plants we can study the
dependence of the membrane potential on ATP by observ-
ing the effect of cyanide (CN
–
) on the membrane potential
(Figure 6.5). Cyanide rapidly poisons the mitochondria,
and the cell’s ATP consequently becomes depleted. As ATP
synthesis is inhibited, the membrane potential falls to the
level of the Goldman diffusion potential, which, as dis-
cussed in the previous section, is due primarily to the pas-
sive movements of K
+
, Cl
–
, and Na
+
(seeWeb Topic 6.1).
Thus the membrane potentials of plant cells have two
components: a diffusion potential and a component result-
ing from electrogenic ion transport (transport that results
in the generation of a membrane potential) (Spanswick
1981). When cyanide inhibits electrogenic ion transport, the
pH of the external medium increases while the cytosol
becomes acidic because H
+
remains inside the cell. This is
one piece of evidence that it is the active transport of H
+
out of the cell that is electrogenic.
As discussed earlier, a change in the membrane poten-
tial caused by an electrogenic pump will change the driv-
ing forces for diffusion of all ions that cross the membrane.
For example, the outward transport of H
+
can create a driv-
ing force for the passive diffusion of K
+
into the cell. H
+
is
transported electrogenically across the plasma membrane
not only in plants but also in bacteria, algae, fungi, and
some animal cells, such as those of the kidney epithelia.
ATP synthesis in mitochondria and chloroplasts also
depends on a H
+
-ATPase. In these organelles, this transport
protein is sometimes called ATP synthase because it forms
ATP rather than hydrolyzing it (see Chapter 11). The struc-
ture and function of membrane proteins involved in active
and passive transport in plant cells will be discussed later.
MEMBRANE TRANSPORT PROCESSES
Artificial membranes made of pure phospholipids have
been used extensively to study membrane permeability.
When the permeability of artificial phospholipid bilayers
for ions and molecules is compared with that of biological
membranes, important similarities and differences become
evident (Figure 6.6).
Both biological and artificial membranes have similar
permeabilities for nonpolar molecules and many small
polar molecules. On the other hand, biological membranes
are much more permeable to ions and some large polar
molecules, such as sugars, than artificial bilayers are. The
reason is that, unlike artificial bilayers, biological mem-
branes contain transport proteins that facilitate the passage
of selected ions and other polar molecules.
Transport proteins exhibit specificity for the solutes they
transport, hence their great diversity in cells. The simple
prokaryote Haemophilus influenzae, the first organism for
which the complete genome was sequenced, has only 1743
genes, yet more than 200 of these genes (greater than 10%
of the genome) encode various proteins involved in mem-
NH
2
PO O
O
O
O
O
O P CH
2
–
P
O
O
O
–
–
O
–
H
OH
H
H
N
C
C
C
N
N
N
HC
OH
H
CH
Adenosine-5′-triphosphate (ATP
4–
)
Solute Transport 93
20
Time (minutes)
0 40 60 80
–50
–30
–70
–90
–110
–130
–150
Cell membrane potential (mV)
0.1 mM CN
–
added
CN
–
removed
FIGURE 6.5 The membrane potential of a pea cell collapses
when cyanide (CN
–
) is added to the bathing solution.
Cyanide blocks ATP production in the cells by poisoning
the mitochondria. The collapse of the membrane potential
upon addition of cyanide indicates that an ATP supply is
necessary for maintenance of the potential. Washing the
cyanide out of the tissue results in a slow recovery of ATP
production and restoration of the membrane potential.
(From Higinbotham et al. 1970.)
brane transport. In Arabidopsis, 849 genes, or 4.8% of all
genes,code for proteins involved in membrane transport.
Although a particular transport protein is usually highly
specific for the kinds of substances it will transport, its
specificity is not absolute: It generally also transports a
small family of related substances. For example, in plants a
K
+
transporter on the plasma membrane may transport Rb
+
and Na
+
in addition to K
+
, but K
+
is usually preferred. On
the other hand, the K
+
transporter is completely ineffective
in transporting anions such as Cl
–
or uncharged solutes
such as sucrose. Similarly, a protein involved in the trans-
port of neutral amino acids may move glycine, alanine, and
valine with equal ease but not accept aspartic acid or lysine.
In the next several pages we will consider the structures,
functions, and physiological roles of the various membrane
transporters found in plant cells, especially on the plasma
membrane and tonoplast. We begin with a discussion of
the role of certain transporters (channels and carriers) in
promoting the diffusion of solutes across membranes. We
then distinguish between primary and secondary active
transport, and we discuss the roles of the electrogenic H
+
-
ATPase and various symporters (proteins that transport
two substances in the same direction simultaneously) in
driving proton-coupled secondary active transport.
Channel Transporters Enhance Ion and Water
Diffusion across Membranes
Three types of membrane transporters enhance the move-
ment of solutes across membranes: channels, carriers, and
pumps (Figure 6.7). Channels are transmembrane proteins
94 Chapter 6
High
Low
Electrochemical
potential gradient
Transported molecule
Channel
protein
Carrier
protein
Pump
Plasma
membrane
Energy
Primary active transport
(against the direction
of electrochemical gradient)
Simple diffusion
Passive transport
(in the direction of
electrochemical gradient)
FIGURE 6.7 Three classes of membrane transport proteins: channels, carriers, and
pumps. Channels and carriers can mediate the passive transport of solutes across
membranes (by simple diffusion or facilitated diffusion), down the solute’s gradient
of electrochemical potential. Channel proteins act as membrane pores, and their
specificity is determined primarily by the biophysical properties of the channel.
Carrier proteins bind the transported molecule on one side of the membrane and
release it on the other side. Primary active transport is carried out by pumps and
uses energy directly, usually from ATP hydrolysis, to pump solutes against their
gradient of electrochemical potential.
FIGURE 6.6 Typical values for the permeability, P, of a bio-
logical membrane to various substances, compared with
those for an artificial phospholipid bilayer. For nonpolar
molecules such as O
2
and CO
2
, and for some small
uncharged molecules such as glycerol, P values are similar
in both systems. For ions and selected polar molecules,
including water, the permeability of biological membranes
is increased by one or more orders of magnitude, because
of the presence of transport proteins. Note the logarithmic
scale.
10
–10
10
–10
10
–8
10
–6
10
–4
10
–2
110
2
10
–8
10
–6
10
–4
10
–2
1
10
2
Permeability of lipid bilayer (cm s
–1
)
Permeability of biological membrane (cm s
–1
)
K
+
Na
+
Cl
–
H
2
O
CO
2
O
2
Glycerol
that function as selective pores, through which molecules
or ions can diffuse across the membrane. The size of a pore
and the density of surface charges on its interior lining
determine its transport specificity. Transport through chan-
nels is always passive, and because the specificity of trans-
port depends on pore size and electric charge more than on
selective binding, channel transport is limited mainly to
ions or water (Figure 6.8).
Transport through a channel may or may not involve
transient binding of the solute to the channel protein. In
any case, as long as the channel pore is open, solutes that
can penetrate the pore diffuse through it extremely rapidly:
about 10
8
ions per second through each channel protein.
Channels are not open all the time: Channel proteins have
structures called gates that open and close the pore in
response to external signals (see Figure 6.8B). Signals that
can open or close gates include voltage changes, hormone
binding, or light. For example, voltage-gated channels open
or close in response to changes in the membrane potential.
Individual ion channels can be studied in detail by the
technique of patch clamp electrophysiology (
seeWeb Topic
6.2), which can detect the electric current carried by ions
diffusing through a single channel. Patch clamp studies
reveal that, for a given ion, such as potassium, a given
membrane has a variety of different channels. These chan-
nels may open in different voltage ranges, or in response to
different signals, which may include K
+
or Ca
2+
concen-
trations, pH, protein kinases and phosphatases, and so on.
This specificity enables the transport of each ion to be fine-
tuned to the prevailing conditions. Thus the ion perme-
ability of a membrane is a variable that depends on the mix
of ion channels that are open at a particular time.
As we saw in the experiment of Table 6.1, the distribu-
tion of most ions is not close to equilibrium across the
membrane. Anion channels will always function to allow
anions to diffuse out of the cell, and other mechanisms are
needed for anion uptake. Similarly, calcium channels can
function only in the direction of calcium release into the
cytosol, and calcium must be expelled by active transport.
The exception is potassium, which can diffuse either
inward or outward, depending on whether the membrane
potential is more negative or more positive than E
K
, the
potassium equilibrium potential.
K
+
channels that open only at more negative potentials
are specialized for inward diffusion of K
+
and are known
as inward-rectifying, or simply inward, K
+
channels. Con-
versely, K
+
channels that open only at more positive poten-
tials are outward-rectifying, or outward, K
+
channels (see
Web Essay 6.1). Whereas inward K
+
channels function in
the accumulation of K
+
from the environment, or in the
opening of stomata, various outward K
+
channels function
in the closing of stomata, in the release of K
+
into the xylem
or in regulation of the membrane potential.
Carriers Bind and Transport Specific Substances
Unlike channels, carrier proteins do not have pores that
extend completely across the membrane. In transport
mediated by a carrier, the substance being transported is
Solute Transport 95
Plasma
membrane
OUTSIDE OF CELL
CYTOPLASM
S1 S2 S3 S4 S5 S6
+
+
+
+
+
Voltage-
sensing
region
Pore-forming
region (P-domain
or H5)
N
C
K
+
(A)
(B)
FIGURE 6.8 Models of K
+
channels in plants. (A) Top view of channel, looking through the pore of
the protein. Membrane-spanning helices of four subunits come together in an inverted teepee with
the pore at the center. The pore-forming regions of the four subunits dip into the membrane, with a
K
+
selectivity finger region formed at the outer (near) part of the pore (more details on the struc-
ture of this channel can be found in Web Essay 6.1). (B) Side view of the inward rectifying K
+
chan-
nel, showing a polypeptide chain of one subunit, with six membrane-spanning helices. The fourth
helix contains positively-charged amino acids and acts as a voltage-sensor. The pore-forming
region is a loop between helices 5 and 6. (Aafter Leng et al. 2002; B after Buchanan et al. 2000.)
initially bound to a specific site on the carrier protein. This
requirement for binding allows carriers to be highly selec-
tive for a particular substrate to be transported. Carriers
therefore specialize in the transport of specific organic
metabolites. Binding causes a conformational change in the
protein, which exposes the substance to the solution on the
other side of the membrane. Transport is complete when
the substance dissociates from the carrier’s binding site.
Because a conformational change in the protein is
required to transport individual molecules or ions, the rate
of transport by a carrier is many orders of magnitude
slower than through a channel. Typically, carriers may
transport 100 to 1000 ions or molecules per second, which
is about 10
6
times slower than transport through a channel.
The binding and release of a molecule at a specific site on
a protein that occur in carrier-mediated transport are sim-
ilar to the binding and release of molecules from an
enzyme in an enzyme-catalyzed reaction. As will be dis-
cussed later in the chapter, enzyme kinetics has been used
to characterize transport carrier proteins (for a detailed dis-
cussion on kinetics, see Chapter 2 on the web site).
Carrier-mediated transport (unlike transport through
channels) can be either passive or active, and it can transport
a much wider range of possible substrates. Passive transport
on a carrier is sometimes called facilitated diffusion,
although it resembles diffusion only in that it transports sub-
stances down their gradient of electrochemical potential,
without an additional input of energy. (This term might
seem more appropriately applied to transport through chan-
nels, but historically it has not been used in this way.)
Primary Active Transport Is Directly Coupled to
Metabolic or Light Energy
To carry out active transport, a carrier must couple the
uphill transport of the solute with another, energy-releas-
ing, event so that the overall free-energy change is negative.
Primary active transport is coupled directly to a source of
energy other than ∆m
~
j
, such as ATP hydrolysis, an oxida-
tion–reduction reaction (the electron transport chain of
mitochondria and chloroplasts), or the absorption of light
by the carrier protein (in halobacteria, bacteriorhodopsin).
The membrane proteins that carry out primary active
transport are called pumps (see Figure 6.7). Most pumps
transport ions, such as H
+
or Ca
2+
. However, as we will
see later in the chapter, pumps belonging to the “ATP-
binding cassette” family of transporters can carry large
organic molecules.
Ion pumps can be further characterized as either elec-
trogenic or electroneutral. In general, electrogenic trans-
port refers to ion transport involving the net movement of
charge across the membrane. In contrast, electroneutral
transport, as the name implies, involves no net movement
of charge. For example, the Na
+
/K
+
-ATPase of animal cells
pumps three Na
+
ions out for every two K
+
ions in, result-
ing in a net outward movement of one positive charge. The
Na
+
/K
+
-ATPase is therefore an electrogenic ion pump. In
contrast, the H
+
/K
+
-ATPase of the animal gastric mucosa
pumps one H
+
out of the cell for every one K
+
in, so there
is no net movement of charge across the membrane. There-
fore, the H
+
/K
+
-ATPase is an electroneutral pump.
In the plasma membranes of plants, fungi, and bacteria,
as well as in plant tonoplasts and other plant and animal
endomembranes, H
+
is the principal ion that is electro-
genically pumped across the membrane. The plasma mem-
brane H
+
-ATPase generates the gradient of electrochemi-
cal potentials of H
+
across the plasma membranes, while
the vacuolar H
+
-ATPase and the H
+
-pyrophosphatase
(H
+
-PPase) electrogenically pump protons into the lumen
of the vacuole and the Golgi cisternae.
In plant plasma membranes, the most prominent pumps
are for H
+
and Ca
2+
, and the direction of pumping is out-
ward. Therefore another mechanism is needed to drive the
active uptake of most mineral nutrients. The other impor-
tant way that solutes can be actively transported across a
membrane against their gradient of electrochemical poten-
tial is by coupling of the uphill transport of one solute to
the downhill transport of another. This type of carrier-
mediated cotransport is termed secondary active transport,
and it is driven indirectly by pumps.
Secondary Active Transport Uses the Energy
Stored in Electrochemical-Potential Gradients
Protons are extruded from the cytosol by electrogenic H
+
-
ATPases operating in the plasma membrane and at the vac-
uole membrane. Consequently, a membrane potential and
a pH gradient are created at the expense of ATP hydroly-
sis. This gradient of electrochemical potential for H
+
, ∆m
~
H
+
,
or (when expressed in other units) the proton motive force
(PMF), or ∆p, represents stored free energy in the form of
the H
+
gradient (seeWeb Topic 6.3).
The proton motive force generated by electrogenic H
+
transport is used in secondary active transport to drive the
transport of many other substances against their gradient
of electrochemical potentials. Figure 6.9 shows how sec-
ondary transport may involve the binding of a substrate (S)
and an ion (usually H
+
) to a carrier protein, and a confor-
mational change in that protein.
There are two types of secondary transport: symport
and antiport. The example shown in Figure 6.9 is called
symport (and the protein involved is called a symporter)
because the two substances are moving in the same direc-
tion through the membrane (see also Figure 6.10A).
Antiport (facilitated by a protein called an antiporter) refers
to coupled transport in which the downhill movement of
protons drives the active (uphill) transport of a solute in the
opposite direction (Figure 6.10B).
In both types of secondary transport, the ion or solute
being transported simultaneously with the protons is mov-
ing against its gradient of electrochemical potential, so its
transport is active. However, the energy driving this trans-
port is provided by the proton motive force rather than
directly by ATP hydrolysis.
96 Chapter 6
Solute Transport 97
High
Low
Electrochemical
potential
gradient
OUTSIDE OF CELL
CYTOPLASM
High
Low
Electrochemical
potential gradient
of substrate A
High
Low
Electrochemical
potential gradient
of substrate B
H
+
A
H
+
A
H
+
H
+
B
B
(A) Symport (B) Antiport
FIGURE 6.10 Two examples of secondary
active transport coupled to a primary pro-
ton gradient. (A) In a symport, the energy
dissipated by a proton moving back into
the cell is coupled to the uptake of one
molecule of a substrate (e.g., a sugar) into
the cell. (B) In an antiport, the energy dis-
sipated by a proton moving back into the
cell is coupled to the active transport of a
substrate (for example, a sodium ion) out
of the cell. In both cases, the substrate
under consideration is moving against its
gradient of electrochemical potential. Both
neutral and charged substrates can be
transported by such secondary active
transport processes.
Plasma
membrane
OUTSIDE OF CELL
CYTOPLASM
H
+
H
+
H
+
H
+
H
+
H
+
H
+
H
+
H
+
H
+
H
+
H
+
H
+
H
+
H
+
H
+
H
+
H
+
H
+
H
+
H
+
H
+
H
+
H
+
H
+
H
+
H
+
H
+
H
+
H
+
H
+
H
+
H
+
H
+
H
+
H
+
H
+
H
+
H
+
H
+
H
+
H
+
H
+
H
+
H
+
H
+
H
+
H
+
H
+
H
+
H
+
H
+
H
+
H
+
H
+
S
S
S
S
S
S
S
S
S
S
S S
S
S
S
S
S
S
S
S
S
S
S S
S
S
S
S
S
S
S
S
S
S S
S
S
S
S
S
S
S
S
S
S S
S
S
S
S
S
S
S
S
S
S
S
S
Concentration
gradients
for S and H
+
S
H
+
(A) (B) (C) (D)
FIGURE 6.9 Hypothetical model for secondary active transport. The energy that
drives the process has been stored in a ∆m
~
H
+
(symbolized by the red arrow on the
right in A) and is being used to take up a substrate (S) against its concentration gra-
dient (left-hand red arrow). (A) In the initial conformation, the binding sites on the
protein are exposed to the outside environment and can bind a proton. (B) This
binding results in a conformational change that permits a molecule of S to be
bound. (C) The binding of S causes another conformational change that exposes the
binding sites and their substrates to the inside of the cell. (D) Release of a proton
and a molecule of S to the cell’s interior restores the original conformation of the
carrier and allows a new pumping cycle to begin.
98 Chapter 6
Tonoplast
ADP + P
i
ADP + P
i
ADP + P
i
PP
i
2 P
i
IP
3
ATP
ATP
ATP
GS
VACUOLE
OUTSIDE OF CELL
CYTOSOL
H
+
H
+
H
+
H
+
H
+
,Na
+
K
+
H
+
H
+
H
+
Na
+
H
+
H
+
Na
+
H
+
H
+
H
+
H
+
H
+
2H
+
Mg
2+
Cd
2+
NO
3
–
PO
4
3–
Ca
2+
Ca
2+
3 H
+
Anthocyanin
PC-Cd
2+
Sucrose
Hexose
Slow vacuolar
(SV) channel
Fast vacuolar
(FV) channel
Channels
Channels
Antiporters
H
+
pumps
H
+
pumps
ABC
transporters
pH 7.2
∆E = –120 mV
ADP + P
i
ATP
ADP + P
i
ATP
ADP + P
i
ATP
Plasma
membrane
pH 5.5
Sucrose
Amino
acid
Efflux
carrier
Antiporter
Symporters
Sucrose
Ca
2+
Ca
2+
pump
ADP + P
i
ATP
K
+
K
+
Ca
2+
Cl
–
Inward
rectifying
Inward
rectifying
Outward
rectifying
Outward
rectifying
Anions,
cations
pH 5.5
∆E = –90 mV
Anions
(malate
2–
,
Cl
–
, NO
3
–
)
ABC
ABC
FIGURE 6.11 Overview of the various transport processes on the plasma
membrane and tonoplast of plant cells.
Typically, transport across a biological membrane is
energized by one primary active transport system coupled
to ATP hydrolysis. The transport of that ion—for example,
H
+
—generates an ion gradient and an electrochemical
potential. Many other ions or organic substrates can then
be transported by a variety of secondary active-transport
proteins, which energize the transport of their respective
substrates by simultaneously carrying one or two H
+
ions
down their energy gradient. Thus H
+
ions circulate across
the membrane,outward through the primary active trans-
port proteins, and back into the cell through the secondary
transport proteins. In plants and fungi, sugars and amino
acids are taken up by symport with protons.
Most of the ionic gradients across membranes of higher
plants are generated and maintained by electrochemical-
potential gradients of H
+
(Tazawa et al. 1987). In turn, these
H
+
gradients are generated by the electrogenic proton
pumps. Evidence suggests that in plants, Na
+
is trans-
ported out of the cell by a Na
+
–H
+
antiporter and that Cl
–
,
NO
3
–
, H
2
PO
4
–
, sucrose, amino acids, and other substances
enter the cell via specific proton symporters.
What about K
+
? At very low external concentrations, K
+
can be taken up by active symport proteins, but at higher
concentrations it can enter the cell by diffusion through spe-
cific K
+
channels. However, even influx through channels is
driven by the H
+
-ATPase, in the sense that K
+
diffusion is
driven by the membrane potential, which is maintained at
a value more negative than the K
+
equilibrium potential by
the action of the electrogenic H
+
pump. Conversely, K
+
efflux requires the membrane potential to be maintained at
a value more positive than E
K
, which can be achieved if
efflux of Cl
–
through Cl
–
channels is allowed. Several rep-
resentative transport processes located on the plasma mem-
brane and the tonoplast are illustrated in Figure 6.11.
MEMBRANE TRANSPORT PROTEINS
We have seen in preceding sections that some transmem-
brane proteins operate as channels for the controlled dif-
fusion of ions. Other membrane proteins act as carriers for
other substances (mostly molecules and ions). Active trans-
port utilizes carrier-type proteins that are energized directly
by ATP hydrolysis or indirectly as symporters and
antiporters. The latter systems use the energy of ion gradi-
ents (often a H
+
gradient) to drive the uphill transport of
another ion or molecule. In the pages that follow we will
examine in more detail the molecular properties, cellular
locations, and genetic manipulations of some of these
transport proteins.
Kinetic Analyses Can Elucidate Transport
Mechanisms
Thus far, we have described cellular transport in terms of
its energetics. However, cellular transport can also be stud-
ied by use of enzyme kinetics because transport involves
the binding and dissociation of molecules at active sites on
transport proteins. One advantage of the kinetic approach
is that it gives new insights into the regulation of transport.
In kinetic experiments the effects of external ion (or
other solute) concentrations on transport rates are mea-
sured. The kinetic characteristics of the transport rates can
then be used to distinguish between different transporters.
The maximum rate (V
max
) of carrier-mediated transport,
and often channel transport as well, cannot be exceeded,
regardless of the concentration of substrate (Figure 6.12).
V
max
is approached when the substrate-binding site on the
carrier is always occupied. The concentration of carrier, not
the concentration of solute, becomes rate limiting. Thus
V
max
is a measure of the number of molecules of the spe-
cific carrier protein that are functioning in the membrane.
The constant K
m
(which is numerically equal to the
solute concentration that yields half the maximal rate of
transport) tends to reflect the properties of the particular
binding site (for a detailed discussion on K
m
and V
max
see
Chapter 2 on the web site). Low K
m
values indicate high
affinity of the transport site for the transported substance.
Such values usually imply the operation of a carrier sys-
tem. Higher values of K
m
indicate a lower affinity of the
transport site for the solute. The affinity is often so low that
in practice V
max
is never reached. In such cases, kinetics
alone cannot distinguish between carriers and channels.
Usually transport displays both high-affinity and low-
affinity components when a wide range of solute concen-
trations are studied. Figure6.13 shows sucrose uptake by
soybean cotyledon protoplasts as a function of the external
Solute Transport 99
(K
m
)
1
/2 V
max
V
max
External concentration of
transported molecule
Rate
Simple
diffusion
Carrier
transport
FIGURE 6.12 Carrier transport often shows saturation
kinetics (V
max
) (see Chapter 2 on the web site), because of
saturation of a binding site. Ideally, diffusion through chan-
nels is directly proportional to the concentration of the
transported solute, or for an ion, to the difference in electro-
chemical potential across the membrane.
sucrose concentration (Lin et al. 1984). Uptake increases
sharply with concentration and begins to saturate at about
10 mM. At concentrations above 10 mM, uptake becomes
linear and nonsaturable. Inhibition of ATP synthesis with
metabolic poisons blocks the saturable component but not
the linear one. The interpretation is that sucrose uptake at
low concentrations is an active carrier-mediated process
(sucrose–H
+
symport). At higher concentrations, sucrose
enters the cells by diffusion down its concentration gradi-
ent and is therefore insensitive to metabolic poisons. How-
ever, additional information is needed to investigate
whether the nonsaturating component represents uptake
by a carrier with very low affinity, or by a channel. (Trans-
port by a carrier is more likely in the case of a molecular
solute such as sucrose.)
The Genes for Many Transporters Have Been
Cloned
Transporter gene identification, isolation, and cloning have
greatly aided in the elucidation of the molecular properties
of transporter proteins. Nitrate transport is an example that
is of interest not only because of its nutritional importance,
but also because of its complexity. Kinetic analysis shows
that nitrate transport, like the sucrose transport shown in
Figure 6.13, has both high-affinity (low K
m
) and low-affinity
(high K
m
) components. In contrast with sucrose, nitrate is
negatively charged, and such an electric charge imposes an
energy requirement for the transport of the nitrate ion at all
concentrations. The energy is provided by symport with H
+
.
Nitrate transport is also strongly regulated according to
nitrate availability: The enzymes required for nitrate trans-
port, as well as nitrate assimilation (see Chapter 12), are
induced in the presence of nitrate in the environment, and
uptake can also be repressed if nitrate accumulates in the
cells.
Mutants in nitrate transport or nitrate reduction can be
selected by growth in the presence of chlorate (ClO
3
–
).
Chlorate is a nitrate analog that is taken up and reduced in
wild-type plants to the toxic product chlorite. If plants
resistant to chlorate are selected, they are likely to show
mutations that block nitrate transport or reduction.
Several such mutations have been identified in Ara-
bidopsis, a small crucifer that is ideal for genetic studies. The
first transport gene identified in this way encodes a low-
affinity inducible nitrate–proton symporter. As more genes
for nitrate transport have been identified and character-
ized, the picture has become more complex. Each compo-
nent of transport may involve more than one gene product,
and at least one gene encodes a dual-affinity carrier that
contributes to both high-affinity and low-affinity transport
(Chrispeels et al. 1999).
The emerging picture of plant transporter genes shows
that a family of genes, rather than an individual gene,
exists in the plant genome for each transport function.
Within a gene family, variations in transport characteristics
such as K
m
, in mode of regulation, and in differential tissue
expression give plants a remarkable plasticity to acclimate
to a broad range of environmental conditions.
The identification of regions of sequence similarity
between plant transport genes and the transport genes of
other organisms, such as yeast, has enabled the cloning of
plant transport genes (Kochian 2000). In some cases, it has
been possible to identify the gene after purifying the trans-
port protein, but often sequence similarity is limited, and
individual transport proteins represent too small a fraction
of total protein. Another way to identify transport genes is
to screen plant cDNA(complementary DNA) libraries for
genes that complement (i.e., compensate for) transport defi-
ciencies in yeast. Many yeast transport mutants are known
and have been used to identify corresponding plant genes
by complementation.
In the case of genes for ion channels, researchers have
studied the behavior of the channel proteins by express-
ing the genes in oocytes of the toad Xenopus, which,
because of their large size, are convenient for electro-
physiological studies. Genes for both inward- and out-
ward-rectifying K
+
channels have been cloned and stud-
ied in this way. Of the inward K
+
channel genes identified
so far, one is expressed strongly in stomatal guard cells,
another in roots, and a third in leaves. These channels are
considered to be responsible for low-affinity K
+
uptake
into plant cells.
An outward K
+
channel responsible for K
+
flux from
root stelar cells into the dead xylem vessels has been
100 Chapter 6
0 1020304050
25
50
75
100
125
0
Sucrose concentration (mM)
Rate of sucrose uptake
(nmol per 10
6
cells per hour)
Predicted by
Michaelis–Menten kinetics
Observed
FIGURE 6.13 The transport properties of a solute can
change at different solute concentrations. For example, at
low concentrations (1 to 10 mM), the rate of uptake of
sucrose by soybean cells shows saturation kinetics typical
of carriers. A curve fit-ted to these data is predicted to
approach a maximal rate (V
max
) of 57 nmol per 10
6
cells per
hour. Instead, at higher sucrose concentrations the uptake
rate continues to increase linearly over a broad range of
concentrations, suggesting the existence of other sucrose
transporters, which might be carriers with very low affinity
for the substrate. (From Lin et al. 1984.)
cloned, and several genes for high-affinity K
+
carriers have
been identified. Further research is needed to determine to
what extent they each contribute to K
+
uptake, and how
they obtain their energy (
see Web Topic 6.4). Genes for
plant vacuolar H
+
–Ca
2+
antiporters and genes for the pro-
ton symport of several amino acids and sugars have also
been identified through various genetic techniques (Hirshi
et al. 1996; Tanner and Caspari 1996; Kuehn et al. 1999).
Genes for Specific Water Channels Have Been
Identified
Aquaporins are a class of proteins that is relatively abun-
dant in plant membranes (see Chapter 3). Aquaporins
reveal no ion currents when expressed in oocytes, but when
the osmolarity of the external medium is reduced, expres-
sion of these proteins results in swelling and bursting of the
oocytes. The bursting results from rapid influx of water
across the oocyte plasma membrane, which normally has a
very low water permeability. These results show that aqua-
porins form water channels in membranes (see Figure 3.6).
The existence of aquaporins was a surprise at first
because it was thought that the lipid bilayer is itself suffi-
ciently permeable to water. Nevertheless, aquaporins are
common in plant and animal membranes, and their expres-
sion and activity appear to be regulated, possibly by pro-
tein phosphorylation, in response to water availability
(Tyerman et al. 2002).
The Plasma Membrane H
+
-ATPase Has Several
Functional Domains
The outward, active transport of H
+
across the plasma
membrane creates gradients of pH and electric potential
that drive the transport of many other substances (ions and
molecules) through the various secondary active-transport
proteins. Figure 6.14 illustrates how a membrane H
+
-
ATPase might work.
Plant and fungal plasma membrane H
+
-ATPases and
Ca
2+
-ATPases are members of a class known as P-type
ATPases, which are phosphorylated as part of the catalytic
cycle that hydrolyzes ATP.Because of this phosphorylation
step, the plasma membrane ATPases are strongly inhibited
by orthovanadate (HVO
4
2–
), a phosphate (HPO
4
2–
) analog
that competes with phosphate from ATP for the aspartic
acid phosphorylation site on the enzyme. The high affinity
of the enzyme for vanadate is attributed to the fact that
vanadate can mimic the transitional structure of phosphate
during hydrolysis.
Plasma membrane H
+
-ATPases are encoded by a family
of about ten genes. Each gene encodes an isoform of the
enzyme (Sussman 1994). The isoforms are tissue specific,
and they are preferentially expressed in the root, the seed,
the phloem, and so on. The functional specificity of each
isoform is not yet understood; it may alter the pH optimum
of some isoforms and allow transport to be regulated in dif-
ferent ways for each tissue.
Solute Transport 101
OUTSIDE OF CELL
CYTOPLASM
M
+
M
+
M
+
M
+
M
+
M
+
M
+
M
+
M
+
M
+
M
+
M
+
M
+
M
+
M
+
M
+
M
+
M
+
M
+
M
+
M
+
M
+
M
+
M
+
M
+
M
+
M
+
M
+
M
+
M
+
M
+
M
+
M
+
M
+
M
+
(A) (B) (C) (D)
ATP
ADP
P
P
P
P
i
FIGURE 6.14 Hypothetical steps in the transport of a cation (the hypothetical M
+
)
against its chemical gradient by an electrogenic pump. The protein, embedded in the
membrane, binds the cation on the inside of the cell (A) and is phosphorylated by ATP
(B). This phosphorylation leads to a conformational change that exposes the cation to
the outside of the cell and makes it possible for the cation to diffuse away (C). Release
of the phosphate ion (P) from the protein into the cytosol (D) restores the initial con-
figuration of the membrane protein and allows a new pumping cycle to begin.
Figure 6.15 shows a model of the
functional domains of the plasma
membrane H
+
-ATPase of yeast,
which is similar to that of plants.
The protein has ten membrane-
spanning domains that cause it to
loop back and forth across the mem-
brane. Some of the membrane-span-
ning domains make up the pathway
through which protons are pumped.
The catalytic domain, including the
aspartic acid residue that becomes
phosphorylated during the catalytic
cycle, is on the cytosolic face of the
membrane.
Like other enzymes, the plasma
membrane ATPase is regulated by
the concentration of substrate (ATP),
pH, temperature, and other factors.
In addition, H
+
-ATPase molecules
can be reversibly activated or deac-
tivated by specific signals, such as
light, hormones, pathogen attack,
and the like. This type of regulation
is mediated by a specialized autoin-
hibitory domain at the C-terminal end of the polypeptide
chain, which acts to regulate the activity of the proton
pump (see Figure 6.15). If the autoinhibitory domain is
removed through the action of a protease, the enzyme
becomes irreversibly activated (Palmgren 2001).
The autoinhibitory effect of the C-terminal domain can
also be regulated through the action of protein kinases and
phosphatases that add or remove phosphate groups to ser-
ine or threonine residues on the autoinhibitory domain of the
enzyme. For example, one mechanism of response to
pathogens in tomato involves the activation of protein phos-
phatases that dephosphorylate residues on the plasma
membrane H
+
-ATPase, thereby activating it (Vera-Estrella
et al. 1994). This is one step in a cascade of responses that
activate plant defenses.
The Vacuolar H
+
-ATPase Drives Solute
Accumulation into Vacuoles
Because plant cells increase their size primarily by taking
up water into large, central vacuoles, the osmotic pressure
of the vacuole must be maintained sufficiently high for
water to enter from the cytoplasm. The tonoplast regulates
the traffic of ions and metabolites between the cytosol and
the vacuole, just as the plasma membrane regulates uptake
into the cell.Tonoplast transport became a vigorous area of
research following the development of methods for the iso-
lation of intact vacuoles and tonoplast vesicles (
see Web
Topic 6.5). These studies led to the discovery of a new type
of proton-pumping ATPase, which transports protons into
the vacuole (see Figure 6.11).
The vacuolar H
+
-ATPase (also called V-ATPase) differs
both structurally and functionally from the plasma mem-
brane H
+
-ATPase. The vacuolar ATPase is more closely
related to the F-ATPases of mitochondria and chloroplasts
(see Chapter 11). Because the hydrolysis of ATP by the vac-
uolar ATPase does not involve the formation of a phos-
phorylated intermediate, vacuolar ATPases are insensitive
to vanadate, the inhibitor of plasma membrane ATPases
discussed earlier. Vacuolar ATPases are specifically inhib-
ited by the antibiotic bafilomycin, as well as by high con-
centrations of nitrate, neither of which inhibit plasma mem-
brane ATPases. Use of these selective inhibitors makes it
possible to identify different types of ATPases, and to assay
their activity.
Vacuolar ATPases belong to a general class ofATPases
that are present on the endomembrane systems of all
FIGURE 6.15 Two-dimensional rep-
resentation of the plasma membrane
H
+
-ATPase. The H
+
-ATPase has 10
transmembrane segments. The regu-
latory domain is the autoinhibitory
domain. (From Palmgren 2001.)
COOH
Regulatory
domain
Transmembrane
domains
Plasma membrane
OUTSIDE OF CELL
CYTOPLASM
eukaryotes. They are large enzyme complexes, about 750
kDa, composed of at least ten different subunits (Lüttge
and Ratajczak 1997). These subunits are organized into a
peripheral catalytic complex, V
1
, and an integral membrane
channel complex, V
0
(Figure 6.16).Because of their simi-
larities to F-ATPases, vacuolar ATPases are assumed to
operate like tiny rotary motors (see Chapter 11).
Vacuolar ATPases are electrogenic proton pumps that trans-
port protons from the cytoplasm to the vacuole and generate
a proton motive force across the tonoplast. The electrogenic
proton pumping accounts for the fact that the vacuole is typ-
ically 20 to 30 mV more positive than the cytoplasm, although
it is still negative relative to the external medium. To maintain
bulk electrical neutrality, anions such as Cl
–
or malate
2–
are
transported from the cytoplasm into the vacuole through
channels in the membrane (Barkla and Pantoja 1996). Without
the simultaneous movement of anions along with the pumped
protons, the charge buildup across the tonoplast would make
the pumping of additional protons energetically impossible.
The conservation of bulk electrical neutrality by anion
transport makes it possible for the vacuolar H
+
-ATPase to
generate a large concentration (pH) gradient of protons
across the tonoplast. This gradient accounts for the fact that
the pH of the vacuolar sap is typically about 5.5, while the
cytoplasmic pH is 7.0 to 7.5. Whereas the electrical compo-
nent of the proton motive force drives the uptake of anions
into the vacuole, the electrochemical-potential gradient for
H
+
(∆mm
~
H
+
) is harnessed to drive the uptake of cations and
sugars into the vacuole via secondary transport (antiporter)
systems (see Figure 6.11).
Although the pH of most plant vacuoles is mildly acidic
(about 5.5), the pH of the vacuoles of some species is much
lower—a phenomenon termed hyperacidification. Vacuolar
hyperacidification is the cause of the sour taste of certain
fruits (lemons) and vegetables (rhubarb). Some extreme
examples are listed in Table 6.2. Biochemical studies with
lemon fruits have suggested that the low pH of the lemon
fruit vacuoles (specifically, those of the juice sac cells) is
due to a combination of factors:
• The low permeability of the vacuolar membrane to
protons permits a steeper pH gradient to build up.
• A specialized vacuolar ATPase is able to pump pro-
tons more efficiently (with less wasted energy) than
normal vacuolar ATPases can (Müller et al. 1997).
Solute Transport 103
V
1
V
0
CYTOPLASM
LUMEN OF VACUOLE
H
+
H
+
B
A
A
A
BB
C
E
H
D
c
d
F
a
a
G
Tonoplast
FIGURE 6.16 Model of the V-ATPase rotary motor. Many polypep-
tide subunits come together to make this complex enzyme. The V
1
catalytic complex is easily dissociated from the membrane, and
contains the nucleotide-binding and catalytic sites. Components of
V
1
are designated by uppercase letters. The intrinsic membrane
complex mediating H
+
transport is designated V
0
, and its subunits
are given lowercase letters. It is proposed that ATPase reactions
catalyzed by each of the A subunits, acting in sequence, drive the
rotation of the shaft D and the six c subunits. The rotation of the c
subunits relative to subunit a is thought to drive the transport of
H
+
across the membrane. (Based on an illustration courtesy of M.
F. Manolson.)
TABLE 6.2
The vacuolar pH of some hyperacidifying plant
species
Tissue Species pH
a
Fruits
Lime (Citrus aurantifolia) 1.7
Lemon (Citrus limonia) 2.5
Cherry (Prunus cerasus) 2.5
Grapefruit (Citrus paradisi) 3.0
Leaves
Rosette oxalis (Oxalis deppei) 1.3
Wax begonia 1.5
(Begonia semperflorens)
Begonia ‘Lucerna’ 0.9 – 1.4
Oxalis sp. 1.9 – 2.6
Sorrel (Rumex sp.) 2.6
Prickly Pear 1.4 (6:45
A.M.)
(Opuntia phaeacantha)
b
5.5 (4:00 P.M.)
Source:Data from Small 1946.
a
The values represent the pH of the juice or expressed sap of each
tissue,usually a good indicator of vacuolar pH.
b
The vacuolar pH of the cactus Opuntia phaeacantha varies with the
time of day.As will be discussed in Chapter 8,many desert succu-
lents have a specialized type of photosynthesis,called crassulacean
acid metabolism (CAM),that causes the pH of the vacuoles to
decrease during the night.
• The accumulation of organic acids such as citric,
malic, and oxalic acids helps maintain the low pH of
the vacuole by acting as buffers.
Plant Vacuoles Are Energized by a Second Proton
Pump,the H
+
-Pyrophosphatase
Another type of proton pump, an H
+
-pyrophosphatase
(H
+
-PPase) (Rea et al. 1998), appears to work in parallel
with the vacuolar ATPase to create a proton gradient across
the tonoplast (see Figure 6.11). This enzyme consists of a
single polypeptide that has a molecular mass of 80 kDa.
The H
+
-PPase harnesses its energy from the hydrolysis of
inorganic pyrophosphate (PP
i
).
The free energy released by PP
i
hydrolysis is less than that
from ATP hydrolysis. However, the vacuolar H
+
-PPase trans-
ports only one H
+
ion per PP
i
molecule hydrolyzed, whereas
the vacuolar ATPase appears to transport two H
+
ions per
ATP hydrolyzed. Thus the energy available per H
+
ion trans-
ported appears to be the same, and the two enzymes appear
to be able to generate comparable H
+
gradients.
In some plants the synthesis of the vacuolar H
+
-PPase is
induced by low O
2
levels (hypoxia) or by chilling. This
indicates that the vacuolar H
+
-PPase might function as a
backup system to maintain essential cell metabolism under
conditions in which ATP supply is depleted because of the
inhibition of respiration by hypoxia or chilling. It is of inter-
est that the plant vacuolar H
+
-PPase is not found in ani-
mals or yeast, although a similar enzyme is present in some
bacteria and protists.
Large metabolites such as flavonoids, anthocyanins and
secondary products of metabolism are sequestered in the
vacuole. These large molecules are transported into vac-
uoles by ATP-binding cassette (ABC) transporters. Trans-
port processes by the ABC transporters consume ATP and
do not depend on a primary electrochemical gradient (
see
Web Topic 6.6
). Recent studies have shown that ABC trans-
porters can also be found at the plasma membrane and in
mitochondria (Theodoulou 2000).
Calcium Pumps,Antiports,and Channels Regulate
Intracellular Calcium
Calcium is another important ion whose concentration is
strongly regulated. Calcium concentrations in the cell wall
and the apoplastic (extracellular) spaces are usually in the
millimolar range; free cytosolic Ca
2+
concentrations are
maintained at the micromolar (10
–6
M) range, against the
large electrochemical-potential gradient that drives Ca
2+
diffusion into the cell.
Small fluctuations in cytosolic Ca
2+
concentration dras-
tically alter the activities of many enzymes, making cal-
cium an important second messenger in signal transduc-
tion. Most of the calcium in the cell is stored in the central
vacuole, where it is taken up via Ca
2+
–H
+
antiporters,
which use the electrochemical potential of the proton gra-
dient to energize the accumulation of calcium into the vac-
uole (Bush 1995). Mitochondria and the endoplasmic retic-
ulum also store calcium within the cells.
Calcium efflux from the vacuole into the cytosol may in
some cells be triggered by inositol trisphosphate (IP
3
). IP
3
,
which appears to act as a “second messenger” in certain sig-
nal transduction pathways, induces the opening of IP
3
-gated
calcium channels on the tonoplast and endoplasmic reticu-
lum (ER). (For a more detailed description of these sensory
transduction pathways see Chapter 14 on the web site.)
Calcium ATPases are found at the plasma membrane
(Chung et al. 2000) and in some endomembranes of plant
cells (see Figure 6.11). Plant cells regulate cytosolic Ca
2+
con-
centrations by controlling the opening of Ca
2+
channels that
allow calcium to diffuse in, as well as by modulating the
activity of pumps that drive Ca
2+
out of the cytoplasm back
into the extracellular spaces. Whereas the plasma membrane
calcium pumps move calcium out of the cell, the calcium
pumps on the ER transport calcium into the ER lumen.
ION TRANSPORT IN ROOTS
Mineral nutrients absorbed by the root are carried to the
shoot by the transpiration stream moving through the
xylem (see Chapter 4). Both the initial uptake of nutrients
and the subsequent movement of mineral ions from the
root surface across the cortex and into the xylem are highly
specific, well-regulated processes.
Ion transport across the root obeys the same biophysi-
cal laws that govern cellular transport. However, as we
have seen in the case of water movement (see Chapter 4),
the anatomy of roots imposes some special constraints on
the pathway of ion movement. In this section we will dis-
cuss the pathways and mechanisms involved in the radial
movement of ions from the root surface to the tracheary
elements of the xylem.
Solutes Move through Both Apoplast and
Symplast
Thus far, our discussion of cellular ion transport has not
included the cell wall. In terms of the transport of small
molecules, the cell wall is an open lattice of polysaccharides
through which mineral nutrients diffuse readily. Because
all plant cells are separated by cell walls, ions can diffuse
across a tissue (or be carried passively by water flow)
entirely through the cell wall space without ever entering
a living cell. This continuum of cell walls is called the extra-
cellular space, or apoplast (see Figure 4.3).
We can determine the apoplastic volume of a slice of
plant tissue by comparing the uptake of
3
H-labeled water
and
14
C-labeled mannitol. Mannitol is a nonpermeating
sugar alcohol that diffuses within the extracellular space
but cannot enter the cells. Water, on the other hand, freely
penetrates both the cells and the cell walls. Measurements
of this type usually show that 5 to 20% of the plant tissue
volume is occupied by cell walls.
104 Chapter 6
Just as the cell walls form a continuous phase, so do the
cytoplasms of neighboring cells, collectively referred to as
the symplast. Plant cells are interconnected by cytoplasmic
bridges called plasmodesmata (see Chapter 1), cylindrical
pores 20 to 60 nm in diameter (see Figure 1.27). Each plas-
modesma is lined with a plasma membrane and contains a
narrow tubule, the desmotubule, that is a continuation of
the endoplasmic reticulum.
In tissues where significant amounts of intercellular
transport occur, neighboring cells contain large numbers of
plasmodesmata, up to 15 per square micrometer of cell sur-
face (Figure 6.17). Specialized secretory cells, such as floral
nectaries and leaf salt glands, appear to have high densi-
ties of plasmodesmata; so do the cells near root tips, where
most nutrient absorption occurs.
By injecting dyes or by making electrical-resistance mea-
surements on cells containing large numbers of plasmod-
esmata, investigators have shown that ions, water, and
small solutes can move from cell to cell through these
pores. Because each plasmodesma is partly occluded by the
desmotubule and associated proteins (see Chapter 1), the
movement of large molecules such as proteins through the
plasmodesmata requires special mechanisms (Ghoshroy et
al. 1997). Ions, on the other hand, appear to move from cell
to cell through the entire plant by simple diffusion through
the symplast (see Chapter 4).
Ions Moving through the Root Cross Both
Symplastic and Apoplastic Spaces
Ion absorption by the roots (see Chapter 5) is more pro-
nounced in the root hair zone than in the meristem and
elongation zones. Cells in the root hair zone have com-
pleted their elongation but have not yet begun secondary
growth. The root hairs are simply extensions of specific epi-
dermal cells that greatly increase the surface area available
for ion absorption.
An ion that enters a root may immediately enter the
symplast by crossing the plasma membrane of an epider-
mal cell, or it may enter the apoplast and diffuse between
the epidermal cells through the cell walls. From the apoplast
of the cortex, an ion may either cross the plasma membrane
of a cortical cell, thus entering the symplast, or diffuse radi-
ally all the way to the endodermis via the apoplast. In all
cases, ions must enter the symplast before they can enter the
stele, because of the presence of the Casparian strip.
The apoplast forms a continuous phase from the root
surface through the cortex. At the boundary between the
vascular cylinder (the stele) and the cortex is a layer of spe-
cialized cells, the endodermis. As discussed in Chapters 4
and 5, a suberized cell layer in the endodermis, known as
the Casparian strip, effectively blocks the entry of water
and mineral ions into the stele via the apoplast.
Once an ion has entered the stele through the symplas-
tic connections across the endodermis, it continues to dif-
fuse from cell to cell into the xylem. Finally, the ion reen-
ters the apoplast as it diffuses into a xylem tracheid or
vessel element. Again, the Casparian strip prevents the ion
from diffusing back out of the root through the apoplast.
The presence of the Casparian strip allows the plant to
maintain a higher ionic concentration in the xylem than
exists in the soil water surrounding the roots.
Xylem Parenchyma Cells Participate in Xylem
Loading
Once ions have been taken up into the symplast of the root
at the epidermis or cortex, they must be loaded into the tra-
cheids or vessel elements of the stele to be translocated to
the shoot. The stele consists of dead tracheary elements and
Solute Transport 105
Plasma membrane
Middle lamella
Cell wall
Tonoplast
Cytoplasm
Vacuole
Plasmodesma
Protein particles on
outer leaflet of ER
Protein particles on
inner leaflet of ER
Protein particles on
inner leaflet of
plasma membrane
Desmotubule
with appressed ER
Endoplasmic
reticulum
FIGURE 6.17 Diagram illustrating how plasmodesmata con-
nect the cytoplasms of neighboring cells. Plasmodesmata
are about 40 nm in diameter and allow diffusion of water
and small molecules from one cell to the next. In addition,
the size of the opening can be regulated by rearrange-
ments of the internal proteins to allow the passage of
larger molecules.
the living xylem parenchyma. Because the xylem tracheary
elements are dead cells, they lack cytoplasmic continuity
with surrounding xylem parenchyma. To enter the tra-
cheary elements, the ions must exit the symplast by cross-
ing a plasma membrane a second time.
The process whereby ions exit the symplast and enter
the conducting cells of the xylem is called xylem loading.
The mechanism of xylem loading has long baffled scien-
tists. Ions could enter the tracheids and vessel elements of
the xylem by simple passive diffusion. In this case, the
movement of ions from the root surface to the xylem
would take only a single step requiring metabolic energy.
The site of this single-step, energy-dependent uptake
would be the plasma membrane surfaces of the root epi-
dermal, cortical, orendodermal cells. According to the pas-
sive-diffusion model, ions move passively into the stele via
the symplast down a gradient of electrochemical potential,
and then leak out of the living cells of the stele (possibly
because of lower oxygen availability in the interior of the
root) into the nonliving conducting cells of the xylem.
Support for the passive-diffusion model was provided
by use of ion-specific microelectrodes to measure the elec-
trochemical potentials of various ions across maize roots
(Figure 6.18) (Dunlop and Bowling 1971). Data from this
and other studies indicate that K
+
, Cl
–
, Na
+
, SO
4
2–
, and
NO
3
–
are all taken up actively by the epidermal and corti-
cal cells and are maintained in the xylem against a gradi-
ent of electrochemical potential when compared with the
external medium (Lüttge and Higinbotham 1979). How-
ever, none of these ions is at a higher electrochemical
potential in the xylem than in the cortex or living portions
of the stele. Therefore, the final movement of ions into the
xylem could be due to passive diffusion.
However, other observations have led to the view that
this final step of xylem loading may also involve active
processes within the stele (Lüttge and Higinbotham 1979).
With the type of apparatus shown in Figure 6.19, it is pos-
sible to make simultaneous measurements of ion uptake
into the epidermal or cortical cytoplasm and of ion loading
into the xylem.
By using treatments with inhibitors and plant hormones,
investigators have shown that ion uptake by the cortex and
ion loading into the xylem operate independently. For
example, treatment with the protein synthesis inhibitor
cycloheximide or with the cytokinin benzyladenine inhibits
xylem loading without affecting uptake by the cortex. This
result indicates that efflux from the stelar cells is regulated
independently from uptake by the cortical cells.
Recent biochemical studies have supported a role for
the xylem parenchyma cells in xylem loading. The plasma
106 Chapter 6
Outside
solution
Epidermis Cortex Endodermis
Xylem
parenchyma
Xylem
tracheary
Electrochemical
potential
High
Low
Chloride (Cl
–
)
Potassium (K
+
)
Stele
Casparian strip
FIGURE 6.18 Diagram showing electrochemical potentials
of K
+
and Cl
–
across a maize root. To determine the electro-
chemical potentials, the root was bathed in a solution con-
taining 1 mM KCl and 0.1 mM CaCl
2
. A reference electrode
was positioned in the bathing solution, and an ion-sensitive
measuring electrode was inserted in different cells of the
root. The horizontal axis shows the different tissues found
in a root cross section. The substantial increase in electro-
chemical potential for both K
+
and Cl
–
between the bathing
medium and the epidermis indicates that ions are taken up
into the root by an active transport process. In contrast, the
potentials decrease at the xylem vessels, suggesting that
ions are transported into the xylem by passive diffusion
down the gradient of electrochemical potential. (After
Dunlop and Bowling 1971.)
membranes of xylem parenchyma cells contain proton
pumps, water channels, and a variety of ion channels spe-
cialized for influx or efflux (Maathuis et al. 1997). In barley
xylem parenchyma, two types of cation efflux channels
have been identified: K
+
-specific efflux channels and non-
selective cation efflux channels. These channels are regu-
lated by both the membrane potential and the cytosolic cal-
cium concentration (De Boer and Wegner 1997). This
finding suggests that the flux of ions from the xylem
parenchyma cells into the xylem tracheary elements, rather
than being due to simple leakage, is under tight metabolic
control through regulation of the plasma membrane H
+
-
ATPase and ion efflux channels.
SUMMARY
The movement of molecules and ions from one location to
another is known as transport. Plants exchange solutes and
water with their environment and among their tissues and
organs. Both local and long-distance transport processes in
plants are controlled largely by cellular membranes.
Forces that drive biological transport, which include
concentration gradients, electric-potential gradients, and
hydrostatic pressures, are integrated by an expression
called the electrochemical potential. Transport of solutes
down a chemical gradient (e.g., by diffusion) is known as
passive transport. Movement of solutes against a chemical-
potential gradient is known as active transport and
requires energy input.
The extent to which a membrane permits or restricts the
movement of a substance is called membrane permeabil-
ity. The permeability depends on the chemical properties
of the particular solute and on the lipid composition of the
membrane, as well as on the membrane proteins that facil-
itate the transport of specific substances.
When cations and anions move passively across a mem-
brane at different rates, the electric potential that develops
is called the diffusion potential. For each ion, the relation-
ship between the voltage difference across the membrane
and the distribution of the ion at equilibrium is described
by the Nernst equation. The Nernst equation shows that at
equilibrium the difference in concentration of an ion
between two compartments is balanced by the voltage dif-
ference between the compartments. That voltage difference,
or membrane potential, is seen in all living cells because of
the asymmetric ion distributions between the inside and
outside of the cells.
The electrical effects of different ions diffusing simul-
taneously across a cell membrane are summed by the
Goldman equation. Electrogenic pumps, which carry out
active transport and carry a net charge, change the mem-
brane potential from the value created by diffusion.
Membranes contain specialized proteins—channels, car-
riers, and pumps—that facilitate solute transport. Channels
are transport proteins that span the membrane, forming
pores through which solutes diffuse down their gradient
of electrochemical potentials. Carriers bind a solute on one
side of the membrane and release it on the other side.
Transport specificity is determined largely by the proper-
ties of channels and carriers.
Afamily of H
+
-pumping ATPases provides the primary
driving force for transport across the plasma membrane of
plant cells. Two other kinds of electrogenic proton pumps
serve this purpose at the tonoplast. Plant cells also have cal-
cium-pumping ATPases that participate in the regulation
of intracellular calcium concentrations, as well as ATP-
binding cassette transporters that use the energy of ATP to
transport large anionic molecules. The gradient of electro-
chemical potential generated by H
+
pumping is used to
drive the transport of other substances in a process called
secondary transport.
Genetic studies have revealed many genes, and their
corresponding transport proteins, that account for the ver-
satility of plant transport. Patch clamp electrophysiology
provides unique information on ion channels, and it
enables measurement of the permeability and gating of
individual channel proteins.
Solutes move between cells either through the extra-
cellular spaces (the apoplast) or from cytoplasm to cyto-
plasm (via the symplast). Cytoplasms of neighboring cells
are connected by plasmodesmata, which facilitate sym-
plastic transport. When an ion enters the root, it may be
taken up into the cytoplasm of an epidermal cell, or it may
diffuse through the apoplast into the root cortex and enter
the symplast through a cortical cell. From the symplast,
the ion is loaded into the xylem and transported to the
shoot.
Solute Transport 107
Compartment A Compartment B
Root
segment
Ion uptake
measurement
Xylem-loading
measurement
Radioactive
tracer added
FIGURE 6.19 We can measure the relationship between ion
uptake into the root and xylem loading by placing a root seg-
ment across two compartments and adding a radioactive tracer
to one of them (in this case compartment A). The rate of disap-
pearance of the tracer from compartment A gives a measure of
ion uptake, and the rate of appearance in compartment B pro-
vides a measurement of xylem loading. (From Lüttge and
Higinbotham 1979.)
Web Material
Web Topics
6.1 Relating the Membrane Potential to the
Distribution of Several Ions across the
Membrane:The Goldman Equation
A brief explanation of the use of the Goldman
equation to calculate the membrane permeabil-
ity of more than one ion.
6.2 Patch Clamp Studies in Plant Cells
The electrophysiological method of patch
clamping as applied to plant cells is described,
with some specific examples.
6.3 Chemiosmosis in Action
The chemiosmotic theory explains how electrical
and concentration gradients are used to perform
cellular work.
6.4 Kinetic Analysis of Multiple Transporter Systems
Application of principles on enzyme kinetics to
transport systems provides an effective way to
characterize different carriers.
6.5 Transport Studies with Isolated Vacuoles and
Membrane Vesicles
Certain experimental techniques enable the iso-
lation of tonoplasts and plasma membranes for
study.
6.6 ABC Transporters in Plants
ATP-binding cassette (ABC) transporters are a
large family of active transport proteins ener-
gized directly by ATP.
Web Essay
6.1 Potassium Channels
Several plant K
+
channels have been characterized.
Chapter References
Barkla, B. J., and Pantoja, O. (1996) Physiology of ion transport across
the tonoplast of higher plants. Annu. Rev. Plant Physiol. Plant Mol.
Biol. 47: 159–184.
Buchanan, B. B., Gruissem, W., and Jones, R. L., eds. (2000) Biochem-
istry and Molecular Biology of Plants. Amer. Soc. Plant Physiolo-
gists, Rockville, MD.
Bush, D. S. (1995) Calcium regulation in plant cells and its role in
signaling. Annu. Rev. Plant Physiol. Plant Mol. Biol. 46: 95–122.
Chrispeels, M. J., Crawford, N. M., and Schroeder, J. I. (1999) Pro-
teins for transport of water and mineral nutrients across the
membranes of plant cells. Plant Cell 11: 661–675.
Chung, W. S., Lee, S. H., Kim, J. C., Heo, W. D., Kim, M. C., Park, C.
Y., Park, H. C., Lim, C. O., Kim, W. B., Harper, J. F., and Cho, M.
J. (2000) Identification of a calmodulin-regulated soybean Ca
2+
-
ATPase (SCA1) that is located in the plasma membrane. Plant Cell
12: 1393–1407.
De Boer, A. H., and Wegner, L. H. (1997) Regulatory mechanisms of
ion channels in xylem parenchyma cells. J. Exp. Bot. 48: 441–449.
Dunlop, J., and Bowling, D. J. F. (1971) The movement of ions to the
xylem exudate of maize roots. J. Exp. Bot. 22: 453–464.
Ghoshroy, S., Lartey, R., Sheng, J., and Citovsky, V. (1997) Transport
of proteins and nucleic acids through plasmodesmata. Annu. Rev.
Plant Physiol. Plant Mol. Biol. 48: 27–50.
Higinbotham, N., Etherton, B., and Foster, R. J. (1967) Mineral ion
contents and cell transmembrane electropotentials of pea and oat
seedling tissue. Plant Physiol. 42: 37–46.
Higinbotham, N., Graves, J. S., and Davis, R. F. (1970) Evidence for
an electrogenic ion transport pump in cells of higher plants. J.
Membr. Biol. 3: 210–222.
Hirshi, K. D., Zhen, R G., Rea, P. A., and Fink, G. R. (1996) CAX1, an
H
+
/Ca
2+
antiporter from Arabidopsis. Proc. Natl Acad. Sci. USA 93:
8782–8786.
Kochian, L. V. (2000) Molecular physiology of mineral nutrient
acquisition, transport and utilization. In Biochemistry and Molec-
ular Biology of Plants, B. Buchanan, W. Gruissem, and R. Jones,
eds., American Society of Plant Physiologists, Rockville, MD, pp.
1204–1249.
Kuehn, C., Barker, L., Buerkle, L., and Frommer, W. B. (1999) Update
on sucrose transport in higher plants. J. Exp. Bot. 50: 935–953.
Leng, Q., Mercier, R. W., Hua, B-G., Fromm, H., and Berkowitz, G.
A. (2002) Electrophysical analysis of cloned cyclic nucleotide-
gated ion channels. Plant Physiol. 128: 400–410.
Lin, W., Schmitt, M. R., Hitz, W. D., and Giaquinta, R. T. (1984) Sugar
transport into protoplasts isolated from developing soybean
cotyledons. Plant Physiol. 75: 936–940.
Lüttge, U., and Higinbotham, N. (1979) Transport in Plants. Springer-
Verlag, New York.
Lüttge, U., and Ratajczak, R. (1997) The physiology, biochemistry
and molecular biology of the plant vacuolar ATPase. Adv. Bot.
Res. 25: 253–296.
Maathuis, F. J. M., Ichida, A. M., Sanders, D., and Schroeder, J. I.
(1997) Roles of higher plant K
+
channels. Plant Physiol. 114:
1141–1149.
Müller, M., Irkens-Kiesecker, U., Kramer, D., and Taiz, L. (1997)
Purification and reconstitution of the vacuolar H
+
-ATPases from
lemon fruits and epicotyls. J. Biol. Chem. 272: 12762–12770.
Nobel, P. (1991) Physicochemical and Environmental Plant Physiology.
Academic Press, San Diego, CA.
Palmgren, M. G. (2001) Plant plasma membrane H
+
-ATPases: Pow-
erhouses for nutrient uptake. Annu. Rev. Plant Physiol. Plant Mol.
Biol. 52: 817–845.
Rea, P. A., Li, Z-S., Lu, Y-P., and Drozdowicz, Y. M.(1998) From vac-
uolar Gs-X pumps to multispecific ABC transporters. Annu. Rev.
Plant Physiol. Plant Mol. Biol. 49: 727–760.
Small, J. (1946) pH and Plants, an Introduction to Beginners. D. Van
Nostrand, New York.
Spanswick, R. M. (1981) Electrogenic ion pumps. Annu. Rev. Plant
Physiol. 32: 267–289.
Sussman, M. R. (1994) Molecular analysis of proteins in the plant
plasma membrane. Annu. Rev. Plant Physiol. Plant Mol. Biol. 45:
211–234.
Tanner, W., and Caspari, T. (1996) Membrane transport carriers.
Annu. Rev. Plant Physiol. Plant Mol. Biol. 47: 595–626.
Tazawa, M., Shimmen, T., and Mimura, T. (1987) Membrane control
in the Characeae. Annu. Rev. Plant Phsyiol. 38: 95–117.
Theodoulou, F. L. (2000) Plant ABC transporters. Biochim. Biophys.
Acta 1465: 79–103.
Tyerman, S. D., Niemietz, C. M., and Bramley, H. (2002) Plant aqua-
porins: Multifunctional water and solute channels with expand-
ing roles. Plant Cell Envir. 25: 173–194.
Vera-Estrella, R., Barkla, B. J., Higgins, V. J., and Blumwald, E. (1994)
Plant defense response to fungal pathogens. Activation of host-
plasma-membrane H
+
-ATPase by elicitor-induced enzyme
dephosphorylation. Plant Physiol. 104: 209–215.
108 Chapter 6