Tài liệu Báo cáo khoa học: The diacylglycerol and protein kinase C pathways are not involved in insulin signalling in primary rat hepatocytes doc
Bạn đang xem bản rút gọn của tài liệu. Xem và tải ngay bản đầy đủ của tài liệu tại đây (441.44 KB, 12 trang )
The diacylglycerol and protein kinase C pathways are not involved
in insulin signalling in primary rat hepatocytes
Irmelin Probst
1
, Ulrich Beuers
2
, Birgit Drabent
1
, Kirsten Unthan-Fechner
1
and Peter Bu¨ tikofer
3
1
Institut fu
¨
r Biochemie und Molekulare Zellbiologie, Georg-August – Universita
¨
tGo
¨
ttingen, Germany;
2
Medizinische Klinik II-
Großhadern, Ludwig-Maximilians-Universita
¨
tMu
¨
nchen, Germany;
3
Institut fu
¨
r Biochemie und Molekularbiologie,
Universita
¨
t Bern, Switzerland
Diacylglycerol (DAG) and protein kinase C (PKC) isoforms
have been implicated in insulin signalling in muscle and fat
cells. We evaluated the involvement of DAG and PKC in the
action of insulin in adult rat hepatocytes cultured with dexa-
methasone, but in the absence of serum, for 48 h. Our
results show that although insulin stimulated glycolysis and
glycogen synthesis, it had no effect on DAG mass or
molecular species composition. Epidermal growth factor
showed the expected insulin-mimetic effect on glycolysis,
whereas ATP and exogenous phospholipase C acted as
antagonists and abolished the insulin signal. Similarly to
insulin, epidermal growth factor had no effect on DAG mass
or molecular species composition. In contrast, both ATP
and phospholipase C induced a prominent increase in sev-
eral DAG molecular species, including 18:0/20:4, 18:0/20:5,
18:0/22:5 and a decrease in 18:1/18:1. These changes were
paralleled by an increase in phospholipase D activity, which
was absent in insulin-treated cells. By immunoblotting or by
measuring PKC activity, we found that neither insulin nor
ATP translocated the PKCa,-d,-e or -f isoforms from the
cytosol to the membrane in cells cultured for six or 48 h.
Similarly, insulin had no effect on immunoprecipitable
PKCf. Suppression of the glycogenic insulin signal by
phorbol 12-myristate 13-acetate, but not by ATP, could be
completely alleviated by bisindolylmaleimide. Finally, insu-
lin showed no effect on DAG mass or translocation of PKC
isoforms in the perfused liver, although it reduced the glu-
cagon-stimulated glucose output by 75%. Together these
results indicate that phospholipases C and D or multiple
PKC isoforms are not involved in the hepatic insulin signal
chain.
Keywords: hepatocytes; insulin; ATP; diacylglycerol mole-
cular species; protein kinase C.
Among the three major insulin-sensitive organs, i.e. liver,
muscle and fat tissue, the liver plays a key role in the
regulation of blood glucose homeostasis by channelling
excess glucose into glycogen after food uptake and by
producing glucose through glycogenolysis and gluconeo-
genesis in the states of hunger and starvation. Insulin, the
dominant hormone of the absorptive phase, acts via
receptor-mediated tyrosine phosphorylation of insulin
receptor substrates (IRSs). Two well established signalling
cascades are initiated when adaptor proteins are recruited
to the IRSs through their src homology 2 domains (a) the
growth factor receptor binding protein activates the ras/
mitogen-activated protein kinase pathway and (b)
phosphatidylinositol 3-kinase activates the protein kin-
ase B/glycogen synthase kinase-3 cascade. Recent data
suggest that a third signalling pathway, downstream of
phosphatidylinositol 3-kinase, may also be involved: phos-
pholipase D (PLD)-dependent generation of phosphatidic
acid (PA) and diacylglycerol (DAG), with subsequent
activation of DAG-insensitive atypical protein kinase C
(PKC) isozymes such as f and k,aswellasactivationof
DAG-sensitive PKC isozymes [1–3]. These studies, which
were performed on muscle and fat cells, showed insulin-
dependent increases in lipid mediator concentrations [4–7]
and translocation and activation of various PKC isoforms
[6–13], suggesting their probable involvement in insulin
action [8,10,14,15].
In contrast, the available data on hepatic systems are
scarce, controversial and have been obtained using primary
adult rat hepatocyte suspensions and cultures, and different
hepatoma cell lines, as model systems. In hepatocyte
suspensions, insulin provoked increases in DAG mass
[16,17], whereas activation of PLD was demonstrated by
two groups [17,18], but not by another group [19]. Similarly,
activation of PKC was demonstrated, in two reports, in
both cytosolic and membrane fractions of crude extracts
[16,20], but not in a third [21]. Furthermore, activation of
atypical PKCf was demonstrated in hepatocytes cultured
without glucocorticoid for 3 days [22], whereas two other
reports showed enhanced translocation of the d isoform in
different hepatoma cell lines [23,24].
Correspondence to I. Probst, Institut fu
¨
r Biochemie und Molekulare
Zellbiologie, Humboldtallee 23, 37073 Go
¨
ttingen, Germany.
Fax: + 49 551 395960, Tel.: + 49 551 395961,
E-mail:
Abbreviations: DAG, diacylglycerol; EGF, epidermal growth factor;
IRSs, insulin receptor substrates; ODN, oligodesoxynucleotides;
PA, phosphatidic acid; PMA, phorbol 12-myristate 13-acetate;
PKC, protein kinase C; PLC, phospholipase C; PLD,
phospholipase D; TGF-a, transforming growth factor-a.
Enzymes: phospholipase C (EC 3.1.4.3); phospholipase D
(EC 3.1.4.4); protein kinase C (EC 2.7.1.37).
(Received 25 April 2003, revised 26 August 2003,
accepted 25 September 2003)
Eur. J. Biochem. 270, 4635–4646 (2003) Ó FEBS 2003 doi:10.1046/j.1432-1033.2003.03853.x
The aim of the present work was to study the possible
involvement of lipid signalling and PKC during hepatic
insulin action in a differentiated model for the adult organ,
the primary adult rat hepatocyte cultured serum-free with
dexamethasone. This system shows high insulin sensitivity
and responsiveness towards a multitude of insulin-depend-
ent parameters [25–27]. The effects of insulin were compared
with those of epidermal growth factor (EGF), ATP and
exogenous phospholipase C (PLC).
Materials and methods
Materials
Enzymes, M199 medium, collagenase A and the transfec-
tion agent DOSPER were from Roche Molecular Biochem-
icals (Mannheim, Germany). Bovine insulin was from Serva
(Heidelberg, Germany). Bisindolylmaleimide I and protein
G–agarose were from Calbiochem (Bad Soden, Germany).
Phorbol 12-myristate 13-acetate (PMA), rottlerin, PLC
from Clostridium perfringens, IGEPAL and dexamethasone
were from Sigma (Taufkirchen, Germany). A stock solution
of PMA (10 m
M
) was made in dimethylsulfoxide; before
use it was diluted 1 : 100 in M199 medium containing
0.2% (w/v) bovine serum albumin.
D
-[U-
14
C]Glucose,
[
32
P]ATP[cP], [9,10-
3
H]myristic acid, [9,10-
3
H]palmitic acid
and the Renaissance Western blot chemiluminescence
reagent were from New England Nuclear (Dreieich, Ger-
many). The DAG quantification test kit and the PKC
enzyme assay system were purchased from Amersham
(Braunschweig, Germany). The PKCf isoenzyme-specific
pseudosubstrate [Ser159]PKC-e-[153–164]-NH
2
was from
Bachem (Heidelberg, Germany). Silica gel 60 TLC plates
with concentration zones were from Merck (Hannover,
Germany). Whatman P-81 paper was from Herolab (Wies-
loch, Germany). Rabbit anti-PKC peptide Igs, anti-a,-b,-c,
-d,-e,and-f for immunoblotting were obtained from Gibco
(Grand Island, NY, USA). Rabbit anti-PKCf for immu-
noprecipitation and activity determination, and the anti-
PKCf blocking peptide, were from Santa Cruz (Heidelberg,
Germany). PKCf antisense oligodesoxynucleotides were
from Biognostik (Goettingen, Germany) and cytofectin
from Eurogentec/Glen Research (Ko
¨
ln, Germany).
Cell culture
Hepatocytes from fed male Wistar rats (of weight
180–250 g) were isolated by recirculating collagenase per-
fusion in situ, purified by centrifugation through Percoll and
culturedinM199mediumon6-cmplasticdishes[28].For
the first 3 h, medium contained 4% newborn calf serum,
1n
M
insulin and 0.1 l
M
dexamethasone. Serum was then
omitted and the cells were cultured for the next 4 or 43 h
with 1 n
M
insulin and 0.1 l
M
dexamethasone. Medium was
changed at 22 h. The gas atmosphere contained CO
2
/O
2
/N
2
(5 : 17 : 78).
Cell experiments
After 4 or 46 h of continuous culture, dishes were washed
twice and incubated in M199 (2.5 mL per dish). After 1 h
the medium was replaced with M199 containing 2 m
M
lactate (2 mL per dish). For the determination of glycogen
synthesis and glycolysis, the medium was supplemented
with [
14
C]glucose (30 kBq per dish). After a 30-min prein-
cubation, zero-time samples were taken and the experiment
was started by the addition of agonists to the dishes.
Inhibitors were added 10 min before the agonists. The
incubation was terminated by rapidly aspirating the
medium and immersing the dishes in liquid N
2
.
Glycolysis and glycogen synthesis
Glycolysis was determined by the rate of lactate release
into the culture supernatant. Labelled glucose was separ-
ated from labelled lactate by chromatography of 100 lL
of culture supernatant on Dowex 1 · 8(formateform),as
outlined previously [25]. The rate of glycogen synthesis
was determined by extracting and quantifying the
14
C-labelled glycogen from one 6 cm dish, as described
previously [27].
Liver perfusion
Rat livers were perfused in situ, via the portal vein, with
Krebs-Henseleit bicarbonate buffer, pH 7.4 (5 m
M
glucose,
2m
M
lactate, 0.2 m
M
pyruvate; 95% O
2
/5% CO
2
;37°C;
constant flow without recirculation, 5.5–6 mLÆmin
)1
Æg
)1
of
liver). Experiments were performed between 09.00 h and
11.00 h; preperfusion lasted for 20 min before the onset of
sampling from the inferior vena cava. Liver samples were
taken from the front lobe at 35 min.
Lipid extraction and separation by TLC
Hepatocytes from one 6-cm dish were scraped into 2 mL
of methanol and transferred into a glass tube. Chloroform
(1 mL) was added and lipids were extracted for 10 min at
4 °C. Subsequently, 1 mL of chloroform and 1.7 mL of
1
M
NaCl were added under vigorous mixing. After 5 min,
samples were centrifuged (400 g for 5 min), the aqueous
phase was discarded and the organic phase dried under N
2
at room temperature. Lipids were concentrated in the
V-shaped tip of the tube by repetitive solvent evaporation
and resuspension using diminishing volumes of chloro-
form. Dried lipids were stored under N
2
at )20 °C. For
separation of lipids by TLC, extracts were redissolved in
50 lL of chloroform/methanol (2 : 1, v/v) and applied in a
1-cm zone on a 20 · 20 cm
2
silica gel plate with concen-
tration zone. The solvent system used for separation of
DAG was heptan/diisopropylether/acetic acid (60 : 40 : 8,
v/v/v). Alkylacyl and alk-1-enylacyl subclasses co-migrate
on this TLC system with the DAG species. For the
determination of PLD activity in hepatocytes, 0.3% (v/v)
butanol was added to cells incubated in the presence or
absence of insulin or ATP. After lipid extraction, phos-
phatidylbutanol (formed by PLD-mediated phosphatidyl-
transfer onto butanol) was separated by TLC using ethyl
acetate/isooctane/acetic acid/H
2
O (130 : 20 : 30 : 100, v/v/
v/v) as the solvent system [17]. Phosphatidylbutanol was
quantified by a procedure that chars saturated and
unsaturated lipids equally [29] followed by densitometry
using authentic phosphatidylbutanol, prepared as des-
cribed previously [30], as a standard.
4636 I. Probst et al. (Eur. J. Biochem. 270) Ó FEBS 2003
Determination of DAG mass
DAG content was quantified radioenzymatically by incu-
bating aliquots of the lipid extract with DAG kinase and
[
32
P]ATP[cP], as described by Preiss et al.[31].Themanu-
facturer’s instructions for the commercially available DAG
test kit were followed.
32
P-labelled PA was purified using
chloroform/methanol/acetic acid (65 : 15 : 5, v/v/v) as a
solvent system and quantified with a Storm 860 phosphoi-
mager (Pharmacia, Freiburg, Germany).
Analysis of DAG molecular species
Hepatocytes from one 10-cm dish were extracted as outlined
above. After drying the lipid extract under nitrogen, DAGs
were extracted with ether and immediately benzoylated, as
described by Blank et al. [32]. Diradylglycerobenzoates were
separated into their subclasses (diacyl, alkylacyl, and alk-1-
enylacyl types) by TLC using benzene/hexane/ether
(50 : 45 : 4, v/v/v) as a solvent system, and the individual
molecular species were separated by HPLC using an
octadecyl reverse-phase column in acetonitrile/isopropanol
(80 : 20, v/v) as the mobile phase. Individual peaks were
quantified by measuring absorbance at 230 nm. To identify
individual molecular species, representative samples were
analysed by combined HPLC/MS [33] using the instrumen-
tation described in Bu
¨
tikofer et al. [34]. Briefly, after the UV
detector, methanol/0.2
M
aqueous ammonium acetate
(10 : 90; v/v) was added via a T-connector, and the total
flow was introduced through a thermospray interface into a
Finnigan MAT model TSQ70 mass spectrometer. The
M+NH
4
+
ions of the diradylglycerobezoates were
monitored by selected ion recording. The positional distri-
bution of the fatty acyl and fatty alcohol chains of individual
molecular species was not determined. The inclusion of the
antioxidant, butylated hydroxytoluene, in the different
solvents was found not to be necessary.
PKC activity in cytosol and membranes of crude extracts
Hepatocytes from two 6-cm dishes were homogenized in
500 lL of lysis buffer (20 m
M
Hepes, pH 7.5, 250 m
M
sucrose, 1 m
M
EGTA, 1 m
M
sodium vanadate, 1 m
M
sodium pyrophosphate, 1 m
M
NaF, 20 lgÆmL
)1
leupeptin,
20 lgÆmL
)1
aprotinin, 1 m
M
phenylmethanesulfonyl fluor-
ide, 20 m
M
2-mercaptoethanol) and centrifuged at
100 000 g for 30 min. Supernatant and membrane fraction
were diluted with lysis buffer (without sucrose and EGTA)
and 8–14 lg of protein from each fraction was assayed for
the ability to phosphorylate a synthetic EGF-receptor
peptide (RKRTLRRL). The Amersham assay contained
25 lL of sample, 25 m
M
Tris/HCl, pH 7.5, 34 lgÆmL
)1
phosphatidylserine, 2.7 lgÆmL
)1
PMA, 102 l
M
receptor
peptide, 3.4 m
M
dithiothreitol, 1.36 m
M
calcium acetate,
109 l
M
ATP, and 6.5 m
M
MgCl
2
in a total volume of
55 lL. For the specific measurement of the atypical PKC
isoenzyme-f,Ca
2+
was omitted from the assay, 80 lgÆmL
)1
phosphatidylserine was substituted for the kit lipid reagent
and the kit peptide substrate was replaced by 50 l
M
[Ser159]PKC-e-[153–164]-NH
2
. Assays were conducted in
the presence or absence of the substrate for 3–9 min at
30 °C and stopped with 0.3
M
phosphoric acid. Aliquots
were spotted on P-81 filter paper, washed three times with
75 m
M
phosphoric acid and counted.
Immunoblotting of PKC isoforms
Hepatocyte preparation and immunoblotting were per-
formed exactly as described previously [35]. Samples from
the perfused liver (200 mg) were homogenized in 1 mL of
lysisbufferbysonication(5· 10 s) and centrifuged at
8000 g for 3 min; the supernatant was processed as
outlined previously [35]. The bands of PKC isoforms
were identified by (a) comparison with molecular mass
markers run on each gel, (b) comparison with the bands
of a rat brain cytosol sample rich in all relevant PKC
isoforms run on each gel, (c) PMA-induced PKC
translocation from the cytosol to the membrane fraction
(except for the nonmobile f-isoform; samples of control
and PMA-treated cells were run on each gel for compar-
ison), and (d) comparison of bands after incubation of a
membrane blot with buffer in the presence or absence of
an antigen (PKC isoform) of the respective PKC
antibody. The bands on the immunoblots at about
80 000 molecular mass, representing PKC isoforms a, d
and f, and at 90 000 molecular mass, representing PKC
isoform e, were quantified by densitometry.
Immunoprecipitation and activity assay of PKCf
Hepatocytes from one 6 cm dish were homogenized in
500 lL of PKC lysis buffer (see above) supplemented with
0.5% IGEPAL (Nonidet P-40) and 1% Triton X-100. The
lysate was sonicated for 10 s and centrifuged for 20 min at
20 000 g after 30 min of incubation at 4 °C. Supernatants
(200 ll, 1 mg of protein) were incubated under mild
agitation for 4 h at 4 °Cwith5lgofanti-PKCf,which
had been coupled to protein G–agarose (30 lL of agarose in
NaCl/P
i
,1h,4°C). Immobilized immune complexes were
recovered by centrifugation, washed three times with
complete lysis buffer and twice in kinase buffer (50 m
M
Tris pH 7.5, 10 m
M
MgCl
2
,1m
M
sodium vanadate, 1 m
M
dithiothreitol, 10 lgÆmL
)1
leupeptin, 10 lgÆmL
)1
aprotinin,
0.2 m
M
phenylmethanesulfonyl fluoride). Kinase buffer
(25 lL) was added to the beads and the enzyme was
assayed in a total volume of 50 lL containing 80 lgÆmL
)1
phosphatidylserine, 50 l
M
[
32
P]ATP[cP] (15 kBq per assay)
and 50 l
M
PKC e-peptide. Enzyme activity showed time
linearity for at least 15 min. Assays were conducted for
10 min and processed, as described for PKC, in crude
extracts. Immunoblot analysis showed that insulin treat-
ment of the cells did not alter the amount of PKCf in the
immunoprecipitate.
Results
Hepatocytes used in the present study were routinely
cultured serum-free in the presence of 0.1 l
M
dexametha-
sone for 46 h. In each subsequent short-term experiment,
measurement of lipid mediators or PKC was always
paralleled by the determination of the physiological action
of insulin on glucose metabolism. ATP and exogenous PLC,
which both stimulate DAG formation [36–38], were used as
positive controls. In addition, EGF, an insulin-mimetic as
Ó FEBS 2003 Insulin signalling in rat hepatocytes (Eur. J. Biochem. 270) 4637
well as an insulin-antagonistic factor [39–41], was included
in some experiments.
Metabolic effects
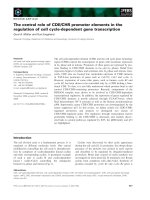
We found that the addition of insulin to our primary rat
hepatocyte cultures stimulated glycolysis 4.5-fold, with a
50% effective dose (ED
50
)of 0.3 n
M
,whereasEGF
increased glycolysis twofold, with an ED
50
of 0.5 ngÆmL
)1
(Fig. 1B). Similar results have been reported before for
other hepatocyte culture systems [27,41]. Furthermore,
transforming growth factor-a (TGF-a) completely mim-
icked EGF action in the lower concentration range
(0.1–3 ngÆmL
)1
); however, it elicited an extrastimulatory
response (+30%) at higher concentrations (Fig. 1B). In
contrast to its known inhibitory action on glycogen synthase
[36], PLC was insulin-mimetic at low concentrations
(0.1–3 mUÆmL
)1
) and stimulated glycolysis by up to
3.5-fold (Fig. 1A). However, at concentrations of
>5 mUÆmL
)1
, the effect of PLC diminished with increas-
ing concentrations. At these higher concentrations, PLC
strongly antagonized the action of insulin. As reported
previously [42], ATP (> 10 l
M
) inhibited basal and insulin-
activated glycolysis (results not shown).
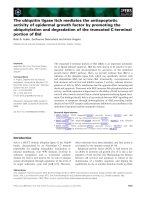
Furthermore, we observed that the addition of insulin
stimulated glycogen synthesis ninefold, whereas ATP, PLC
and EGF/TGF-a severely inhibited both basal and insulin-
activated rates of glycogen synthesis (Fig. 2). These findings
are in good agreement with previous reports using other
hepatocyte culture systems [28,37,40,43]. Unexpectedly,
however, EGF and TGF-a were found to be insulin-
mimetic at a low concentration (1 ngÆmL
)1
) (Fig. 2). In
some experiments, cells were cultured for only 6 h; these
cells were less insulin-responsive (as shown by a threefold
increase of glycogenesis).
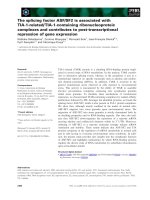
Determination of DAG mass and DAG molecular species
Increases in DAG and PA, through insulin-dependent
activation of PLC and PLD, have been reported previously
for rat hepatocytes [16–18]. In contrast to these studies, we
found no increase in DAG mass when the cells were
stimulated with 1–100 n
M
insulin, either in 6-h cultures
(data not shown) or in 48 h cultures (Fig. 3). Similarly, the
addition of 10 ngÆmL
)1
EGF or 10 ngÆmL
)1
TGF-a also
showed no effect. As shown previously [36,37], ATP and
PLC are capable of rapidly elevating the level of DAG. In
agreement with these reports, we found that the addition of
100 l
M
ATP doubled DAG mass within 5 min; interest-
ingly, the presence of PLC increased DAG mass at both
insulin-mimetic (5 mUÆmL
)1
) and insulin-antagonistic
(100 mUÆmL
)1
) concentrations (Fig. 3).
It has been previously shown that the addition of tritium-
labelled fatty acids to hepatocytes results in the incorpor-
ation of label into the phospholipid fraction [17,18];
subsequent addition of insulin led to an increase in the
production of [
3
H]DAG and [
3
H]PA. We investigated such
a possible mechanism by labelling cells from 24 h to 46 h of
culture with 110 kBqÆmL
)1
of [
3
H]myristate or [
3
H]palmi-
tate and determined the amount of radioactivity recovered
in the DAG fraction. Again, our results showed no
differences between cells incubated in the presence or
absence of insulin (results not shown).
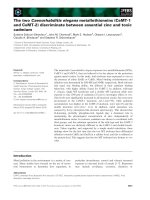
To study whether the observed increase in DAG mass
after stimulation of rat hepatocytes with ATP or PLC was
specific for certain molecular species, diacyl, alkylacyl and
alk-1-enylacyl subclasses were separated and their molecular
species composition was determined by combined HPLC/
MS. The results in Table 1 show a typical molecular species
composition of the diacylglycerol subclass from untreated
hepatocytes; the corresponding HPLC trace is shown
in Fig. 4A. Control and agonist-stimulated hepatocytes
Fig. 1. Insulin-mimetic effects of epidermal growth factor (EGF),
transforming growth factor a (TGF-a) and phospholipase C (PLC) on
glycolysis. Hepatocytes were cultured for 46 h in the presence of 1 n
M
insulin and 0.1 l
M
dexamethasone. Subsequently, they were washed
free of hormones and incubated for 30 min in M199 medium con-
taining 0.1 l
M
dexamethasone and 2 m
M
lactate before the agonists
were added. [
14
C]Lactate production from 5 m
M
[
14
C]glucose was
measured for 2 h. Data represent mean values ± SD from three dif-
ferent hepatocyte preparations.
4638 I. Probst et al. (Eur. J. Biochem. 270) Ó FEBS 2003
contained almost exclusively diacyl-type molecular species
(> 98% of total species). The HPLC profile, and thus the
composition of DAG species, was not altered when cultures
were treated with insulin (100 n
M
), EGF (10 ngÆmL
)1
)
or TGF-a (10 ngÆmL
)1
), for various periods of time
(0.5–60 min) at different cell densities (results not shown).
These results are entirely consistent with our observation
that insulin, EGF and TGF-a have no effect on DAG levels
in primary rat hepatocytes.
In contrast, 100 l
M
ATP and 100 mUÆmL
)1
PLC
showed a dramatic change in the HPLC profile (Fig. 4B).
Relative increases were seen for peak 11 (18:0/20:5), peak 17
(18:0/22:5) and peak 18 (18:0/20:4), whereas peak 20 (18:1/
18:1) was reduced (Fig. 5). The most prominent effect was a
3.9-fold enrichment of the species 18:0/20:4 (peak 18), which
was observed for both agonists.
Our results clearly contrast those of Baldini and cowork-
ers who showed an insulin-dependent increase in DAG and
PA in hepatocytes [17,18]. However, their studies were
carried out either with hepatocyte suspensions or with cells
cultured for 24 h in the absence of dexamethasone and
insulin, but in the presence of 10% (v/v) fetal bovine serum.
We therefore investigated the effect of insulin on DAG
molecular species composition using their culture condi-
tions. In agreement with their results, we found that in cells
cultured for 24 h, insulin provoked the elevation of two
molecular species of DAG (18:0/20:4 and 18:0/20:5), while
one species was decreased (18:1/18:1). Thus, insulin indeed
mimicked the effects of ATP and PLC although the changes
were smaller, i.e. 30–50% of the ATP responses (results not
shown). However, when we studied the metabolic insulin
responsiveness of the cells cultured under these steroid-free
conditions, we found that the activation of glycogen
Fig. 2. Modulation of basal and insulin-stimulated glycogen synthesis by epidermal growth factor (EGF), transforming growth factor a (TGF-a), ATP
and phospholipase C (PLC). Hepatocytes were cultured as described in the legend to Fig. 1. Incorporation of [
14
C]glucose into glycogen was
measured for 2 h. Data represent mean values ± SD from four to seven different hepatocyte preparations.
Fig. 3. Total cellular diacylglycerol (DAG) mass of hepatocytes after
treatment with ATP, phospholipase C (PLC), insulin and epidermal
growth factor (EGF)/transforming growth factor a (TGF-a). Hepato-
cytes were cultured as described in the legend to Fig. 1. The DAG
content was quantified in lipid extracts using the DAG kinase assay.
Data represent mean values ± SD from three to five different
hepatocyte preparations.
Ó FEBS 2003 Insulin signalling in rat hepatocytes (Eur. J. Biochem. 270) 4639
synthesis was severely reduced by 90% compared to cells
cultured with dexamethasone (Fig. 2).
Measurement of PLD activity
A possible involvement of PLD in insulin signalling was
investigated in cells using our serum-free culture condi-
tions, in the presence of dexamethasone, by determining
transphosphatidylation activity with 0.3% butanol as the
acceptor [17]. We found that cell exposure to insulin in
the presence of butanol did not increase the formation
of phosphatidylbutanol. As reported previously [19],
transphosphatidylation was, however, five- to 10-fold
enhanced in the presence of ATP (positive control, data
not shown).
Translocation of PKC
Rat hepatocytes in culture expressed PKC isoforms a, d, e
and f.Thea-isoform was mainly associated with the
cytosolic fraction, and the d-, e-andf-isoforms were
approximately equally distributed between the cytosol and
membrane fraction (Table 2). In control experiments, the
conventional cPKCa and the novel nPKCs d and e, but not
the atypical aPKCf, were translocated to the membrane
fraction by the phorbol ester, PMA (Table 2). These results
are in good agreement with a previous study [35]. Neither
insulin nor ATP were able to translocate any of the isoforms
within 1–15 min after agonist addition (Table 2).
Measurement of PKC activity
In a first series of experiments, PKC activity was determined
as overall activity in cytosol and membranes using the EGF-
receptor peptide as a non isoform-specific substrate and the
PKCe pseudosubstrate as a preferred substrate for PKCf.
Translocation of the PKC by PMA from the cytosol to
the membrane was clearly demonstrated by the cytosolic
decrease and membranous increase of enzyme activity
(Table 3); in contrast, insulin showed no effect on PKC
activity.
In a second series of experiments, PKCf was immuno-
precipitated and its activity was determined in precipitates
from cells treated with or without insulin for 1–15 min. We
were unable to detect an insulin-dependent increase in the
activity of the immunoprecipitated enzyme, which agrees
with the inability of insulin to translocate PKCf.
Inhibitor studies
Stimulation of glycogen synthesis by insulin could not be
inhibited by the relatively selective PKC inhibitor bis-
indolylmaleimide I, which predominantly inhibits conven-
tional and novel isoforms, i.e. the a-, d-ande-isoforms
(Fig. 6). Owing to its isoform specificity, the inhibitor
completely alleviated the insulin-antagonistic effect of
PMA, which is mediated via DAG-dependent PKC
isoforms. In contrast, bisindolylmaleimide I was unable to
revert the ATP-mediated blockade of the insulin signal
(Fig. 6). Selective inhibition of PKCd by the inhibitor
rottlerin (5–10 l
M
) was also without effect on insulin
signalling (data not shown).
Finally, we tried to inhibit insulin signalling by transfect-
ing hepatocytes with antisense oligodesoxynucleotides
(ODN) targeted against PKCf. We found that cells
transfected with 2.5 lgÆmL
)1
cytofectin and 0.125 n
M
fluorescent ODN, or with 2–10 lgÆmL
)1
DOSPER and
0.5–2.5 l
M
fluorescent ODN, showed up to 80% fluores-
cent nuclei, and the amount of PKCf was reduced slightly
(< 30%) after 3 days of culture when PKCf antisense
ODN was added. It should be noted, however, that both cell
vitality (measured by the release of lactate dehydrogenase)
and insulin signalling (measured as glycogen synthesis) were
significantly decreased by the transfection agents as well as
by the control ODN alone (results not shown). Thus,
Table 1. Diacylglycerol molecular species composition of rat hepato-
cytes cultured for 48 h. Diacylglycerols were analysed as diacyl-
glycerobenzoate derivates by combined HPLC/MS. Individual
molecular species are listed in order of their elution from the HPLC
column (Fig. 4A). Values are mean ± SD of three determinations
from a typical experiment.
Peak no. Molecular species Composition (%)
1 + 2 3.2 ± 0.1
3 16:1, 20:4 1.2 ± 0.1
4 18:2, 20:4
+ 16:0, 20:5
a
4.4 ± 0.4
5 16:2, 18:2 5.1 ± 0.2
6 + 7 18:2, 18:2
+ 18:1, 18:3
a
+ 16:1, 20:3
a
1.7 ± 0.2
8 + 9 16:1, 18:2
+ 16:0, 22:6
a
+ 14:0, 14:0
a
2.6 ± 0.3
10 16:1, 16:1
+ 14:0, 18:2
a
+ 14:0, 16:1
a
4.4 ± 0.2
11 16:1, 22:4
+ 18:0, 20:5
a
2.4 ± 0.2
12 16:0, 20:4 3.8 ± 0.2
13 18:1, 18:2
+ 18:0, 22:6
a
+ 16:1, 18:1
a
12.5 ± 0.3
14 16:0, 18:2
+ 18:0, 18:3
a
8.8 ± 0.5
15 16:0, 16:1 0.7 ± 0.1
16 < 0.5
17 18:0, 22:5 4.1 ± 0.6
18 18:0, 20:4 4.3 ± 0.9
19 17:0, 18:2
+ 16:1, 17:0
a
3.6 ± 0.7
20 18:1, 18:1 13.6 ± 0.8
21 16:0, 18:1
+ 18:0, 18:2
a
14.3 ± 0.4
22 16:0, 16:0
+ 18:0, 22:4
a
1.4 ± 0.1
23 < 0.5
24 < 0.5
25 18:0, 18:1 2.5 ± 0.01
26 16:0, 18:0 3.8 ± 0.3
27 18:0, 18:0 1.0 ± 0.4
a
These species co-elute from the HPLC column.
4640 I. Probst et al. (Eur. J. Biochem. 270) Ó FEBS 2003
although this method has been successfully applied to
down-regulate specific PKC isoforms and to study PKC
involvement in signal transduction in other cell systems
previously [44], it seems to not (yet) be applicable to primary
hepatocytes.
Insulin effects in the perfused liver
The effects of insulin on DAG mass and PKC isoform
translocation were examined in the intact organ to exclude
the possibility that the data obtained with hepatocytes were
restricted to the isolated cell system. The anti-glucagon
action of insulin was chosen to demonstrate the hormone’s
metabolic activity. The perfused liver received 50 p
M
glucagon for 5–10 min; this first bolus served as an internal
metabolic vitality control. From 30 to 35 min, the liver
received no agonist (basal control), 1 l
M
PMA (positive
control for PKC translocation), a second bolus of 50 p
M
glucagon or a staggered infusion of 10 n
M
insulin
(25–35 min) and 50 p
M
glucagon (Fig. 7B,C). The anti-
glucagon effect of insulin was demonstrated by a 75%
reduction of the glucagon-stimulated glucose output. PMA
alone stimulated glucose production (data not shown) [45].
Of all agonists used, only PMA translocated PKC isoforms
a, d and e (Fig. 7A). Differences in DAG mass (lgÆmg
)1
of
protein) were not observed between control liver (8.3) and
livers treated with glucagon (7.9), insulin/glucagon (8.2), or
PMA (8.2, n ¼ 3 for all treatments).
Discussion
In muscle and fat tissue, lipid messengers such as DAG
and PA, as well as DAG-dependent and -independent
PKC isoforms, have recently been proposed to play a role
in the insulin signal leading to activation of glucose
uptake [1–3].
Fig. 4. HPLC profile of diacylglycerol (DAG) molecular species of control and ATP-stimulated hepatocytes. Hepatocytes cultured for 2 days were
incubated for 5 min with M199 as vehicle (A) or 100 l
M
ATP (B), and the molecular species of DAG were analysed as described in the Materials
and methods. Data represent mean values ± SD of three determinations from a representative experiment of 10.
Ó FEBS 2003 Insulin signalling in rat hepatocytes (Eur. J. Biochem. 270) 4641
In contrast, in liver preparations these novel insulin
signalling pathways have been poorly studied and the
available data are confusing and controversial [16–22]. The
results presented in this report were obtained using (a)
the highly insulin-sensitive in vitro liver system of cultured
hepatocytes and (b) the perfused liver, and speak clearly
against an involvement of phospholipases and PKC
isoforms in hepatic insulin signalling, for the following
reasons. First, we found that the addition of insulin to rat
hepatocytes did not increase DAG mass or change the
Fig. 5. Changes in hepatocyte diacylglycerol (DAG) molecular species composition in response to ATP and phospholipase C (PLC) stimulation.
Hepatocytes cultured for 2 days were incubated with vehicle (control, s), 100 l
M
ATP (d), or 5 (n)or100(m)mUÆmL
)1
PLC, and the molecular
species of DAG were analysed as described in the Materials and methods. The figure shows time-dependent changes of four DAG species expressed
as percentages of total DAG. Data represent the mean values ± SD from four to six different hepatocyte preparations.
Table 2. Effect of 4b-phorbol 12-myristate 13-acetate (PMA), insulin and ATP on the distribution of protein kinase C (PKC) isoforms. Hepatocytes
cultured for 6 h and 48 h were incubated with 0.1 l
M
PMA, 10 n
M
insulin or 0.1 l
M
ATP for 5 min, and subsequently homogenized and separated
into cytosol and particulate membrane fraction. The membrane-bound fraction of the PKC isoforms is expressed as the percentage of the total
(membrane + cytosol) signal from immunoblots. Results are given as mean values ± SD from five to eight experiments using different hepatocyte
preparations.
Agonist Culture
Percentage of membrane-bound PKC
PKCa PKCd PKCe PKCf
Control 6 h 19.5 ± 7.7 51.5 ± 11.1 41.5 ± 5.8 41.2 ± 7.7
48 h 13.3 ± 11.4 37.7 ± 5.9 40.1 ± 4.0 41.7 ± 11.7
PMA 6 h 39.7 ± 11.0* 77.3 ± 10.0* 66.5 ± 12.2* 43.5 ± 7.0
48 h 44.0 ± 12.3* 67.9 ± 9.7* 54.7 ± 11.1* 37.5 ± 16.6
Insulin 6 h 20.0 ± 8.0 52.8 ± 9.6 41.6 ± 12.1 38.8 ± 2.3
48 h 20.7 ± 15.3 39.2 ± 13.3 35.6 ± 7.4 36.7 ± 10.1
ATP 6 h 27.8 ± 4.9 41.2 ± 9.6 58.8 ± 8.7 39.0 ± 9.9
48 h 19.0 ± 7.3 37.1 ± 7.4 42.7 ± 10.4 36.7 ± 7.9
* P < 0.05 vs. control.
4642 I. Probst et al. (Eur. J. Biochem. 270) Ó FEBS 2003
DAG molecular species composition. Second, an
involvement of PLD could not be demonstrated as
insulin-stimulated hepatocytes showed no evidence for
transphosphatidylation activity. Third, we found no
evidence of translocation of PKC isoforms from the cytosol
to the membrane fraction after stimulation of hepatocytes
with insulin. Fourth, insulin-stimulated cells showed no
increase in membrane-bound PKC activity and did not
increase the activity of immunoprecipitated PKCf.Fifth,
the action of insulin on glycogen synthesis was not abolished
by the specific PKC inhibitor, bisindolylmaleimide, whereas
it completely reversed the insulin-antagonistic effect of
PMA. Sixth, insulin did not alter DAG mass and PKC
isozyme distribution in the perfused liver.
Our results are in good agreement with two previous
reports showing a lack of PLD [19] and PKC [21] activation
upon stimulation of rat hepatocytes with insulin. In
contrast, they clearly contradict several other recent studies
showing insulin-mediated activation of PLD and PKC
activities in hepatocyte suspensions and cultures
[16–18,20,22]. We suggest that this controversy may be a
result of the use of different cell systems: hepatocytes in
suspension often show reduced insulin responsiveness,
whereas primary cultured cells can easily lose their insulin
sensitivity when cultured without dexamethasone. There is
ample evidence that, for a number of insulin-sensitive
metabolic parameters, hormone responsiveness is only
retained when the cells are cultured long term in the
presence of a glucocorticoid [26]. Interestingly, the reports
showing insulin-dependent increases in DAG, and activa-
tion of PLD and/or PKC, all used cell suspensions or
glucocorticoid-deprived cultures [16–18,20,22], whereas the
hepatocytes used in this report were cultured in the presence
of dexamethasone. A clear example of how dramatically the
results may change, depending on the culture conditions,
was obtained when we incubated hepatocytes in the absence
of dexamethasone; this led to insulin-dependent increases in
DAG molecular species rich in stearate and arachidonate,
which agree with Baldini’s data for steroid-deprived cells
[17,18]. However, our parallel observation, that the cells
cultured under these conditions showed a dramatic reduc-
tion of insulin-stimulated glycogen synthesis, casts serious
doubts on the validity of these steroid-free cultures. A
similar controversy also exists concerning the mechanism of
action of EGF in hepatocytes. A review of the literature
shows that EGF-dependent phospholipase activation, and
Table 3. Determination of protein kinase C (PKC) activity in crude extracts (pmolÆmin
-1
Æmg
-1
of protein) and PKCf immunoprecipitates
(pmolÆmin
-1
Æmg
-1
of lysate protein). Hepatocytes cultured for 6 h and 48 h were exposed to vehicle, 0.1 l
M
phorbol 12-myristate 13-acetate (PMA)
or 10 n
M
insulin for 10 min. Data represent mean values ± SD from three different hepatocyte preparations.
Treatment Culture
Protein kinase C activity
Crude extracts
PKCf-immunoprecipitateCytosol Membrane
Control 6 h 121.3 ± 4 95.1 ± 10 ND
48 h 243.2 ± 16 148 ± 34 ND
PMA
a
6 h 58.0 ± 8
d
218.5 ± 19
d
ND
48 h 141.5 ± 33
c
249.1 ± 40
c
ND
Insulin
a
6 h 123.9 ± 8 91.6 ± 15 ND
48 h 220.0 ± 16 171.7 ± 29 ND
Control
b
6 h 48.7 ± 3 161.4 ± 18 ND
48 h 165.5 ± 35 188.3 ± 40 2.26 ± 0.14
Insulin
b
6 h 55.1 ± 9 151.5 ± 14 ND
48 h 146.0 ± 38 199.7 ± 29 2.13 ± 0.21
a
Assay with Ca
2+
and the epidermal growth factor-receptor peptide (Amersham test kit) as substrate.
b
Assay without Ca
2+
and with
peptide-e as substrate. ND, not determined,
c
P < 0.05,
d
P < 0.005.
Fig. 6. Sensitivity of insulin-, 4b-phorbol 12-myristate 13-acetate
(PMA)- and ATP-modulated glycogen synthesis to bisindolylmaleimide.
Hepatocytes cultured for 48 h were incubated with the agonists and
the inhibitor for 2 h. Data represent the mean values ± SD from three
different hepatocyte preparations.
Ó FEBS 2003 Insulin signalling in rat hepatocytes (Eur. J. Biochem. 270) 4643
increases in DAG, PA, inositoltrisphosphate and cytosolic
calcium, were detected to various degrees when hepatocyte
suspensions or glucocorticoid-free hepatocyte cultures were
used [36,39,41,46,47]. In contrast, in our dexamethasone-
treated cultures, EGF had no effect on DAG levels, which is
in agreement with the results of Dajani et al.[38]whoused
similar culture conditions. Working with hepatocyte sus-
pensions and cultured cells, Nojiri & Hoek [47] pointed out
that EGF-induced inositoltrisphosphate formation was
effectively reduced by actin rearrangement, which occurs
during the transition of the cells from the suspended to the
cultured state. As dexamethasone is known to retain
cuboidal hepatocyte morphology in cultures and to
influence actin polymerization [48], the differences in insulin
signalling (and also in EGF signalling) observed between
steroid-treated and untreated cultures might well reflect the
differences in cytoskeletal cell architecture and thus point to
a major regulatory role of actin fibers in the propagation of
hormone and growth factor signals. The recent finding that
focal adhesion kinase regulates protein kinase B, glycogen
synthase kinase-3 and glycogen synthase, in an insulin-
dependent manner [49], supports the hypothesis of cross-
talk between insulin and integrin-signalling pathways.
Thelackofaninsulin-elicitedincreaseinDAG,shown
here for dexamethasone-treated hepatocytes and for the
perfused liver, excludes the involvement of conventional and
novel PKCs, but not that of atypical PKCf in signal
transduction. Our results indicate that PKCf is not involved
in the activation of glycogen synthesis by insulin. This
finding is in good agreement with a previous report showing
that a specific inhibitor of PKCf hadnoeffectonthe
activation of glycogen synthase, although the authors
observed the insulin-dependent activation of PKCf in their
glucocorticoid-deprived hepatocyte cultures [22]. Recent
observations also showed insulin-mediated activation of
PKCs in hepatoma cell lines [23,24,50]. However, in our
view, these data do not support a role for PKCs in the adult
hepatic insulin signalling cascade because hepatoma cells
are in an abnormal proliferative state.
Recently, doubts have been raised regarding whether
atypical PKCs are indeed involved in glucose transport in
L6 myotubes [51] and in 3T3-L1 adipocytes transiently
transfected with wild-type or mutant PKCk and f [52].
Thus, activation of atypical PKCs by insulin might depend
on cell differentiation status (via culture conditions), and
PKC isoforms may indirectly modulate insulin action by
interfering with enzyme compartmentalization and associ-
ation with the cytoskeleton.
Acknowledgments
We are very grateful to Frank Rhode for his expert help with liver
perfusions and we thank Dr Ralf Wimmer for the measurements of
PKC distribution in liver tissue samples. This work was supported by
grants from the Swiss National Science Foundation (to P.B.) and the
Deutsche Forschungsgemeinschaft (to I.P. and U.B.).
References
1. Formisano, P. & Beguinot, F. (2001) The role of protein kinase C
isoforms in insulin action. J. Endocrinol. Invest. 24, 460–467.
2. Farese, R.V. (2002) Function and dysfunction of aPKC isoforms
for glucose transport in insulin-sensitive and insulin-resistant
states. Am. J. Physiol. Endocrinol. Metab. 283, E1–E11.
3. Lorenzo, M., Teruel, T., Hernandez, R., Kayali, A.G. & Webster,
N.J. (2002) PLCgamma participates in insulin stimulation of
glucose uptake through activation of PKCzeta in brown adipo-
cytes. Exp. Cell Res. 278, 146–157.
4. Boggs, K.P., Farese, R.V. & Buse, M.G. (1991) Insulin adminis-
tration in vivo increases 1,2-diacylglycerol in rat skeletal muscle.
Endocrinology 128, 636–638.
5. Hoffman, J.M., Standaert, M.L., Nair, G.P. & Farese, R.V. (1991)
Differential effects of pertussis toxin on insulin-stimulated phos-
phatidylcholine hydrolysis and glycerolipid synthesis de novo.
Studies in BC3H-1 myocytes and rat adipocytes. Biochemistry 30,
3315–3322.
6. Yamada,K.,Standaert,M.L.,YuB.,Mischak,H.,Cooper,D.R.
& Farese, R.V. (1994) Insulin-like effects of sodium orthovanadate
Fig. 7. Insulin effects on glucose metabolism and protein kinase C
(PKC) distribution in the perfused liver. After the first glucagon bolus,
livers were further perfused without agonist (C, control), with glucagon
(Ggn) (B), with insulin/glucagon (Ins/Ggn) (C) or with 1 l
M
phorbol
12-myristate 13-acetate (PMA; shown only for PKC distribution) (A).
Liversamplesofthefrontlargelobeweresampledat35min.Data
represent the mean values from three different perfusions for each
agonist. *P < 0.05 were indicated (A vs. control) and for the insulin
values from 34 to 41 min (C vs. glucagon).
4644 I. Probst et al. (Eur. J. Biochem. 270) Ó FEBS 2003
on diacylglycerol-protein kinase C signaling in BC3H-1 myocytes.
Arch. Biochem. Biophys. 312, 167–172.
7. Standaert, M.L., Avignon, A., Yamada, K., Bandyopadhyay, G.
& Farese, R.V. (1996) The phosphatidylinositol 3-kinase inhibitor,
wortmannin, inhibits insulin-induced activation of phosphati-
dylcholine hydrolysis and associated protein kinase C transloca-
tion in rat adipocytes. Biochem. J. 313, 1039–1046.
8. Bandyopadhyay, G., Standaert, M.L., Galloway, L., Moscat, J. &
Farese, R.V. (1997) Evidence for involvement of protein kinase C
(PCK)-Z and noninvolvement of diacylglycerol-sensitive PKCs in
insulin-stimulated glucose transport in L6 myotubes. Endocrinol-
ogy 138, 4721–4731.
9. Braiman,L.,Alt,A.,Kuroki,T.,Ohba,M.,Bak,A.,Tennen-
baum, T. & Sampson, S.R. (1999) Protein kinase Cd mediates
insulin-induced glucose transport in primary cultures of rat skel-
etal muscle. Mol. Endocrinol. 13, 2002–2012.
10. Braiman, L., Sheffi-Friedman, L., Bak, A., Tennenbaum, T. &
Sampson, S.R. (1999) Tyrosine phosphorylation of specific pro-
tein kinase C isoenzymes participates in insulin stimulation of
glucose transport in primary cultures of rat skeletal muscle.
Diabetes 48, 1922–1929.
11. Bandyopadhyay, G., Standaert, M.L., Zhao, L., Yu B., Avignon,
A., Galloway, L., Karnam, P., Moscat, J. & Farese, R.V. (1997)
Activation of protein kinase C (a, b,andf)byinsulinin3T3/L1
cells. J. Biol. Chem. 272, 2551–2558.
12. Standaert, M.L., Galloway, L., Karnam, P., Bandyopadhyay, G.,
Moscat, J. & Farese, R.V. (1997) Protein kinase C-Z. as a
downstream effector of phosphatidylinositol 3-kinase during
insulin stimulation in rat adipocytes. J. Biol. Chem. 272,
30075–30082.
13. Walaas, O., Horn, R.S. & Walaas, S.I. (1997) The protein kinase C
pseudosubstrate peptide (PKC19-36) inhibits insulin-stimulated
protein kinase activity and insulin-mediated translocation of the
glucose transporter glut 4 in streptolysin-O permeabilized adipo-
cytes. FEBS Lett. 413, 152–156.
14. Bandyopadhyay, G., Standaert, M.L., Kikkawa, U., Ono, Y.,
Moscat, J. & Farese, R.V. (1999) Effects of transiently expressed
atypical (f, k), conventional (a, b) and novel (d, e) protein kinase C
isoforms on insulin-stimulated translocation of epitope-tagged
GLUT4 glucose transporters in rat adipocytes: specific inter-
changeable effects of protein kinases C-Z. and C-1. Biochem. J.
337, 461–470.
15. Kotani, K., Ogawa, W., Matsumoto, M., Kitamura, T., Sakaue,
H.,Hino,Y.,Miyake,K.,Sano,W.,Akimoto,K.,Ohno,S.&
Kasuga, M. (1998) Requirement of atypical protein kinase Ck for
insulin stimulation of glucose uptake but not for Akt activation in
3T3-L1 adipocytes. Mol. Cell. Biol. 18, 6971–6982.
16. Cooper, D.R., Hernandez, H., Kuo, J.Y. & Farese, R.V. (1990)
Insulin increases the synthesis of phospholipid and diacylglycerol
and protein kinase C activity in rat hepatocytes. Arch. Biochem.
Biophys. 276, 486–494.
17. Baldini, P.M., Zannetti, A., Donchenko, V., Dini, L. & Luly, P.
(1992) Insulin effect on isolated rat hepatocytes: diacylglycerol–
phosphatidic acid interrelationship. Biochim. Biophys. Acta 1137,
208–214.
18. Donchenko, V., Zannetti, A. & Baldini, P.M. (1994) Insulin-sti-
mulated hydrolysis of phosphatidylcholine by phospholipase C
and phospholipase D in cultured rat hepatocytes. Biochim. Bio-
phys. Acta 1222, 492–500.
19. Moehren, G., Gustavsson, L. & Hoek, J.B. (1994) Activation and
desensitization of phospholipase D in intact rat hepatocytes.
J. Biol. Chem. 269, 838–848.
20. Nivet,V.,Clot,J P.,Do,X T.,Barrault,V.,Prelot,M.&Dur-
ant, D. (1993) Evidence that growth hormone stimulates protein
kinase C activity in isolated rat hepatocytes. Metabolism 42,
1291–1295.
21. Vaartjes, W.J., de Haas, C.G.M. & van den Bergh, S.G. (1986)
Phorbol esters, but not epidermal growth factor or insulin, rapidly
decrease soluble protein kinase C activity in rat hepatocytes.
Biochem. Biophys. Res. Commun. 138, 1328–1333.
22. Lavoie, L., Band, C.J., Kong, M., Bergeron, J.J.M. & Posner, B.I.
(1999) Regulation of glycogen synthase in rat hepatocytes. J. Biol.
Chem. 274, 28279–28285.
23. Reks, S.E., Smith, P.H., Messina, J.L. & Weinstock, R.S. (1998)
Translocation of PKC delta by insulin in a rat hepatoma cell line.
Endocrine 8, 161–167.
24. Caruso, M., Maitan, M.A., Bifulco, G., Miele, C., Vigliotta, G.,
Oriente, F., Formisano, P. & Beguinot, F. (2001) Activation and
mitochondrial translocation of protein kinase Cd are necessary for
insulin stimulation of pyruvate dehydrogenase complex activity in
muscle and liver cells. J. Biol. Chem. 276, 45088–45097.
25. Quentmeier, A., Daneschmand, H., Klein, H., Unthan-Fechner,
K. & Probst, I. (1993) Insulin-mimetic actions of phorbol ester in
cultured adult rat hepatocytes. Biochem. J. 289, 549–555.
26. Klein, H., Ullmann, S., Drenckhan, M., Grimmsmann, T.,
Unthan-Fechner, K. & Probst, I. (2002) Differential modulation
of insulin actions by dexamethasone: studies in primary cultures
of adult rat hepatocytes. J. Hepatol. 37, 432–440.
27. Fleig, W.E., No
¨
ther-Fleig, G., Steudter, S., Enderle, D. & Dit-
schuneit, H. (1985) Regulation of insulin binding and glycogenesis
by insulin and dexamethasone in cultured rat hepatocytes. Bio-
chim. Biophys. Acta 847, 352–361.
28. Oetjen, E., Schweickhardt, C., Unthan-Fechner, K. & Probst, I.
(1990) Stimulation of glycogenolysis by glucagon, noradrenaline
and non-degradable adenosine analogues is counteracted by ade-
nosine and ATP in cultured hepatocytes. Biochem. J. 182,
337–344.
29. Baron, C.B., Cunningham, M., Strauss, J.F. III & Coburn, R.F.
(1984) Pharmacomechanical coupling in smooth muscle may
involve phosphatidylinositol metabolism. Proc. Natl Acad. Sci.
USA 81, 6899–6903.
30. Chattopadhyay, J., Nataranjan, V. & Schmid, H.H.O. (1991)
Membrane-associated phospholipase D activity in rat sciatic
nerve. J. Neurochem. 57, 1429–1436.
31. Preiss,J.,Loomis,C.R.,Bishop,W.R.,Stein,R.,Niedel,J.E.&
Bell, R.M. (1986) Quantitative measurement of sn-1,2-diacyl-
glcerols present in platelets, hepatocytes, and ras- and cis-
transformed normal rat kidney cells. Biol. Chem. 261, 8597–8600.
32. Blank, M.L., Robinson, M., Fitzgerald, V. & Snyder, F. (1984)
Novel quantitative method for determination of molecular species
of phospholipids and diglycerides. J. Chromatogr. 298, 473–482.
33. Bu
¨
tikofer, P., Kuypers, F.A., Shackleton, C., Brodbeck, U. &
Stieger, S. (1990) Molecular species analysis of the glycosyl-
phosphatidylinositol anchor of Torpedo marmorata acety-
lcholinesterase. J. Biol. Chem. 265, 18983–18987.
34. Bu
¨
tikofer, P., Zollinger, M. & Brodbeck, U. (1992) Alkylacyl
glycerophosphoinositol in human and bovine erythrocytes.
Molecular species composition and comparison with glycosyl-
inositolphospholipid anchors of erythrocyte acetylcholinesterases.
Eur. J. Biochem. 208, 677–683.
35. Beuers, U., Probst, I., Soroka, C., Boyer, J.L., Kullack-Ublich,
G A. & Paumgartner, G. (1999) Modulation of protein kinase C
by taurolithocholic acid in isolated rat hepatocytes. Hepatology 29,
477–482.
36. Bocckino, S.B., Blackmore, P.F. & Exton, J.H. (1995) Stimulation
of 1,2-diacylglycerol accumulation in hepatocytes by vasopressin,
epinephrine and angiotensin II. J. Biol. Chem. 260, 14201–14207.
37. Blackmore, P.F., Strickland, W.G., Bocckino, S.B. & Exton, J.H.
(1986) Mechanism of hepatic glycogen synthase inactivation in-
duced by Ca
2+
-mobilizing hormones. J. Biol. Chem. 237, 235–242.
38. Dajani, O.F., Sandnes, D., Meilen, O., Rezvani, F., Nilssen,
L.S., Thoresen, G.H. & Christoffersen, T. (1999) Role of
Ó FEBS 2003 Insulin signalling in rat hepatocytes (Eur. J. Biochem. 270) 4645
diacylglycerol (DAG) in hormonal induction of S phase in hepa-
tocytes: the DAG-dependent protein kinase C pathway is not
acitivated by epidermal growth factor (EGF), but is involved in
mediating the enhancement of responsiveness to EGF by vaso-
pression, angiotensin II, and norepinephrine. J. Cell. Physiol. 180,
203–214.
39. Bosch, F., Bouscarel, B., Slaton, J., Blackmore, P.F. & Exton, J.H.
(1986) Epidermal growth factor mimics insulin effects in rat
hepatocytes. Biochem. J. 239, 523–530.
40. Chowdhury, M.H. & Agius, L. (1987) Epidermal growth factor
counteracts the glycogenic effect of insulin in parenchymal hepa-
tocyte cultures. Biochem. J. 247, 307–314.
41. Quintana, I., Grau, M., Moreno, F., Soler, C., Ramirez, I. &
Soley, M. (1995) The stimulation of glycolysis by epidermal
growth factor in isolated rat hepatocytes is secondary to the gly-
cogenolytic effect. Biochem. J. 308, 889–894.
42. Probst, I., Quentmeier, A., Schweickhardt, C. & Unthan-Fechner,
K. (1989) Stimulation by insulin of glycolysis in cultured hepato-
cytes is attendend by extracellular ATP and puromycin through
purine-dependent inhibition of phosphofructokinase 2 activation.
Eur. J. Biochem. 182, 387–393.
43. Keppens, S. & de Wulf, H. (1985) P2-purinergic control of liver
glycogenolysis. Biochem. J. 237, 797–799.
44. Chen, C.C., Wang, J.K. & Lin, S.B. (1998) Antisense oligo-
nucleotides targeting protein kinase C-a-bIor-d but not -g inhibit
lipopolysaccharide-induced nitric oxide synthase expression in
RAW 264.7 macrophages: involvement of a nuclear factor
jB-dependent mechanism. J. Immunol. 161, 6206–6214.
45. Kuiper, J., Casteleyn, E. & Van Berkel, T.J. (1988) Regulation
of liver communication by intercellular communication. Adv.
Enzyme Regul. 27, 193–208.
46. Yang, L., Camoratto, A.M., Baffy, G., Raj, S., Manning, D.R. &
Williamson, J.R. (1993) Epidermal growth factor-mediated sig-
nalling of G
i
-protein to activation of phospholipases in rat-cul-
tured hepatocytes. J. Biol. Chem. 268, 3739–3746.
47. Nojiri, S. & Hoek, J.B. (2000) Suppression of epidermal growth
factor-induced phospholipase C activation associated with actin
rearrangement in rat hepatocytes in primary culture. Hepatology
32, 947–957.
48. Koukouritaki, S.B., Gravanis, A. & Stournaras, C. (1999) Tyro-
sine phosphorylation of focal adhesion kinase and paxillin reg-
ulates the signaling mechanism of the rapid non-genomic action of
dexamethasone on acton cytoskeleton. Mol. Med. 5, 731–742.
49. Huang, D., Cheung, A.T., Parsons, T. & Bryer-Ash, M. (2002)
Focal adhesion kinase (FAK) regulates insulin-stimulated glyco-
gen synthesis in hepatocytes. J. Biol. Chem. 277, 18151–18160.
50. Lornejad-Schafer, M.R., Schafer, C., Graf, D., Haussinger, D. &
Schliess, F. (2003) Osmotic regulation of MAP-kinase phospha-
tase MKP-1 expression in H4IIE rat hepatoma cells. Biochem. J.
371, 609–619.
51. Wang,Q.,Somwar,R.,Bilan,P.J.,Liu,Z.,Jin,J.,Woodget,J.R.
& Klip, A. (1999) Protein kinase B/Akt participates in GLUT4
translocation by insulin in L6 myoblasts. Mol. Cell. Biol. 19, 4008–
4018.
52. Tsuru, M., Katagiri, H., Asano, T., Yamada, T., Ohno, S., Ogi-
hara, T. & Oka, Y. (2002) Role of PKC isoforms in glucose
transport in 3T3-L1 adipocytes: insignificance of atypical PKC.
Am. J. Physiol. 283, E338–E345.
4646 I. Probst et al. (Eur. J. Biochem. 270) Ó FEBS 2003