Tài liệu Báo cáo khoa học: "An ERP-based Brain-Computer Interface for text entry using Rapid Serial Visual Presentation and Language Modeling" ppt
Bạn đang xem bản rút gọn của tài liệu. Xem và tải ngay bản đầy đủ của tài liệu tại đây (536.74 KB, 6 trang )
Proceedings of the ACL-HLT 2011 System Demonstrations, pages 38–43,
Portland, Oregon, USA, 21 June 2011.
c
2011 Association for Computational Linguistics
An ERP-based Brain-Computer Interface for text entry
using Rapid Serial Visual Presentation and Language Modeling
K.E. Hild
◦
,
U. Orhan
†
,
D. Erdogmus
†
,
B. Roark
◦
,
B. Oken
◦
,
S. Purwar
†
,
H. Nezamfar
†
,
M. Fried-Oken
◦
◦
Oregon Health and Science University
†
Cognitive Systems Lab, Northeastern University
{hildk,roarkb,oken,friedm}@ohsu.edu {orhan,erdogmus,purwar,nezamfar}@ece.neu.edu
Abstract
Event related potentials (ERP) corresponding
to stimuli in electroencephalography (EEG)
can be used to detect the intent of a per-
son for brain computer interfaces (BCI). This
paradigm is widely used to build letter-by-
letter text input systems using BCI. Neverthe-
less using a BCI-typewriter depending only on
EEG responses will not be sufficiently accu-
rate for single-trial operation in general, and
existing systems utilize many-trial schemes to
achieve accuracy at the cost of speed. Hence
incorporation of a language model based prior
or additional evidence is vital to improve accu-
racy and speed. In this demonstration we will
present a BCI system for typing that integrates
a stochastic language model with ERP classifi-
cation to achieve speedups, via the rapid serial
visual presentation (RSVP) paradigm.
1 Introduction
There exist a considerable number of people with se-
vere motor and speech disabilities. Brain computer
interfaces (BCI) are a potential technology to create
a novel communication environment for this popula-
tion, especially persons with completely paralyzed
voluntary muscles (Wolpaw, 2007; Pfurtscheller et
al., 2000). One possible application of BCI is typ-
ing systems; specifically, those BCI systems that
use electroencephalography (EEG) have been in-
creasingly studied in the recent decades to enable
the selection of letters for expressive language gen-
eration (Wolpaw, 2007; Pfurtscheller et al., 2000;
Treder and Blankertz, 2010). However, the use of
noninvasive techniques for letter-by-letter systems
lacks efficiency due to low signal to noise ratio and
variability of background brain activity. Therefore
current BCI-spellers suffer from low symbol rates
and researchers have turned to various hierarchi-
cal symbol trees to achieve system speedups (Serby
et al., 2005; Wolpaw et al., 2002; Treder and
Blankertz, 2010). Slow throughput greatly dimin-
ishes the practical usability of such systems. In-
corporation of a language model, which predicts
the next letter using the previous letters, into the
decision-making process can greatly affect the per-
formance of these systems by improving the accu-
racy and speed.
As opposed to the matrix layout of the popu-
lar P300-Speller (Wolpaw, 2007), shown in Fig-
ure 1, or the hexagonal two-level hierarchy of the
Berlin BCI (Treder and Blankertz, 2010), we uti-
lize another well-established paradigm: rapid se-
rial visual presentation (RSVP), shown in Figure
2. This paradigm relies on presenting one stimu-
lus at a time at the focal point of the screen. The
sequence of stimuli are presented at relatively high
speeds, each subsequent stimulus replacing the pre-
vious one, while the subject tries to perform men-
tal target matching between the intended symbol and
the presented stimuli. EEG responses corresponding
to the visual stimuli are classified using regularized
discriminant analysis (RDA) applied to stimulus-
locked temporal features from multiple channels.
The RSVP interface is of particular utility for the
most impaired users, including those suffering from
locked-in syndrome (LIS). Locked-in syndrome can
result from traumatic brain injury, such as a brain-
stem stroke
1
, or from neurodegenerative diseases
such as amyotrophic lateral sclerosis (ALS or Lou
Gehrig’s disease). The condition is characterized by
near total paralysis, though the individuals are cog-
nitively intact. While vision is retained, the motor
control impairments extend to eye movements. Of-
ten the only reliable movement that can be made by
1
Brain stem stroke was the cause of LIS for Jean-Dominique
Bauby, who dictated his memoir The Diving Bell and the But-
terfly via eyeblinks (Bauby, 1997).
M
G
A FEC
_9765
3 4Y 1Z
XWUTS
RQON
H
B
LKI
V
8
P
J
2
D
Figure 1: Spelling grid such as that used for the P300
speller (Farwell and Donchin, 1988). ‘ ’ denotes space.
38
Figure 2: RSVP scanning interface.
an individual is a particular muscle twitch or single
eye blink, if that. Such users have lost the voluntary
motor control sufficient for such an interface. Rely-
ing on extensive visual scanning or complex gestu-
ral feedback from the user renders a typing interface
difficult or impossible to use for the most impaired
users. Simpler interactions via brain-computer in-
terfaces (BCI) hold much promise for effective text
communication for these most impaired users. Yet
these simple interfaces have yet to take full advan-
tage of language models to ease or speed typing.
In this demonstration, we will present a language-
model enabled interface that is appropriate for the
most impaired users.
In addition, the RSVP paradigm provides some
useful interface flexibility relative to the grid-based
paradigm. First, it allows for auditory rather than
visual scanning, for use by the visually impaired
or when visual access is inconvenient, such as in
face-to-face communication. Auditory scanning is
less straightforward when using a grid. Second,
multi-character substrings can be scanned in RSVP,
whereas the kind of dynamic re-organization of a
grid that would be required to support this can be
very confusing. Finally, language model integration
with RSVP is relatively straightforward, as we shall
demonstrate. See Roark et al. (2010) for methods
integrating language modeling into grid scanning.
2 RSVP based BCI and ERP Classification
RSVP is an experimental psychophysics technique
in which visual stimulus sequences are displayed
on a screen over time on a fixed focal area and
in rapid succession. The Matrix-P300-Speller used
by Wadsworth and Graz groups (especially g.tec,
Austria) opts for a spatially distributed presentation
of possible symbols, highlighting them in different
orders and combinations to elicit P300 responses.
Berlin BCI’s recent variation utilizes a 2-layer tree
structure where the subject chooses among six units
(symbols or sets of these) where the options are laid
out on the screen while the subject focuses on a cen-
tral focal area that uses an RSVP-like paradigm to
elicit P300 responses. Full screen awareness is re-
quired. In contrast, our approach is to distribute
the stimuli temporally and present one symbol at a
time using RSVP and seek a binary response to find
the desired letter, as shown in Figure 2. The latter
method has the advantage of not requiring the user
to look at different areas of the screen, which can be
an important factor for those with LIS.
Our RSVP paradigm utilizes stimulus sequences
consisting of the 26 letters in the English alphabet
plus symbols for space and backspace, presented in
a randomly ordered sequence. When the user sees
the target symbol, the brain generates an evoked re-
sponse potential (ERP) in the EEG; the most promi-
nent component of this ERP is the P300 wave, which
is a positive deflection in the scalp voltage primar-
ily in frontal areas and that generally occurs with a
latency of approximately 300 ms. This natural nov-
elty response of the brain, occurring when the user
detects a rare, sought-after target, allows us to make
binary decisions about the user’s intent.
The intent detection problem becomes a signal
classification problem when the EEG signals are
windowed in a stimulus-time-locked manner start-
ing at stimulus onset and extending for a sufficient
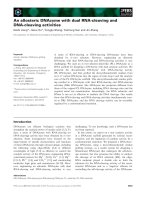
duration – in this case 500ms. Consider Figure
3, which shows the trial-averaged temporal signals
from various EEG channels corresponding to tar-
get and non-target (distractor) symbols. This graph
shows a clear effect between 300 and 500 ms for the
target symbols that is not present for the distractor
symbols (the latter of which clearly shows a com-
ponent having a periodicity of 400 ms, which is ex-
pected in this case since a new image was presented
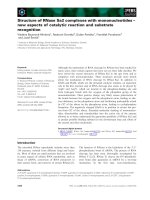
every 400 ms). Figure 4, on the other hand, shows
the magnitude of the trial and distractor responses at
channel Cz on a single-trial basis, rather than aver-
aged over all trials. The signals acquired from each
EEG channel are incorporated and classified to de-
termine the class label: ERP or non-ERP.
Our system functions as follows. First, each chan-
nel is band-pass filtered. Second, each channel is
temporally-windowed. Third, a linear dimension
reduction (using principal components analysis) is
learned using training data and is subsequently ap-
plied to the EEG data when the system is being
used. Fourth, the data vectors obtained for each
channel and a given stimulus are concatenated to
create the data matrix corresponding to the speci-
fied stimulus. Fifth, Regularized Discriminant Anal-
ysis (RDA) (Friedman, 1989), which estimates con-
ditional probability densities for each class using
39
Figure 3: Trial-averaged EEG data corresponding to the target
response (top) and distractor response (bottom) for a 1 second
window.
Kernel Density Estimation (KDE), is used to deter-
mine a purely EEG-based classification discriminant
score for each stimulus. Sixth, the conditional prob-
ability of each letter given the typed history is ob-
tained from the language model. Seventh, Bayesian
fusion (which assumes the EEG-based information
and the language model information are statistically
independent given the class label) is used to combine
the RDA discriminant score and the language model
score to generate an overall score, from which we
infer whether or not a given stimulus represents an
intended (target) letter.
RDA is a modified quadratic discriminant anal-
ysis (QDA) model. Assuming each class has a
multivariate normal distribution and assuming clas-
sification is made according to the comparison of
posterior distributions of the classes, the optimal
Bayes classifier resides within the QDA model fam-
ily. QDA depends on the inverse of the class co-
variance matrices, which are to be estimated from
training data. Hence, for small sample sizes and
high-dimensional data, singularities of these matri-
ces are problematic. RDA applies regularization and
shrinkage procedures to the class covariance matrix
Figure 4: Single-trial EEG data at channel Cz corresponding
to the target response (top) and distractor response (bottom) for
a 1 second window.
estimates in an attempt to minimize problems asso-
ciated with singularities. The shrinkage procedure
makes the class covariances closer to the overall data
covariance, and therefore to each other, thus mak-
ing the quadratic boundary more similar to a linear
boundary. Shrinkage is applied as
ˆ
Σ
c
(λ) = (1 − λ)
ˆ
Σ
c
+ λ
ˆ
Σ, (1)
where λ is the shrinkage parameter,
ˆ
Σ
c
is the class
covariance matrix estimated for class c ∈ {0, 1},
c = 0 corresponds to the non-target class, c = 1 cor-
responds to the target class, and
ˆ
Σ is the weighted
average of class covariance matrices. Regularization
is administered as
ˆ
Σ
c
(λ, γ) = (1 − γ)
ˆ
Σ
c
(λ) +
γ
d
tr[
ˆ
Σ
c
(λ)]I, (2)
where γ is the regularization parameter, tr[·] is the
trace function, and d is the dimension of the data
vector.
After carrying out the regularization and shrink-
age on the estimated covariance matrices, the
Bayesian classification rule (Duda et al., 2001) is
applied by comparing the log-likelihood ratio (using
40
Figure 5: Timing of stimulus sequence presentation
the posterior probability distributions) with a confi-
dence threshold. The confidence threshold can be
chosen so that the system incorporates the relative
risks or costs of making an error for each class. The
corresponding log-likelihood ratio is given by
δ
RDA
(x) = log
f
N
(x;
ˆ
µ
1
,
ˆ
Σ
1
(λ, γ))ˆπ
1
f
N
(x;
ˆ
µ
0
,
ˆ
Σ
0
(λ, γ))ˆπ
0
, (3)
where µ
c
and ˆπ
c
are the estimates of the class means
and priors, respectively, x is the data vector to be
classified, and f
N
(x; µ, Σ) is the pdf of a multivari-
ate normal distribution.
The set of visual stimuli (letters plus two ex-
tra symbols, in our case) can be shown multiple
times to achieve a higher classification accuracy for
the EEG-based classifier. The information obtained
from showing the visual stimuli multiple times can
easily be combined by assuming the trials are sta-
tistically independent, as is commonly assumed in
EEG-based spellers
2
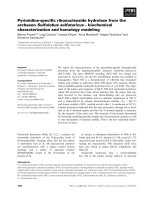
. Figure 5 presents a diagram of
the timing of the presentation of stimuli. We define
a sequence to be a randomly-ordered set of all the
letters (and the space and backspace symbols). The
letters are randomly ordered for each sequence be-
cause the magnitude of the ERP, hence the quality of
the EEG-based classification, is commonly thought
to depend on how surprised the user is to find the
intended letter. Our system also has a user-defined
parameter by which we are able to limit the max-
imum number of sequences shown to the user be-
fore our system makes a decision on the (single) in-
tended letter. Thus we are able to operate in single-
trial or multi-trial mode. We use the term epoch to
denote all the sequences that are used by our sys-
tem to make a decision on a single, intended let-
2
The typical number of repetitions of visual stimuli is on the
order of 8 or 16, although g.tec claims one subject is able to
achieve reliable operation with 2 trials (verbal communication).
ter. As can be seen in the timing diagram shown
in Figure 5, epoch k contains between 1 and M
k
sequences. This figure shows the onset of each se-
quence, each fixation image (which is shown at the
beginning of each sequence), and each letter using
narrow pulses. After each sequence is shown, the
cumulative (overall) score for all letters is computed.
The cumulative scores are non-negative and sum to
one (summing over the 28 symbols). If the num-
ber of sequences shown is less than the user-defined
limit and if the maximum cumulative score is less
than 0.9, then another randomly-ordered sequence is
shown to the user. Likewise, if either the maximum
number of sequences has already been shown or if
the maximum cumulative score equals or exceeds
0.9, then the associated symbol (for all symbols ex-
cept the backspace) is added to the end of the list
of previously-detected symbols, the user is able to
take a break of indefinite length, and then the system
continues with the next epoch. If the symbol hav-
ing the maximum cumulative score is the backspace
symbol, then the last item in the list of previously-
detected symbols is removed and, like before, the
user can take a break and then the system continues
with the next epoch.
3 Language Modeling
Language modeling is important for many text pro-
cessing applications, e.g., speech recognition or ma-
chine translation, as well as for the kind of typ-
ing application being investigated here (Roark et al.,
2010). Typically, the prefix string (what has al-
ready been typed) is used to predict the next sym-
bol(s) to be typed. The next letters to be typed be-
come highly predictable in certain contexts, partic-
ularly word-internally. In applications where text
generation/typing speed is very slow, the impact
of language modeling can become much more sig-
nificant. BCI-spellers, including the RSVP Key-
board paradigm presented here, can be extremely
low-speed, letter-by-letter writing systems, and thus
can greatly benefit from the incorporation of proba-
bilistic letter predictions from an accurate language
model.
For the current study, all language models were
estimated from a one million sentence (210M char-
acter) sample of the NY Times portion of the English
Gigaword corpus. Models were character n-grams,
estimated via relative frequency estimation. Corpus
normalization and smoothing methods were as de-
scribed in Roark et al. (2010). Most importantly for
41
Figure 6: Block diagram of system architecture.
this work, the corpus was case normalized, and we
used Witten-Bell smoothing for regularization.
4 System Architecture
Figure 6 shows a block diagram of our system. We
use a Quad-core, 2.53 GHz laptop, with system code
written in Labview, Matlab, and C. We also use
the Psychophysics Toolbox
3
to preload the images
into the video card and to display the images at
precisely-defined temporal intervals. The type UB
g.USBamp EEG-signal amplifier, which is manufac-
tured by g.tec (Austria), has 24 bits of precision and
has 16 channels. We use a Butterworth bandpass fil-
ter of 0.5 to 60 Hz, a 60 Hz notch filter, a sampling
rate of 256 Hz, and we buffer the EEG data until we
have 8 samples of 16-channel EEG data, at which
point the data are transmitted to the laptop. We
use either g.BUTTERfly or g.LADYbird active elec-
trodes, a g.GAMMA cap, and the g.GAMMAsys ac-
tive electrode system.
The output of the amplifier is fed to the laptop via
a USB connection with a delay that is both highly
variable and unknown a priori. Consequently, we
are unable to rely on the laptop system clock in or-
der to synchronize the EEG data and the onset of
the visual stimuli. Instead, synchronization between
the EEG data and the visual stimuli is provided by
sending a parallel port trigger, via an express card-
to-parallel port adaptor, to one of the digital inputs
of the amplifier, which is then digitized along with
the EEG data. The parallel port to g.tec cable was
custom-built by Cortech Solutions, Inc. (Wilming-
ton, North Carolina, USA). The parallel port trigger
is sent immediately after the laptop monitor sends
the vertical retrace signal. The mean and the stan-
3
/>dard deviation of the delay needed to trigger the par-
allel port has been measured to be on the order of
tens of microseconds, which should be sufficiently
small for our purposes.
5 Results
Here we report data collected from 2 subjects, one
of whom is a LIS subject with very limited experi-
ence using our BCI system, and the other a healthy
subject with extensive experience using our BCI sys-
tem. The symbol duration was set to 400 ms, the
duty cycle was set to 50%, and the maximum num-
ber of sequences per trial was set to 6. Before test-
ing, the classifier of our system was trained on data
obtained as each subject viewed 50 symbols with 3
sequences per epoch (the classifier was trained once
for the LIS subject and once for the healthy sub-
ject). The healthy subject was specifically instructed
to neither move nor blink their eyes, to the extent
possible, while the symbols are being flashed on the
screen in front of them. Instead, they were to wait
until the rest period, which occurs after each epoch,
to move or to blink. The subjects were free to pro-
duce whatever text they wished. The only require-
ment given to them concerning the chosen text was
that they must not, at any point in the experiment,
change what they are planning to type and they must
correct all mistakes using the backspace symbol.
Figure 7 shows the results for the non-expert,
LIS subject. A total of 10 symbols were correctly
typed by this subject, who had chosen to spell,
“THE STEELERS ARE GOING TO ”. Notice
that the number of sequences shown exceeds the
maximum value of 6 for 3 of the symbols. This
occurs when the specified letter is mistyped one or
more times. For example, for each mistyped non-
backspace symbol, a backspace is required to delete
42
T H E _ S T E E L E
0
5
10
15
20
25
30
35
40
45
No. of sequences to reach confidence threshold
Mean = 144/10 = 14.4 (seq/desired symbol)
Mean = 5.1 (seq/symbol)
Figure 7: Number of sequences to reach the confidence thresh-
old for the non-expert, LIS subject.
T H E _ L A K E R S _ A R E _ I N _ F I
0
5
10
15
20
25
30
35
40
45
No. of sequences to reach confidence threshold
Mean = 28/20 = 1.4 (seq/desired symbol)
Mean = 1.4 (seq/symbol)
Figure 8: Number of sequences to reach the confidence thresh-
old for the expert, healthy subject.
the incorrect symbol. Likewise, if a backspace sym-
bol is detected although it was not the symbol that
the subject wished to type, then the correct symbol
must be retyped. As shown in the figure, the mean
number of sequences for each correctly-typed sym-
bol is 14.4 and the mean number of sequences per
symbol is 5.1 (the latter of which has a maximum
value of 6 in this case).
Figure 8 shows the result for the expert, healthy
subject. A total of 20 symbols were cor-
rectly typed by this subject, who had chosen to
spell, “THE LAKERS ARE IN FIRST PLACE”.
The mean number of sequences for each correctly-
typed symbol for this subject is 1.4 and the mean
number of sequences per symbol is also 1.4. Notice
that in 15 out of 20 epochs the classifier was able to
detect the intended symbol on the first epoch, which
corresponds to a single-trial presentation of the sym-
bols, and no mistakes were made for any of the 20
symbols.
There are two obvious explanations as to why the
healthy subject performed better than the LIS sub-
ject. First, it is possible that the healthy subject was
using a non-neural signal, perhaps an electromyo-
graphic (EMG) signal stemming from an unintended
muscle movement occurring synchronously with the
target onset. Second, it is also possible that the LIS
subject needs more training in order to learn how
to control the system. We believe the second ex-
planation is correct and are currently taking steps
to make sure the LIS subject has additional time to
train on our system in hopes of resolving this ques-
tion quickly.
Acknowledgments
This work is supported by NSF under grants
ECCS0929576, ECCS0934506, IIS0934509,
IIS0914808, BCS1027724 and by NIH under grant
1R01DC009834-01. The opinions presented here
are those of the authors and do not necessarily
reflect the opinions of the funding agencies.
References
J D. Bauby. 1997. The Diving Bell and the Butterfly.
Knopf, New York.
R.O. Duda, P.E. Hart, and D.G. Stork. 2001. Pattern
classification. Citeseer.
L.A. Farwell and E. Donchin. 1988. Talking off the
top of your head: toward a mental prosthesis utiliz-
ing event-related brain potentials. Electroenceph Clin.
Neurophysiol., 70:510–523.
J.H. Friedman. 1989. Regularized discriminant analy-
sis. Journal of the American statistical association,
84(405):165–175.
G. Pfurtscheller, C. Neuper, C. Guger, W. Harkam,
H. Ramoser, A. Schlogl, B. Obermaier, and M. Pre-
genzer. 2000. Current trends in Graz brain-computer
interface (BCI) research. IEEE Transactions on Reha-
bilitation Engineering, 8(2):216–219.
B. Roark, J. de Villiers, C. Gibbons, and M. Fried-Oken.
2010. Scanning methods and language modeling for
binary switch typing. In Proceedings of the NAACL
HLT 2010 Workshop on Speech and Language Pro-
cessing for Assistive Technologies, pages 28–36.
H. Serby, E. Yom-Tov, and G.F. Inbar. 2005. An im-
proved P300-based brain-computer interface. Neural
Systems and Rehabilitation Engineering, IEEE Trans-
actions on, 13(1):89–98.
M.S. Treder and B. Blankertz. 2010. (C) overt atten-
tion and visual speller design in an ERP-based brain-
computer interface. Behavioral and Brain Functions,
6(1):28.
J.R. Wolpaw, N. Birbaumer, D.J. McFarland,
G. Pfurtscheller, and T.M. Vaughan. 2002. Brain-
computer interfaces for communication and control.
Clinical neurophysiology, 113(6):767–791.
J.R. Wolpaw. 2007. Brain–computer interfaces as new
brain output pathways. The Journal of Physiology,
579(3):613.
43