Tài liệu Báo cáo khoa học: "Generating research websites using summarisation techniques" pptx
Bạn đang xem bản rút gọn của tài liệu. Xem và tải ngay bản đầy đủ của tài liệu tại đây (376.41 KB, 4 trang )
Proceedings of the ACL-08: HLT Demo Session (Companion Volume), pages 5–8,
Columbus, June 2008.
c
2008 Association for Computational Linguistics
Generating research websites using summarisation techniques
Advaith Siddharthan & Ann Copestake
Natural Language and Information Processing Group
Computer Laboratory, University of Cambridge
{as372,aac10}@cl.cam.ac.uk
Abstract
We describe an application that generates web
pages for research institutions by summarising
terms extracted from individual researchers’
publication titles. Our online demo covers all
researchers and research groups in the Com-
puter Laboratory, University of Cambridge.
We also present a novel visualisation interface
for browsing collaborations.
1 Introduction
Many research organisations organise their websites
as a tree (e.g., department pages → research group
pages → researcher pages). Individual researchers
take responsibility for maintaining their own web
pages and, in addition, researchers are organised
into research groups that also maintain a web page.
In this framework, information easily gets outdated,
and publications lists generally stay more up-to-date
than research summaries. Also, as individuals main-
tain their own web pages, connections between re-
searchers in the organisation are often hard to find;
a surfer then needs to move up and down the tree
hierarchy to browse the profiles of different peo-
ple. Browsing is also diffcult because individual
web pages are organised differently, since standard-
ised stylesheets are often considered inappropriate
for diverse organisations.
Research summary pages using stylesheets can
offer alternative methods of information access and
browsing, aiding navigation and providing different
views for different user needs, but these are time-
consuming to create and maintain by hand. We are
exploring the idea of automatically generated and
updated web pages that accurately reflect the re-
search interests being pursued within a research in-
stitution. We take as input existing personal pages
from the Computer Laboratory, University of Cam-
bridge, that contain publication lists in html. In
our automatically generated pages, content (a re-
search summary) is extracted from publication ti-
tles, and hence stays up-to-date provided individ-
ual researchers maintain their publication lists. Note
that publication information is increasingly avail-
able through other sources, such as Google Scholar.
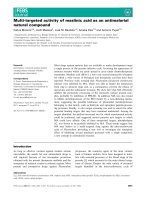
We aim to format information in a way that facil-
itates browsing; a screen shot is shown in Figure 1
for the researcher Frank Stajano, who is a member
of the Security and DTG research groups. The left
of the page contains links to researchers of the same
research groups and the middle contains a research
profile in the form of lists of key phrases presented
in five year intervals (by publication date). In addi-
tion, the right of the page contains a list of recom-
mendations: other researchers with similar research
interests. Web pages for research groups are created
by summarising the research profiles of individual
members. In addition, we present a novel interactive
visualisation that we have developed for displaying
collaborations with the rest of the world.
In this paper we describe our methodology for
identifying terms, clustering them and then creating
research summaries (§2) and a generative sum-
mariser of collaborations (§4) that plugs into a novel
visualisation (§3). An online demo is available at:
/>2 Summarising research output
Our program starts with a list of publications ex-
tracted from researcher web pages; for example:
• S. Teufel. 2007. An Overview of evaluation meth-
ods in TREC Ad-hoc Information Retrieval and TREC
Question Answering. In Evaluation of Text and Speech
Systems. L. Dybkjaer, H. Hemsen, W. Minker (Eds.)
Springer, Dordrecht (The Netherlands).
5
From each publication entry such as that above,
the program extracts author names, title and year of
publication. This is the only information used. We
do not use the full paper, as pdfs are not available for
all papers in publication pages (due to copyright and
other issues). The titles are then parsed using the
RASP parser (Briscoe and Carroll, 2002) and key-
phrases are extracted by pattern matching. From the
publication entry above, the extracted title:
“An overview of evaluation methods in TREC ad-hoc
information retrieval and TREC question answering”
produces five key-phrases:
‘evaluation methods’, ‘evaluation methods in TREC
ad-hoc information retrieval’, ‘TREC ad-hoc infor-
mation retrieval’, ‘TREC question answering’, ‘infor-
mation retrieval’
Figure 1: Screenshot: researcher web page.
/>Stajano.html
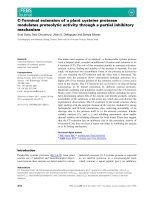
Figure 2: Screenshot: research group web page.
/>2.1 Individual researcher summaries
To create a web page for an individual researcher,
the key-phrases extracted from all the paper titles
authored by that researcher are clustered together
based on similarity - an example cluster is shown
below (from Karen Sparck Jones’ profile):
‘automatic classification for information retrieval’,
‘intelligent automatic information retrieval’, ‘infor-
mation retrieval test collections’, ‘information re-
trieval system’, ‘automatic classification’, ‘intelligent
retrieval’, ‘information retrieval’, ‘information sci-
ence’, ‘test collections’, ‘mail retrieval’, ‘trec ad-hoc
information retrieval’
A representative phrase (most similar to others in
the cluster) is selected from each cluster (‘informa-
tion retrieval’ from the above) and this phrase is
linked with all the publication dates for papers the
terms in the cluster come from. These extracted key-
phrases are enumerated as lists in five year intervals;
for example (from Karen Sparck Jones’ profile):
1990–1994: ‘information retrieval’; ‘document re-
trieval’; ‘video mail retrieval’; ‘automatic summari-
sation’; ‘belief revision’; ‘discourse structure’; ‘cam-
bridge/olivetti retrieval system’; ‘system architec-
ture’; ‘agent interaction’; ‘better NLP system evalua-
tion’; ‘early classification work’; ‘text retrieval’; ‘dis-
course modelling’ ;
2.2 Recommendations (related people)
Recommendations for related people are generated
by comparing the terms extracted between 2000 and
2008 for each researcher in the Computer Labora-
tory. The (at most) seven most similar researchers
are shown in tabular form along with a list of terms
from their profiles that are relevant to the researcher
being viewed. These term lists inform the user as to
why they might find the related people relevant.
2.3 Research Group Pages
Group pages are produced by summarising the pages
of members of the group. Terms from individual
research profiles are clustered according to who is
working on them (gleaned from the author lists of
the the associated paper title). The group page is pre-
sented as a list of clusters. This presentation shows
how group members collaborate, and for each term
shows the relevant researchers, making navigation
6
easier. Two clusters for the Graphics and Interaction
(Rainbow) Group are show below to illustrate:
‘histogram warping’; ‘non-uniform b-spline subdi-
vision’; ‘stylised rendering’; ‘multiresolution im-
age representation’; ‘human behaviour’; ‘subdivi-
sion schemes’; ‘minimising gaussian curvature vari-
ation near extraordinary vertices’; ‘sampled cp sur-
faces’; ‘bounded curvature variants’: Neil Dodgson;
Thomas Cashman; Ursula Augsdorfer;
‘text for multiprojector tiled displays’; ‘tabletop in-
terface’; ‘high-resolution tabletop applications’; ‘dis-
tributed tabletops’; ‘remote review meetings’; ‘rapid
prototyping’: Peter Robinson; Philip Tuddenham;
3 Visualisation
Scalable Vector Graphics (SVG)
1
is a language for
describing two-dimensional graphics and graphical
applications in XML. Interactive images such as
those in Figure 3 are produced by an XSLT script
that transforms an input XML data file containing
information about collaborations and latitudes and
longitudes of cities and countries into an SVG rep-
resentation
2
. This can be viewed through an Adobe
Browser Plugin
3
. In the map, circles indicate the lo-
cations of co-authors of members of the NLIP re-
search group, their size being proportional to the
number of co-authors at that location. The map can
be zoomed into, and at sufficient zoom, place names
are made visible. Clicking on a location (circle) pro-
vides a summary of the collaboration (the summari-
sation is described in §4), while clicking on a coun-
try (oval) provides a contrywise overview such as:
In the Netherlands, the NLIP Group has collabora-
tors in Philips Research (Eindhoven), University of
Twente (Enschede), Vrije Universiteit (VU) (Amster-
dam) and University of Nijmegen.
4 Summarising collaborations
Our summarisation module slots into the visualisa-
tion interface; an example is shown in Figure 4. The
aim is to summarise the topics that members of the
research group collaborate with the researchers in
1
/>2
Author Affiliations and Latitudes/Longitudes are semi-
automatically extracted from the internet and hand corrected.
The visualisation is only available for some research groups.
3
/>Figure 3: Screenshot: Visualisation of Collaboration be-
tween the NLIP Group and the rest of the world
Figure 4: Screenshot: Visualisation of Collaborations of
ARG Group; zoomed into Europe and having clicked on
Catonia (Italy) for a popup summary
each location on. The space constraints are dic-
tated by the interface. To keep the visualisation
clean, we enforce a four sentence limit for the sum-
maries. There are four elements that each sentence
contains— names of researchers in research group,
names of researchers at location, terms that sum-
marise the collaboration, and years of collaboration.
Our summaries are produced by an iterative pro-
cess of clustering and summarising. In the first step,
terms (key phrases) are extracted from all the papers
that have co-authors in the location. Each term is
tagged with the year(s) of publication and the names
of researchers involved. These terms are then clus-
tered based on the similarity of words in the terms
and the similarity of their authors. Each such clus-
ter contributes one sentence to the summary. The
clustering process is pragmatic; the four sentence
per summary limit means that at most four clusters
should be formed. This means coarser clustering
(fewer and larger clusters) for locations with many
collaborations and finer-grained (more and smaller
clusters) for locations with fewer collaborations.
The next step is to generate a sentence from each
cluster. In this step, the terms in a sentence clus-
ter are reclustered according to their date tag. then
each time period is realised separately within the
sentence, for example:
7
Lawrence C Paulson collaborated with Cristiano
Longo and Giampaolo Bella from 1997 to 2003 on
‘formal verification’, ‘industrial payment and non-
repudiation protocol’, ‘kerberos authentication sys-
tem’ and ‘secrecy goals’ and in 2006 on ‘cardholder
registration in Set’ and ‘accountability protocols’.
To make the summaries more readable, lists of
conjunctions are restricted to a maximum length of
four. Terms are incorporated into the list in decreas-
ing order of frequency of occurrence. Splitting the
sentence above into two time periods allows for the
inclusion of more terms, without violating the re-
striction on list length. This form of sentence split-
ting is also pragmatic and is performed more aggres-
sively in summaries with fewer sentences, having
the effect of making short summaries slightly longer.
Another method for increasing the number of terms
is by aggregating similar terms. In the example be-
low, three terms (video mail retrieval, information
retrieval and document retrieval) are aggregated into
one term. Thus six terms have made it to the clause,
while keeping to the four terms per list limit.
In the mid 1990s, K Sparck Jones, S J Young and
M G Brown collaborated with J T Foote on ‘video
mail, information and document retrieval’, ‘cam-
bridge/olivetti retrieval system’, ‘multimedia docu-
ments’ and ‘broadcast news’.
The four word limit is also enforced on lists of
people. If there are too many people, the program
refers to them by affiliation; for example:
Joe Hurd collaborated with University of Utah on
‘theorem proving’, ‘encryption algorithms’, ‘func-
tional correctness proofs’ and ‘Arm verification’.
5 Discussion and Conclusions
Our summarisation strategy mirrors the multi-
document summarisation strategy of Barzilay
(2003), where sentences in the input documents are
clustered according to their similarity. Larger clus-
ters represent information that is repeated more of-
ten; hence the size of a cluster is indicative of im-
portance. The novelty of our application is that this
strategy has been used at a sub-sentential level, to
summarise terms that are then used to generate sen-
tences. While there has been research on generative
summarisation, much of this has been focused on
sentence extraction followed by some rewrite oper-
ation (e.g., sentence shortening (Vanderwende et al.,
2007; Zajic et al., 2006; Conroy et al., 2004), ag-
gregation (Barzilay, 2003) or reference regeneration
(Siddharthan et al., 2004; Nenkova and McKeown,
2003)). In contrast, our system does not extract sen-
tences at all; rather, it extracts terms from paper ti-
tles and our summaries are produced by clustering,
summarising, aggregating and generalising over sets
of terms and people. Our space constraints are dic-
tated by by our visualisation interface, and our pro-
gram employs pragmatic clustering and generalisa-
tion based on the amount of information it needs to
summarise.
Acknowledgements
This work was funded by the Computer Labora-
tory, University of Cambridge, and the EPSRC
(EP/C010035/1 and EP/F012950/1).
References
R. Barzilay. 2003. Information Fusion for Multidoc-
ument Summarization: Paraphrasing & Generation.
Ph.D. thesis, Columbia University.
E.J. Briscoe and J. Carroll. 2002. Robust accurate statis-
tical annotation of general text. In Proceedings of the
3rd International Conference on Language Resources
and Evaluation, pages 1499–1504, Las Palmas, Gran
Canaria.
J.M. Conroy, J.D. Schlesinger, J. Goldstein, and D.P.
O’Leary. 2004. Left-brain/right-brain multi-
document summarization. Proceedings of DUC 2004.
A. Nenkova and K. McKeown. 2003. References to
named entities: a corpus study. Companion pro-
ceedings of HLT-NAACL 2003–short papers-Volume 2,
pages 70–72.
A. Siddharthan, A. Nenkova, and K. McKeown. 2004.
Syntactic simplification for improving content selec-
tion in multi-document summarization. In Proceed-
ings of the 20th International Conference on Compu-
tational Linguistics (COLING 2004), pages 896–902,
Geneva, Switzerland.
L. Vanderwende, H. Suzuki, C. Brockett, and
A. Nenkova. 2007. Beyond SumBasic: Task-
focused summarization with sentence simplification
and lexical expansion. Information Processing and
Management, 43(6):1606–1618.
D. Zajic, B. Dorr, J. Lin, and R. Schwartz. 2006.
Sentence Compression as a Component of a Multi-
Document Summarization System. Proceedings of the
2006 Document Understanding Workshop, New York.
8