Quantitative chemical analysis 9e by daniel c harris
Bạn đang xem bản rút gọn của tài liệu. Xem và tải ngay bản đầy đủ của tài liệu tại đây (31.15 MB, 998 trang )
1
Periodic Table
+1
1
20
14
Ô
0.0888
H
+1
3
1615
454
0.53
Li
Lithium
6.968 30
1156
371
0.97
+2
4
2745
1560
1.85
Density at 300 K
(g /cm3 )
+2
12
Na Mg
1032
336
0.86
K
Potassium
39.098 3
38
Rb
1650
1041
2.6
Rubidium
85.467 8 ±3
944
302
1.87
56
Cs
2171
1002
3.5
Cesium
132.905 451 9 ±2
+1
87
950
300
—–
Fr
Francium
(223)
Ca
3104
1812
3.0
+2
Sr
3611
1799
4.5
Ba
3730
1193
6.7
+3
Y
89
Ra
3473
1323
10.07
Atomic mass with uncertainty in last digit
Example: Fe = 55.845 ± 0.002
Uncertainty in last digit is ±1
if no uncertainty is indicated
Numbers in parentheses are
longest-lived isotope
23
3682
2175
5.8
6
+5,4,3,2
24
V
2945
2130
7.19
Vanadium
50.941 5
+4
Zr
Zirconium
91.224 ±2
La
Actinium
(227)
Ti
4682
2125
6.49
4876
2500
13.1
Ac
+4,3
40
72
+3
5
Titanium
47.867
+3
Lanthanum
138.905 47 ±7
+2
Radium
(226)
Sc
3562
1943
4.50
Yttrium
88.905 85 ±2
57
Barium
137.327 ±7
1809
973
5
22
39
+2
88
+3
Scandium
44.955 912 ±6
Strontium
87.62
+1
55
21
Calcium
40.078 ±4
+1
37
961
313
1.53
1757
1112
1.55
4
3
+2
20
Fe
Atomic masses from
See Box 3-3 for explanation of atomic mass values used in this table
Sodium
Magnesium
22.989 769 28 ±2 24.305 0 ±6
+1
Common oxidation states
Iron
55.845 2
(Densities marked
with Ô are at 273K
and 1 bar and the
units are g/L)
1363
922
1.74
19
3135
1809
7.86
Melting point (K)
Be
+2,3
26
Boiling point (K)
Beryllium
9.012 182 ±3
+1
11
Atomic Number
2
Hydrogen
1.007 98 ±14
+4
Hf
Hafnium
178.49 ±2
+5,3
+6,3,2
Cr
Chromium
51.996 1 ±6
25
2335
1517
7.43
43
Nb Mo
4538
2473
11.5
42
4912
2890
10.2
Molybdenum
Niobium
95.96 ±2
92.906 38 ±2
+5
74
Ta
5828
3680
19.3
73
5731
3287
16.6
Tantalum
180.947 88 ±2
+7,6,4,2,3
75
W
5869
3453
21.0
9
+2,3
26
3135
1809
7.86
Mn Fe
+7
Iron
55.845 ±2
44
4423
2523
12.2
Technetium
(98)
+6,5,4,3,2
Tungsten
183.84
8
Manganese
54.938 045 ±5
+6,5,4,3,2
41
5017
2740
8.55
7
+7,6,4,2,-1
27
+2,3
3201
1768
8.90
Co
Cobalt
58.933 195 ±5
+2,3,4,6,8
45
+2,3,4
Ru
3970
2236
12.4
Rh
Ruthenium
101.07 ±2
Rhodium
102.905 50 ±2
+2,3,4,6,8
77
+2,3,4,6
Re Os
4701
2716
22.5
Ir
76
5285
3300
22.4
Rhenium
186.207
Osmium
190.23 ±3
Iridium
192.217 ±3
104
105
106
107
108
109
—–
—–
—–
—–
—–
—–
—–
—–
—–
—–
—–
—–
—–
—–
—–
—–
—–
—–
Rutherfordium
(267)
58
3699
1071
6.78
+3,4
59
Ce
3785
1204
6.77
Cerium
140.116
90
5061
2028
11.7
Dubnium
(268)
+3,4
Pr
Seaborgium
(271)
+3
61
Nd
3785
1204
6.48
60
3341
1289
7.00
Praseodymium Neodymium
140.907 65 ±2 144.242 ±3
+4
91
Th
—–
—–
15.4
+5,4
92
Pa
4407
1405
18.9
Bohrium
(270)
+3
93
U
—–
910
20.4
62
2064
1345
7.54
Promethium
(145)
+6,5,4,3
Thorium
Protactinium
Uranium
232.038 06 ±2 231.035 88 ±2 238.028 91 ±3
Hassium
(277)
+6,5,4,3
Neptunium
(237)
+3,2
Sm
Samarium
150.36 ±2
94
+6,5,4,3
3503
913
19.8
Plutonium
(244)
Meitnerium
(276)
63
+3,2
1870
1090
5.26
Eu
Europium
151.964
95
+6,5,4,3
2880
1268
13.6
Americium
(243)
18
of the Elements
10
3187
1726
8.90
11
+2,3
28
Ni
3237
1825
12.0
47
Pd
2436
1234
10.5
+2,4
4100
2045
21.4
Pt
Platinum
195.084 ±9
+2,1
30
Cu
1180
693
7.14
48
Ag
1040
594
8.65
Silver
107.868 2 ±2
79
3130
1338
19.3
+3,1
Au
Gold
196.966 569 ±4
111
110
—–
—–
—–
4275
2300
2.34
2793
933
2.70
630
234
13.5
31
Zn
2478
303
5.91
+2
49
Cd
2346
430
7.31
Hg
Mercury
200.59 ±2
+3
3539
1585
7.89
Gd
65
3496
1630
8.27
+3,4
66
Tb
2835
1682
8.54
+3,1
Tl
113
—–
—–
—–
67
Dy
2968
1743
8.80
—–
1340
13.5
Curium
(247)
+3
97
+4,3
—–
—–
—–
Berkelium
(247)
98
+3
550
317
1.82
Ho
3136
1795
9.05
99
—–
900
—–
—–
—–
—–
Californium
(251)
Einsteinium
(252)
±3,5
As
Arsenic
74.921 60 2
+4,2
83
Pb
1837
545
9.8
Er
Erbium
167.259 3
100
Fermium
(257)
S
Sulfur
32.068 9
34
958
494
4.80
-2,4,6
Se
Selenium
78.96 3
-2,4,6
Te
Tellurium
127.60 3
84
1235
527
9.4
+4,2
Po
Polonium
(209)
17
239
172
Ô
3.12
Tm
Thulium
168.934 21 2
70
1467
1097
6.98
Cl
87
84
Ô
1.760
1,5
332
266
3.12
Br
Bromine
79.904
458
387
4.92
Iodine
126.904 47 3
610
575
118
(294)
Yb
Lu
Nobelium
(259)
Rn
Radon
(222)
3668
1936
9.84
Lutetium
174.966 8
Xe
Xenon
131.293 6
At
+3
103
Kr
54
211
202
Ô
9.78
71
120
116
Ô
3.69
86
(294)
102
36
1,3,5,7
Astatine
(210)
Argon
39.948
165
161
Ô
5.78
I
85
Ar
Krypton
83.798 2
1,5,7
53
Ne
Neon
20.179 7 6
18
35
101
Mendelevium
(260)
27
25
0.889 Ô
1,3,5,7
+3,2
Ytterbium
173.054 5
10
Chlorine
35.452 6
Livermorium
(293)
+3,2
F
117
(288)
2220
1818
9.33
2,4,6
116
115
69
718
388
2.07
Sb
Bismuth
208.980 40
+3
16
1261
723
6.24
Bi
O
-1
9
85
53
Ô
1.674
He
Helium
4.002 602 2
Oxygen
Fluorine
15.999 4 4 18.998 403 2 5
52
+3,5
17
-2
3,5
Antimony
121.760
Flerovium
(289)
68
P
876
5.72
Sn
Lead
207.2
+3
N
90
50
1.410 Ô
33
1860
904
6.68
82
8
3,5,4
15
16
3,5,4,2
Nitrogen
14.006 8 4
51
Tin
118.710 7
2023
601
11.4
77
63
1.234 ¤
+4,2
50
—–
—–
—–
Gadolinium
Terbium
Dysprosium
Holmium
162.500
157.25 ±3
158.925 35 ±2
164.930 32 ±2
96
Ge
114
(284)
+3
+4
2876
505
7.30
7
Phosphorus
30.973 762 ±2
Germanium
72.63
Thallium
204.384 ±2
Darmstadtium Roentgenium Copernicium
(281)
(280)
(285)
64
Ga
Indium
114.818 3
1746
577
11.85
Si
Silicon
28.085
3107
1210
5.32
In
81
3540
1685
2.33
32
+3
+2,1
+4
14
+3
Gallium
69.723
112
Al
Aluminum
26.981 538 6 8
+2
C
Carbon
12.010 6 10
+3
13
Cadmium
112.411 8
80
B
4.2
0.95
Ô
0.176
15
4,2
6
4470
4100
2.62
Boron
10.814 8
Zinc
65.38 2
+1
14
+3
5
12
Copper
63.546 ±3
+2,4
Palladium
106.42
78
29
2836
1358
8.96
Nickel
58.693 4 ±4
46
13
Atomic Mass Interval
[1.007 84; 1.008 11]
[6.938; 6.997]
[10.806; 10.821]
[12.009 6; 12.011 6]
[14.006 43; 14.007 28]
[15.999 03; 15.999 77]
[28.084; 28.086]
[32.059; 32.076]
[35.446; 35.457]
[204.382; 204.385]
H
Li
B
C
N
O
Si
S
Cl
Tl
2
Lawrencium
(262)
Quantitative Chemical Analysis
[© 1963 by Sempé and Éditions Denoël.]
Quantitative
Chemical Analysis
Nint h Edit ion
Daniel C. Harris
Michelson Laboratory, China Lake, California
Charles A. Lucy
Contributing Author
University of Alberta, Edmonton, Alberta
Publisher: Kate Parker
Senior Acquisitions Editor: Lauren Schultz
Development Editors: Brittany Murphy, Anna Bristow
Editorial Assistant: Shannon Moloney
Photo Editor: Cecilia Varas
Photo Researcher: Richard Fox
Cover and Text Designer: Vicki Tomaselli
Project Editor: J. Carey Publishing Service
Manuscript Editor: Marjorie Anderson
Illustrations: Network Graphics, Precision Graphics
Illustration Coordinators: Matthew McAdams, Janice Donnola
Production Coordinator: Julia DeRosa
Composition and Text Layout: Aptara®, Inc.
Printing and Binding: RR Donnelley
Front Cover/Title Page Photo Credit: © The Natural History Museum/The Image Works
Back Cover Photo Credit: Pascal Goetgheluck/Science Source
Library of Congress Control Number: 2014950382
ISBN-13: 978-1-4641-3538-5
ISBN-10: 1-4641-3538-X
© 2016, 2010, 2007, 2003 by W. H. Freeman and Company
All rights reserved
Printed in the United States of America
First Printing
W. H. Freeman and Company
41 Madison Avenue
New York, NY 10010
www.whfreeman.com
B R I E F C O N TE N TS
0 The Analytical Process
1
1 Chemical Measurements
10
2 Tools of the Trade
24
3 Experimental Error
46
4 Statistics
64
5 Quality Assurance and
Calibration Methods
95
6 Chemical Equilibrium
119
7 Let the Titrations Begin
145
8 Activity and the Systematic
Treatment of Equilibrium
161
187
18 Fundamentals of
Spectrophotometry
432
19 Applications of
Spectrophotometry
461
20 Spectrophotometers
491
21 Atomic Spectroscopy
529
22 Mass Spectrometry
559
23 Introduction to Analytical
Separations
24 Gas Chromatography
604
633
Chromatography
667
26 Chromatographic Methods
10 Polyprotic Acid-Base
Equilibria
395
25 High-Performance Liquid
9 Monoprotic Acid-Base
Equilibria
17 Electroanalytical Techniques
211
and Capillary Electrophoresis
713
27 Gravimetric and Combustion
11 Acid-Base Titrations
233
12 EDTA Titrations
265
28 Sample Preparation
287
Notes and References
NR1
Glossary
GL1
Appendixes
AP1
Analysis
751
771
13 Advanced Topics in
Equilibrium
14 Fundamentals of
Electrochemistry
306
Solutions to Exercises
S1
338
Answers to Problems
AN1
374
Index
15 Electrodes and
Potentiometry
16 Redox Titrations
I1
v
this
page
left
intentionally
blank
CO NTE N TS
Connections: Maria Goeppert Mayer
Preface
xiv
xv
0 The Analytical Process
1
How Does a Home Pregnancy Test Work?
0-1 The Analytical Chemist’s Job
0-2 General Steps in a Chemical Analysis
1
2
8
BOX 0 -1 Constructing a Representative Sample
1 Chemical Measurements
Biochemical Measurements with a Nanoelectrode
1-1 SI Units
1-2 Chemical Concentrations
1-3 Preparing Solutions
1-4 Stoichiometry Calculations for
Gravimetric Analysis
2 Tools of the Trade
Quartz Crystal Microbalance Measures
One Base Added to DNA
2-1 Safe, Ethical Handling of Chemicals
and Waste
2-2 The Lab Notebook
2-3 Analytical Balance
2-4 Burets
2-5 Volumetric Flasks
2-6 Pipets and Syringes
2-7 Filtration
2-8 Drying
2-9 Calibration of Volumetric Glassware
2-10 Introduction to Microsoft Excel®
2-11 Graphing with Microsoft Excel
REFERENCE PROCEDURE Calibrating a 50-mL Buret
3 Experimental Error
Experimental Error
3-1 Significant Figures
3-2 Significant Figures in Arithmetic
3-3 Types of Error
8
10
10
10
13
16
18
24
24
25
25
26
29
31
32
36
37
38
39
42
45
46
46
46
47
49
3-4
3-5
Propagation of Uncertainty from
Random Error
Propagation of Uncertainty from
Systematic Error
BOX 3-3 Atomic Masses of the Elements
Is My Red Blood Cell Count High Today?
4-1 Gaussian Distribution
4-2 Comparison of Standard Deviations
with the F Test
50
51
52
64
64
65
69
BOX 4-1 Choosing the Null Hypothesis in
Epidemiology
4-3
4-4
4-5
4-6
4-7
4-8
Confidence Intervals
Comparison of Means with Student’s t
t Tests with a Spreadsheet
Grubbs Test for an Outlier
The Method of Least Squares
Calibration Curves
BOX 4-2 Using a Nonlinear Calibration Curve
4-9
A Spreadsheet for Least Squares
71
71
74
79
80
81
84
86
87
5 Quality Assurance and
Calibration Methods
The Need for Quality Assurance
5-1 Basics of Quality Assurance
95
95
96
BOX 5-1 Medical Implication of False
Positive Results
BOX 5-2 Control Charts
5-2
Method Validation
97
99
100
BOX 5-3 The Horwitz Trumpet: Variation in
Standard Addition
Internal Standards
104
106
109
6 Chemical Equilibrium
119
Interlaboratory Precision
5-3
5-4
Chemical Equilibrium in the Environment
6-1 The Equilibrium Constant
6-2 Equilibrium and Thermodynamics
6-3 Solubility Product
119
120
121
124
BOX 6-1 Solubility Is Governed by More Than the
Solubility Product
DEMONSTR ATION 6-1 Common Ion Effect
6-4
Complex Formation
BOX 6-2 Notation for Formation Constants
BOX 3-1 Case Study in Ethics: Systematic Error
in Ozone Measurement
BOX 3-2 Certified Reference Materials
4 Statistics
6-5
6-6
6-7
Protic Acids and Bases
pH
Strengths of Acids and Bases
DEMONSTR ATION 6-2 The HCl Fountain
125
125
126
127
129
132
133
134
BOX 6-3 The Strange Behavior of
58
59
Hydrofluoric Acid
BOX 6-4 Carbonic Acid
135
137
vii
7 Let the Titrations Begin
Titration on Mars
7-1 Titrations
BOX 7-1 Reagent Chemicals and Primary Standards
7-2
7-3
7-4
7-5
7-6
Titration Calculations
Precipitation Titration Curves
Titration of a Mixture
Calculating Titration Curves with a Spreadsheet
End-Point Detection
DEMONSTR ATION 7-1 Fajans Titration
145
145
145
147
147
149
153
154
155
156
8 Activity and the Systematic
Treatment of Equilibrium
Hydrated Ions
8-1 The Effect of Ionic Strength on
Solubility of Salts
161
161
162
162
Activity Coefficients
pH Revisited
Systematic Treatment of Equilibrium
BOX 8-2 Calcium Carbonate Mass Balance in Rivers
172
8-5
172
9 Monoprotic Acid-Base Equilibria
187
187
188
BOX 9-1 Concentrated HNO3 Is Only
Slightly Dissociated
9-2
9-3
Weak Acids and Bases
Weak-Acid Equilibria
188
190
191
BOX 9-2 Dyeing Fabrics and the Fraction
of Dissociation
9-4
9-5
Weak-Base Equilibria
Buffers
BOX 9-3 Strong Plus Weak Reacts Completely
DEMONSTR ATION 9-1 How Buffers Work
10 Polyprotic Acid-Base Equilibria
Carbon Dioxide in the Air
10-1 Diprotic Acids and Bases
BOX 10 -1 Carbon Dioxide in the Ocean
BOX 10 -2 Successive Approximations
10-2 Diprotic Buffers
10-3 Polyprotic Acids and Bases
10-4 Which Is the Principal Species?
viii
11 Acid-Base Titrations
Acid-Base Titration of RNA
11-1 Titration of Strong Base with Strong Acid
11-2 Titration of Weak Acid with Strong Base
11-3 Titration of Weak Base with Strong Acid
11-4 Titrations in Diprotic Systems
11-5 Finding the End Point with a
pH Electrode
BOX 11-1 Alkalinity and Acidity
11-6 Finding the End Point with Indicators
223
224
226
228
233
233
234
236
238
240
243
244
247
248
DEMONSTR ATION 11-1 Indicators and the
11-7 Practical Notes
11-8 Kjeldahl Nitrogen Analysis
249
251
251
BOX 11-3 Kjeldahl Nitrogen Analysis Behind
the Headlines
11-9 The Leveling Effect
11-10 Calculating Titration Curves with
Spreadsheets
252
253
254
REFERENCE PROCEDURE Preparing Standard Acid
Applying the Systematic Treatment
of Equilibrium
Measuring pH Inside Cellular Compartments
9-1 Strong Acids and Bases
10-6 Isoelectric and Isoionic pH
BOX 10 -4 Isoelectric Focusing
Acidity of CO2
164
164
168
169
8-2
8-3
8-4
BOX 10 -3 Microequilibrium Constants
BOX 11-2 What Does a Negative pH Mean?
DEMONSTR ATION 8-1 Effect of Ionic Strength on Ion
Dissociation
BOX 8-1 Salts with Ions of Charge ) $ 2 ) Do Not
Fully Dissociate
10-5 Fractional Composition Equations
194
195
196
199
201
211
211
212
214
217
219
220
222
and Base
12 EDTA Titrations
Chelation Therapy and Thalassemia
12-1 Metal-Chelate Complexes
12-2 EDTA
12-3 EDTA Titration Curves
12-4 Do It with a Spreadsheet
12-5 Auxiliary Complexing Agents
263
265
265
266
268
271
273
274
BOX 12-1 Metal Ion Hydrolysis Decreases
the Effective Formation Constant
for EDTA Complexes
12-6 Metal Ion Indicators
276
277
DEMONSTR ATION 12-1 Metal Ion Indicator Color
Changes
12-7 EDTA Titration Techniques
BOX 12-2 Water Hardness
13 Advanced Topics in Equilibrium
Acid Rain
13-1 General Approach to Acid-Base Systems
13-2 Activity Coefficients
13-3 Dependence of Solubility on pH
13-4 Analyzing Acid-Base Titrations with
Difference Plots
280
280
281
287
287
288
291
294
298
Contents
14 Fundamentals of
Electrochemistry
306
Lithium-Ion Battery
14-1 Basic Concepts
306
307
14-2 Galvanic Cells
DEMONSTR ATION 14-1 The Human Salt Bridge
BOX 14-2 Hydrogen-Oxygen Fuel Cell
BOX 14-3 Lead-Acid Battery
14-3 Standard Potentials
14-4 Nernst Equation
310
311
314
315
316
316
318
BOX 14-4 E° and the Cell Voltage Do Not Depend
on How You Write the Cell Reaction
BOX 14-5 Latimer Diagrams: How to Find E°
for a New Half-Reaction
14-5 E° and the Equilibrium Constant
BOX 14-6 Concentrations in the Operating Cell
14-6 Cells as Chemical Probes
14-7 Biochemists Use E°'
15 Electrodes and Potentiometry
DNA Sequencing by Counting Protons
15-1 Reference Electrodes
15-2 Indicator Electrodes
320
321
322
323
324
327
338
338
339
341
DEMONSTR ATION 15-1 Potentiometry with an
Oscillating Reaction
15-3 What Is a Junction Potential?
15-4 How Ion-Selective Electrodes Work
15-5 pH Measurement with a Glass Electrode
343
343
345
347
15-6 Ion-Selective Electrodes
353
354
BOX 15-2 Measuring Selectivity Coefficients for
an Ion-Selective Electrode
BOX 15-3 How Was Perchlorate Discovered on Mars?
BOX 15-4 Ion-Selective Electrode with Electrically
Conductive Polymer for a Sandwich
Immunoassay
15-7 Using Ion-Selective Electrodes
15-8 Solid-State Chemical Sensors
381
382
384
385
385
Oxygen Demand
386
BOX 16-3 Iodometric Analysis of High-Temperature
Superconductors
17 Electroanalytical Techniques
How Sweet It Is!
17-1 Fundamentals of Electrolysis
DEMONSTR ATION 17-1 Electrochemical Writing
BOX 17-1 Metal Reactions at Atomic Steps
17-2 Electrogravimetric Analysis
17-3 Coulometry
17-4 Amperometry
BOX 17-2 Clark Oxygen Electrode
BOX 17-3 What Is an “Electronic Nose”?
17-5 Voltammetry
BOX 17-4 The Electric Double Layer
BOX 17-5 Aptamer Biosensor for Clinical Use
17-6 Karl Fischer Titration of H2O
389
395
395
396
396
402
402
405
407
408
408
412
415
417
422
18 Fundamentals of
Spectrophotometry
432
The Ozone Hole
18-1 Properties of Light
18-2 Absorption of Light
432
433
434
BOX 18-1 Why Is There a Logarithmic Relation
BOX 15-1 Systematic Error in Rainwater pH
Measurement: Effect of Junction Potential
Adjustment of Analyte Oxidation State
Oxidation with Potassium Permanganate
Oxidation with Ce41
Oxidation with Potassium Dichromate
Methods Involving Iodine
BOX 16-2 Environmental Carbon Analysis and
BOX 14-1 Ohm’s Law, Conductance, and
Molecular Wire
16-3
16-4
16-5
16-6
16-7
355
359
361
363
364
Between Transmittance and Concentration? 436
DEMONSTR ATION 18-1 Absorption Spectra
18-3
18-4
18-5
18-6
Measuring Absorbance
Beer’s Law in Chemical Analysis
Spectrophotometric Titrations
What Happens When a Molecule
Absorbs Light?
BOX 18-2 Fluorescence All Around Us
18-7 Luminescence
BOX 18-3 Rayleigh and Raman Scattering
438
438
440
443
444
447
448
452
BOX 18-4 Designing a Molecule for Fluorescence
16 Redox Titrations
Chemical Analysis of High-Temperature
Superconductors
16-1 The Shape of a Redox Titration Curve
374
374
375
BOX 16-1 Many Redox Reactions Are Atom-Transfer
Reactions
16-2 Finding the End Point
376
378
DEMONSTR ATION 16-1 Potentiometric Titration
of Fe21 with MnO24
Contents
379
Detection
454
19 Applications of Spectrophotometry 461
Fluorescence Resonance Energy Transfer Biosensor
19-1 Analysis of a Mixture
19-2 Measuring an Equilibrium Constant
19-3 The Method of Continuous Variation
19-4 Flow Injection Analysis and Sequential
Injection
461
461
466
470
471
ix
19-5 Immunoassays
19-6 Sensors Based on Luminescence Quenching
BOX 19-1 Converting Light into Electricity
BOX 19-2 Upconversion
20 Spectrophotometers
Cavity Ring-Down Spectroscopy
20-1 Lamps and Lasers: Sources of Light
475
477
478
482
491
491
492
BOX 20 -1 Blackbody Radiation and the
Greenhouse Effect
20-2 Monochromators
20-3 Detectors
BOX 20 -2 The Most Important Photoreceptor
494
496
501
502
BOX 20 -3 Nondispersive Photoacoustic Infrared
Measurement of CO2 on Mauna Loa
20-4 Optical Sensors
20-5 Fourier Transform Infrared Spectroscopy
20-6 Dealing with Noise
21 Atomic Spectroscopy
An Anthropology Puzzle
21-1 An Overview
507
508
514
519
529
529
530
BOX 21-1 Mercury Analysis by Cold Vapor
Atomic Fluorescence
21-2 Atomization: Flames, Furnaces, and Plasmas
532
532
BOX 21-2 Measuring Sodium with a Bunsen
Burner Photometer
21-3
21-4
21-5
21-6
21-7
How Temperature Affects Atomic Spectroscopy
Instrumentation
Interference
Sampling by Laser Ablation
Inductively Coupled Plasma–Mass
Spectrometry
BOX 21-3 Atomic Emission Spectroscopy on Mars
21-8 X-ray Fluorescence
22 Mass Spectrometry
Droplet Electrospray
22-1 What Is Mass Spectrometry?
BOX 22-1 Molecular Mass and Nominal Mass
534
539
540
544
546
547
548
550
559
559
559
561
BOX 22-2 How Ions of Different Masses Are Separated
by a Magnetic Field
22-2 Oh, Mass Spectrum, Speak to Me!
561
564
BOX 22-3 Isotope Ratio Mass Spectrometry and
Dinosaur Body Temperature
22-3 Types of Mass Spectrometers
22-4 Chromatography–Mass Spectrometry
Interfaces
22-5 Chromatography–Mass Spectrometry
Techniques
566
571
579
583
x
Protein Electrospray)
22-6 Open-Air Sampling for Mass Spectrometry
22-7 Ion Mobility Spectrometry
23 Introduction to Analytical
Separations
Milk Does a Baby Good
23-1 Solvent Extraction
DEMONSTR ATION 23-1 Extraction with Dithizone
BOX 23-1 Crown Ethers and Phase Transfer Agents
23-2
23-3
23-4
23-5
What Is Chromatography?
A Plumber’s View of Chromatography
Efficiency of Separation
Why Bands Spread
588
592
594
604
604
604
607
609
609
611
615
621
BOX 23-2 Microscopic Description of
Chromatography
24 Gas Chromatography
Doping in Sports
24-1 The Separation Process in Gas
Chromatography
626
633
633
634
BOX 24-1 Chiral Phases for Separation Optical
Isomers
24-2 Sample Injection
24-3 Detectors
BOX 24-2 Chromatography Column on a Chip
24-4 Sample Preparation
24-5 Method Development in Gas
Chromatography
638
645
648
652
655
657
BOX 24-3 Two-Dimensional Gas
Chromatography
660
25 High-Performance Liquid
Chromatography
Paleothermometry: How to Measure Historical
Ocean Temperatures
25-1 The Chromatographic Process
667
667
668
BOX 25-1 One-Million-Plate Colloidal Crystal
Columns Operating by Slip Flow
BOX 25-2 Structure of the Solvent–Bonded
Phase Interface
BOX 25-3 “Green” Technology: Supercritical Fluid
Chromatography
25-2 Injection and Detection in HPLC
25-3 Method Development for Reversed-Phase
Separations
25-4 Gradient Separations
25-5 Do it with a Computer
676
677
680
685
691
699
701
BOX 25-4 Choosing Gradient Conditions and
BOX 22-4 Matrix-Assisted Laser Desorption/
Ionization
BOX 22-5 Making Elephants Fly (Mechanisms of
588
Scaling Gradients
704
Contents
26 Chromatographic Methods and
Capillary Electrophoresis
DNA Profiling
26-1 Ion-Exchange Chromatography
26-2 Ion Chromatography
BOX 26-1 Surfactants and Micelles
26-3 Molecular Exclusion Chromatography
26-4 Affinity Chromatography
BOX 26-2 Molecular Imprinting
26-5
26-6
26-7
26-8
Hydrophobic Interaction Chromatography
Principles of Capillary Electrophoresis
Conducting Capillary Electrophoresis
Lab-on-a-Chip: DNA Profiling
27 Gravimetric and
Combustion Analysis
The Geologic Time Scale and Gravimetric Analysis
27-1 An Example of Gravimetric Analysis
27-2 Precipitation
28 Sample Preparation
713
713
714
720
725
725
727
728
728
729
735
743
751
751
752
754
DEMONSTR ATION 27-1 Colloids, Dialysis, and
Microdialysis
BOX 27-1 van der Waals Attraction
27-3 Examples of Gravimetric Calculations
27-4 Combustion Analysis
Contents
755
758
760
763
Cocaine Use? Ask the River
28-1 Statistics of Sampling
28-2 Dissolving Samples for Analysis
28-3 Sample Preparation Techniques
Notes and References
Glossary
Appendixes
A. Logarithms and Exponents and Graphs
of Straight Lines
B. Propagation of Uncertainty
C. Analysis of Variance and Efficiency in
Experimental Design
D. Oxidation Numbers and Balancing Redox Equations
E. Normality
F. Solubility Products
G. Acid Dissociation Constants
H. Standard Reduction Potentials
I. Formation Constants
J. Logarithm of the Formation Constant for
the Reaction M(aq) 1 L(aq) Δ ML(aq)
K. Analytical Standards
L. DNA and RNA
Solutions to Exercises
Answers to Problems
Index
771
771
773
777
782
NR1
GL1
AP1
AP1
AP3
AP10
AP19
AP22
AP23
AP25
AP34
AP42
AP45
AP46
AP48
S1
AN1
I1
xi
EXP E R I M E N TS
Experiments are found at the website
www.whfreeman.com/qca/
0.
1.
2.
3.
4.
5.
6.
7.
8.
9.
10.
11.
12.
13.
14.
15.
16.
17.
18.
19.
20.
Green Analytical Chemistry
Calibration of Volumetric Glassware
Gravimetric Determination of Calcium as CaC2O4 ? H2O
Gravimetric Determination of Iron as Fe2O3
Penny Statistics
Statistical Evaluation of Acid-Base Indicators
Preparing Standard Acid and Base
Using a pH Electrode for an Acid-Base Titration
Analysis of a Mixture of Carbonate and Bicarbonate
Analysis of an Acid-Base Titration Curve: The Gran Plot
Fitting a Titration Curve with Excel Solver
Kjeldahl Nitrogen Analysis
EDTA Titration of Ca21 and Mg21 in Natural Waters
Synthesis and Analysis of Ammonium Decavanadate
Iodimetric Titration of Vitamin C
Preparation and Iodometric Analysis of High-Temperature
Superconductor
Potentiometric Halide Titration with Ag1
Electrogravimetric Analysis of Copper
Polarographic Measurement of an Equilibrium Constant
Coulometric Titration of Cyclohexene with Bromine
Spectrophotometric Determination of Iron in Vitamin
Tablets
21. Microscale Spectrophotometric Measurement of Iron in
Foods by Standard Addition
22. Spectrophotometric Measurement of an Equilibrium
Constant
23. Spectrophotometric Analysis of a Mixture: Caffeine and
Benzoic Acid in a Soft Drink
24. Mn21 Standardization by EDTA Titration
25. Measuring Manganese in Steel by Spectrophotometry with
Standard Addition
26. Measuring Manganese in Steel by Atomic Absorption
Using a Calibration Curve
27. Properties of an Ion-Exchange Resin
28. Analysis of Sulfur in Coal by Ion Chromatography
29. Measuring Carbon Monoxide in Automobile Exhaust
by Gas Chromatography
30. Amino Acid Analysis by Capillary Electrophoresis
31. DNA Composition by High-Performance Liquid
Chromatography
32. Analysis of Analgesic Tablets by High Performance Liquid
Chromatography
33. Anion Content of Drinking Water by Capillary
Electrophoresis
34. Green Chemistry: Liquid Carbon Dioxide Extraction
of Lemon Peel Oil
SP R E A D S H E E T TO P I C S
2-10 Introduction to Microsoft Excel
2-11 Graphing with Microsoft Excel
Problem 3-8 Controlling the appearance of a graph
4-1 Average, standard deviation
4-1 Area under a Gaussian curve (Normdist)
Table 4-3 F-Distribution (Finv)
4-3 Finding Confidence Intervals
4-4 Paired t-Test
4-5 t-Test
4-7 Equation of a straight line (Slope and Intercept)
4-7 Equation of a straight line (LINEST)
4-9 Spreadsheet for least squares
4-9 Error bars on graphs
5-2 Square of the correlation coefficient, R2
(LINEST)
Problem 5-15 Using Trendline
7-5 Calculating precipitation titration curves
with a spreadsheet
xii
39
42
61
66
67
70
73
77
79
82
84
87
88
101
114
154
8-5 Goal Seek
174
8-5 Solver
176–177
8-5 Solver with circular reference
179
9-5 Excel’s Goal Seek tool and naming of cells
206
Problem 10-9 Automatic iteration
230
11-10 Acid-base titration
254
12-4 EDTA titrations
273
Problem 12-20 Auxiliary complexing agents in
EDTA titrations
284
Problem 12-22 Complex formation
285
13-1 Using Excel Solver
290
13-2 Activity coefficients with the
Davies equation
291–293
13-3 Dependence of solubility on pH
296
13-4 Fitting nonlinear curves by least squares
301
13-4 Using Excel Solver for more than one unknown
302
19-1 Solving simultaneous equations by least
squares with Solver
463
Spreadsheet Topics
19-1 Solving simultaneous equations by matrix
inversion
465
19-2 Measuring equilibrium constants by least
squares with Solver
467
20-6 Savitzky-Golay polynomial smoothing of noise
521
25-5 Computer simulation of a chromatogram
701
Appendix B Propagation of uncertainty
AP4
Appendix C Analysis of variance (ANOVA)
AP13–AP14
Appendix C Multiple linear regression and experimental
design (Linest)
AP15
Supplementary Topics at Website:
Spreadsheet for Precipitation Titration of a Mixture
Microequilibrium Constants
Spreadsheets for Redox Titration Curves
HPLC Chromatography Simulator
Fourier Transform of Infrared Spectrum with a Spreadsheet
S P R E A D S H E E TS AT WEB SIT E
t-Test
Least Squares with LINEST
Error Bar Graph
Standard Addition with Graph
Complex Formation
CaSO4 Equilibria
MgCl2 Ion Pairing with Activity
Titration of HA with NaOH Effect of pKa
Titration of HA with NaOH Effect of
Concentration
Figure 11-4 Nicotine Titration
Figure 12-12 EDTA Titration
Figure 13-1 Tartrate 1 Pyridinium 1 OH2
Figure 13-3 KH2PO4 1 Na2HPO4 with Activity
Figure 4-10
Figure 4-15
Figure 4-16
Figure 5-5
Figure 6-3
Figure 8-13
Problem 8-30
Figure 11-3a
Figure 11-3a
Spreadsheets at Website
Figure 13-5
Figure 13-6
Figure 13-11
Figure 19-3
CaF2 with Activity
Barium Oxalate
Difference Plot for Glycine
Analysis of Mixture
(More Points than Components)
Figure 19-4 Solving Two Simultaneous Equations
Figure 19-8 Neutral Red Protein Binding Least Squares
Exercise 19-B Data for Analysis of ThreeComponent Mixture
Figure 25-36 Isocratic Chromatogram Simulator
Supplement: Gradient Elution Chromatogram Simulator
Supplement: FTIR Interferogram
Supplement: FTIR Interferogram Solution for Exercise
xiii
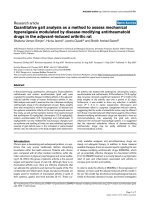
CONNECTIONS: Maria Goeppert Mayer
Maria Goeppert Mayer (1906–1972) was the second and,
so far, last woman (after Marie Curie) to receive the Nobel
Prize in Physics. She shared half of the 1963 prize with
Hans Jensen for their independent theories of atomic
nuclear shell structure published in 1949.
What does she have to do with this book? The back
cover shows evidence that the body temperature of certain
dinosaurs was similar to that of warm blooded animals. In
1947, she and Jacob Bigeleisen published a paper,
“Calculation of Equilibrium Constants for Isotopic
[Emilio Segre Visual Archives/
Science Source.]
Exchange Reactions.”* This paper was one of the foundational studies for paleothermometry—the use of isotopes
to deduce the temperature at which objects such as dinosaur teeth were formed. From
mathematical physics to analytical chemistry to dinosaurs, there is a thread of connection.
Maria was born to a sixth-generation university professor in Göttingen, Germany.†
From early childhood, she knew that she would acquire a university education, but there
were few avenues for girls’ education. She attended a small, private girls’ school, which
closed before her studies were complete. Against all advice, she took and passed the
University of Göttingen entrance examination to be admitted in 1924. Her first exposure to
quantum mechanics by Max Born hooked her. She received a Ph.D. in 1930, with three
Nobel Prize winners on her committee.
Maria married Joe Mayer, a Caltech- and Berkeley-educated physical chemist who was a
postdoctoral boarder in the Goeppert household. They moved to the U.S., where Joe began a
distinguished career at Johns Hopkins University, Columbia University, and the University of
Chicago. In 1940 they coauthored Statistical Mechanics, a textbook used for more than
40 years. Maria was regarded as at least equally gifted, but she was not offered a paid position at any university despite teaching courses, advising graduate students, serving on committees, and writing graduate examinations—all as a volunteer! Her first paid appointment as
a professor at the University of California at San Diego came in 1960, four years after her
election to the National Academy of Sciences.
*J. Bigeleisen and M. G. Mayer, J. Chem. Phys. 1947, 15, 261.
†
xiv
S. B. McGrayne, Nobel Prize Women in Science (Washington DC: Joseph Henry Press, 1998).
P R E FAC E
Goals of This Book
My goals are to provide a sound physical understanding of the principles of analytical chemistry and to show how these principles are applied in chemistry and related disciplines—
especially in life sciences and environmental science. I have attempted to present the subject
in a rigorous, readable, and interesting manner, lucid enough for nonchemistry majors, but
containing the depth required by advanced undergraduates. This book grew out of an introductory analytical chemistry course that I taught mainly for nonmajors at the University of
California at Davis and from a course for third-year chemistry students at Franklin and
Marshall College in Lancaster, Pennsylvania.
What’s New?
Beginning with dinosaur body temperature on the back cover of this book, analytical chemistry addresses interesting questions in the wider world. The facing page draws a connection
between the back cover and underlying human achievement in physics that enables us to
deduce body temperature from the isotopic composition of teeth. The story of Maria Goeppert
Mayer is a lesson for us all in how women in science were so poorly treated not so long ago.
In this edition, the introduction to titrations has been consolidated in Chapter 7. Acidbase, EDTA, redox, and spectrophotometric titrations are still treated in other chapters. The
power of the spreadsheet is unleashed in Chapter 8 to reach numerical solutions to equilibrium problems and in Chapter 19 to compute equilibrium constants from spectrophotometric
data. Atomic spectroscopy Chapter 21 has a new section on X-ray fluorescence as a routine
analytical tool. Mass spectrometry Chapter 22 has been expanded to increase the level of
detail and to help keep up with new developments. Chapter 27 has an extraordinary sequence
of micrographs showing the onset of crystallization of a precipitate. Three new methods in
sample preparation were added to Chapter 28. Appendix B takes a deeper look at propagation
of uncertainty and Appendix C treats analysis of variance.
Container with
leaching solution
Actuator arm
to deliver
canisters of
dry reagents
Beaker
compartment
log (concentration, M)
Stainless
steel sieve
to reject
large chunks
of soil
− 1.0
Leaching solution added
− 2.0
Cl − calibration
solution added
Cl −
Soil added and
BaCl2 begins to
enter cell
Cl − = 0.009 6 M
at end point
− 3.0
Cl − = 0.000 19 M
before BaCl2 addition
− 4.0
Ba2+
End point
− 5.0
0:00
2:00
4:00
6:00
8:00
10:00
12:00
14:00 16:00
Time (h)
BOX 15-3 Measuring sulfate on Mars by
titration with barium [Mars Lander: NASA/JPL-Caltech/
FIGURE FROM PROBLEM 7-21 Barium sulfate
precipitation titration from Phoenix Mars Lander [Data
University of Arizona/Max Planck Institute.]
courtesy S. Kounaves, Tufts University.]
For the first time since I began work on this book in 1978, I have taken on a contributing
author for part of this revision. Professor Chuck Lucy of the University of Alberta shares his
expertise and teaching experience with us in Chapters 23–26 on chromatography and capillary electrophoresis. He improved the discussion of the efficiency of separation and mechanisms of band spreading. Emphasis is placed on types of interactions between solutes and the
stationary phase. Types of solvent polarity are distinguished in liquid chromatography.
Examples are given for the selection of stationary phase and pH for liquid chromatography
separations. Electrophoresis has more emphasis on the effects of ion size and pH on mobility.
Chuck contributes the views of a specialist in separation science to these chapters.
New boxed applications include a home pregnancy test (Chapter 0 opener), observing the
addition of one base to DNA with a quartz crystal microbalance (Chapter 2 opener), medical
implications of false positive results (Box 5-1), a titration on Mars (Chapter 7 opener),
xv
Cl −
AuCl4−
FIGURE FROM BOX 17-1 Anodic dissolution of gold at atomic steps [R. Wen, A.
Lahiri, M. Azhagurajan, S. Kobayashi, K. Itaya, “A New in situ Optical Microscope with Single Atomic
Layer Resolution for Observation of Electrochemical Dissolution of Au (111),” J Am Chem Soc 2010,
132,13657, Figure 2. Reprinted with permission © 2010, American Chemical Society.]
microequilibrium constants (Box 10-3), acid-base titration of RNA to provide evidence for
the mechanism of RNA catalysis (Chapter 11 opener), the hydrogen-oxygen fuel cell and the
Apollo 13 accident (Box 14-2), the lead-acid battery (Box 14-3), high-throughput DNA
sequencing by counting protons (Chapter 15 opener), how perchlorate was discovered on
Mars (Box 15-3), ion-selective electrode with a conductive polymer for a sandwich immunoassay (Box 15-4), metal reaction at atomic steps (Box 17-1), an aptamer biosensor for
clinical use (Box 17-5), Bunsen burner flame photometer (Box 21-2), atomic emission
spectroscopy on Mars (Box 21-3), making elephants fly (mechanism of protein electrospray,
Box 22-5), chromatographic analysis of breast milk (Chapter 23 opener), doping in sports
(Chapter 24 opener), two-dimensional gas chromatography (Box 24-3), million-plate separation by slip flow chromatography (Box 25-1), forensic DNA profiling (Chapter 26 opener
and Section 26-8), and measuring van der Waals attraction (Box 27-1). New Color Plates
illustrate the effect of ionic strength on ion dissociation (Color Plate 4), the mechanism of
chromatography by partitioning of analyte between phases (Color Plate 30), and separation
of dyes by solid-phase extraction (Color Plate 36).
6
Metabolite
A
Column 2 retention time (s)
5
Reference
compound 1
Metabolite
E
4
3
2
Reference
compound 2
1
Interferent
0
10
15
20
25
Column 1 retention time (min)
CHAPTER 24 OPENING IMAGE Two-dimensional gas chromatography—
combustion isotope ratio mass spectrometry to detect doping in athletes
[H. J. Tobias, Y. Zhang, R. J. Auchus, J. T. Brenna, “Detection of Synthetic Testosterone
Use by Novel Comprehensive Two-Dimensional Gas Chromatography Combustion
Isotope Ratio Mass Spectrometry,” Anal Chem 2011, 83, 7158, Figure 4A. Reprinted
with permission © 2011, American Chemical Society.]
Pedagogical changes in this edition include more discussion of serial dilution to prepare
standards in Chapters 2, 3, and 18, distinction between standard uncertainty and standard
deviation in statistics, more discussion of hypothesis testing in statistics, employing the F
test before the t test for comparison of means, using a graphical treatment for internal standards, emphasis on electron flow toward the more positive electrode in electrochemical
cells, using nanoscale observations to probe phenomena such as van der Waals forces and
xvi
Preface
the amorphous structure of glass in a pH electrode, polynomial
smoothing of noisy data, expanded discussion of the time-offlight mass spectrometer and ion mobility separations, enhanced
discussion of intermolecular forces in chromatography, enhanced
discussion of method development in liquid chromatography,
use of a free, online liquid chromatography simulator, introduction of two literature search questions in chromatography, and
taking more advantage of the power of Excel for numerical analysis. Box 3-3 explains how I have chosen to handle atomic weight
intervals in the latest periodic table of the elements.
Features
Topics are introduced and illustrated with concrete, interesting
examples. In addition to their pedagogic value, Chapter Openers, Boxes, Demonstrations, and Color Plates are intended to
help lighten the load of a very dense subject. Chapter Openers
show the relevance of analytical chemistry to the real world and
to other disciplines of science. I can’t come to your classroom
to present Chemical Demonstrations, but I can tell you about
some of my favorites and show how they look with the Color
Plates located near the center of the book. Boxes discuss interesting topics related to what you are studying or amplify points
in the text.
Problem Solving
CHAPTER 9 EXAMPLE PAGE 193
B
A
C
D
E
1
Thallium azide equilibria
2
3
1. Estimate values of pC = –log[C] for N3 and OH in cells B6 and B7
_
F
_
2. Use Solver to adjust the values of pC to minimize the sum in cell F8
4
5
6
Species pC
_
N3
_
bi
Mass and charge balances
C (= 10^-pC)
_
2
0.01 C6 = 10^-B6
b1 = 0 = [Tl+] – [N3 ] – [HN3] =
4
0.0001 C7 = 10^-B7
b2 = 0 = [Tl+] + [H+] – [N3 ] – [OH ] =
1.18E-02
⌺bi2 =
2.80E-04
7
8
OH
Tl+
0.021877616 C8 = D12/C6
9
10
11
HN3
4.46684E-08 C9 = D13*C6/C7
12
pKsp = 3.66
13
14
H+
_
_
1.19E-02
F6 = C8-C6-C9
F7 = C8+C10-C6-C7
1E-10 C10 = D14/C7
F8 = F6^2+F7^2
Ksp =
0.000218776
= 10^-B12
pKb = 9.35
Kb =
4.46684E-10
= 10^-B13
pKw = 14.00
KW =
1E-14
= 10^-B14
azide solubility spreadsheet without activity coefficients.
Nobody can do your learning for you. The two most important FIGURE 8-9 Thallium
2
2
ways to master this course are to work problems and to gain expe- Initial estimates pN 3 5 2 and pOH 5 4 appear in cells B6 and B7. From these two
numbers, the spreadsheet computes concentrations in cells C6 : C10. Solver then
rience in the laboratory. Worked Examples are a principal pedavaries pN23 and pOH2 in cells B6 and B7 until the charge and mass balances in cell
gogic tool to teach problem solving and to illustrate how to apply F8 are satisfi
ed.
what you have just read. Each worked example ends with a Test
Yourself question that you are encouraged to answer to apply what
you learned in the example. There are Exercises and Problems at the end of each chapter. Exercises are the minimum set of problems that apply most major concepts of each chapter. Please
struggle mightily with an Exercise before consulting the solution at the back of the book. Problems at the end of the chapter cover the entire content of the book. Short Answers are at the
back of the book and complete solutions appear in the Solutions Manual.
Spreadsheets are indispensable for science and engineering and uses far beyond this
course. You can cover this book without using spreadsheets, but you will never regret taking
the time to learn to use them. A few of the powerful features of Microsoft Excel are described
as they are needed, including graphing in Chapters 2 and 4, statistical functions and regression
in Chapter 4, solving equations with Goal Seek, Solver, and circular definitions in Chapters 7,
8, 13, and 19, and some matrix operations in Chapter 19. The text teaches you how to construct spreadsheets to simulate many types of titrations, to solve chemical equilibrium problems, and to simulate chromatographic separations.
Other Features of This Book
Terms to Understand Essential vocabulary, highlighted in bold in the text, is collected at
the end of the chapter. Other unfamiliar or new terms are italic in the text.
Glossary Bold vocabulary terms and many of the italic terms are defined in the glossary.
Appendixes Tables of solubility products, acid dissociation constants, redox potentials,
and formation constants appear at the back of the book. You will also find discussions of
logarithms and exponents, propagation of error, analysis of variance, balancing redox equations, normality, analytical standards, and a little bit about DNA.
Notes and References Citations in the chapters appear at the end of the book.
Inside Cover Here is your trusty periodic table, as well as tables of physical constants and
other information.
Preface
xvii
Media and Supplements
The Solutions Manual for Quantitative Chemical Analysis contains complete solutions to
all problems.
New Clicker Questions allow instructors to integrate active learning in the classroom
and to assess students’ understanding of key concepts during lectures. Available in Microsoft
Word and PowerPoint (PPT).
New Lecture PowerPoints have been developed to minimize preparation time for new
users of the book. These files offer suggested lectures including key illustrations and summaries that instructors can adapt to their teaching styles.
New Test Bank offers questions in editable Microsoft Word format.
Premium WebAssign with e-Book www.webassign.com features time-tested, secure,
online environment already used by millions of students worldwide. Featuring algorithmic
problem generation, students receive homework problems containing unique values for computation, encouraging them to work out the problems on their own. Additionally, there is
complete access to the e-Book, from a live table of contents.
Sapling Learning with e-Book www.sapling.com provides highly effective interactive
homework and instruction that improve student learning outcomes for the problem-solving
disciplines. Sapling Learning offers an enjoyable teaching and effective learning experience
that is distinctive in three important ways: (1) ease of use: Sapling Learning’s easy-to-use
interface keeps students engaged in problem-solving, not struggling with the software; (2)
targeted instructional content: Sapling Learning increases student engagement and comprehension by delivering immediate feedback and targeted instructional content; (3) unsurpassed
service and support: Sapling Learning makes teaching more enjoyable by providing a dedicated Masters- and Ph.D.-level colleague to service instructors’ unique needs throughout the
course, including content customization.
The student website www.whfreeman.com/qca has directions for experiments which
may be reproduced for your use. You will also find lists of experiments from the Journal of
Chemical Education. Supplementary topics at the website include spreadsheets for precipitation and redox titrations, discussion of microequilibrium constants, a spreadsheet simulation of gradient liquid chromatography, and Fourier transformation of an interferogram into
an infrared spectrum. You will also find 24 selected Excel spreadsheets from the textbook
ready to use at the student website.
The instructors’ website, www.whfreeman.com/qca, has all artwork and tables from
the book in preformatted PowerPoint slides.
The People
My wife Sally works on every aspect of this book and the Solutions Manual. She contributes
mightily to whatever clarity and accuracy we have achieved.
Solutions to problems and exercises were meticulously checked by Heather Audesirk, a
graduate student at Caltech, and by Julia Lee, a senior at Harvey Mudd College.
A book of this size and complexity is the work of many people. Brittany Murphy, Anna
Bristow, and Lauren Schultz provided editorial and market guidance. Jennifer Carey was the
Project Editor responsible for making sure that all pieces of this book fell into the right place.
Marjorie Anderson attended to the challenging details of copyediting. Photo research and
permissions were ably handled by Cecilia Varas and Richard Fox. Matthew McAdams,
Janice Donnola, and Tracey Kuehn coordinated the illustration program. Anna Skiba-Crafts
was the courageous proofreader.
In Closing
This book is dedicated to the students who use it, who occasionally smile when they read
it, who gain new insight, and who feel satisfaction after struggling to solve a problem. I
have been successful if this book helps you develop critical, independent reasoning that
you can apply to new problems in or out of chemistry. I truly relish your comments, criticisms, suggestions, and corrections. Please address correspondence to me at the Chemistry Division (Mail Stop 6303), Research Department, Michelson Laboratory, China Lake,
CA 93555.
Dan Harris
March 2015
xviii
Preface
Acknowledgements
I am indebted to many people who provided new information for this edition, asked probing
questions, and made good suggestions. Pete Palmer of San Francisco State University graciously
shared his instructional material for X-ray fluorescence and provided a detailed critique of my
draft, as well as suggestions for mass spectrometry. Karyn Usher of Metropolitan State University,
Saint Paul, Minnesota, photographed her solid-phase extraction experiment that appears in Color
Plate 36. Martin Mirenda of the Universidad de Buenos Aires provided Color Plate 4 showing
the instructive effect of ionic strength on the color of bromocresol green. Jim De Yoreo and Mike
Nielsen of Battelle Pacific Northwest National Laboratory provided the exquisite time-lapse
calcium carbonate nucleation transmission electron micrographs in Figure 27-2.
Barbara Belmont of California State University, Dominguez Hills asked a seemingly simple
question in 2011 about the propagation of uncertainty that required the knowledge of my statistician colleague, Dr. Ding Huang, to answer. This question led to the expanded Appendix B.
D. Brynn Hibbert of the University of New South Wales, Australia, was also a resource for
statistics. Jürgen Gross of Heidelberg University and David Sparkman of the University of the
Pacific in California were resources for mass spectrometry. Dale Lecaptain of Central Michigan
University requested more emphasis on serial dilutions, which has been added. Brian K. Niece
of Assumption College, Worcester, Massachusetts, corrected my procedure for using
hydroxynaphthol blue indicator for EDTA titrations. Micha Enevoldsen of Frederiksberg,
Denmark, taught me that Kjeldahl was a Danish chemist, not a Dutch chemist. He also taught
me that Kjeldahl was one of the “three great pH’s,” who also include S. P. L. Sørensen and
K. U. Linderstrøm-Lang. Chan Kang of Chonbuk National University, Korea, pointed out that
I had been using the letter n to mean more than one thing in electrochemistry, which I have
attempted to correct in this edition. Alena Kubatova of the University of North Dakota provided some of her teaching materials for mass spectrometry. Other helpful corrections and
suggestions came from Richard Gregor (Rollins College, Florida), Franco Basile (University
of Wyoming), Jeffrey Smith (Carleton University, Ottawa), Kris Varazo (Francis Marion
University, Florence, South Carolina), Doo Soo Chung (Seoul National University), Ron
Cooke (California State University, Chico), David D. Weiss (Kansas University), Steven
Brown (University of Delaware), Athula Attygalle (Stevens Institute of Technology, Hoboken,
New Jersey), and Peter Liddel (Glass Expansion, West Melbourne, Australia).
People who reviewed the 8th edition of Quantitative Chemical Analysis and parts of the
manuscript for the 9th edition include Truis Smith-Palmer (St. Francis Xavier University),
William Lammela (Nazareth College), Nelly Mateeva (Florida A&M University), Alena
Kubatova (University of North Dakota), Barry Ryan (Emory University), Neil Jespersen
(St. John’s University), David Kreller (Georgia Southern University), Darcey Wayment (Nicholls
State University), Karla McCain (Austin College), Grant Wangila (University of Arkansas),
James Rybarczyk (Ball State University), Frederick Northrup (Northwestern University),
Mark Even (Kent State University), Jill Robinson (Indiana University), Pete Palmer (San
Francisco State University), Cindy Burkhardt (Radford University), Nathanael Fackler
(Nebraska Weslyan University), Stuart Chalk (University of North Florida), Reynaldo Barreto
(Purdue University North Central), Susan Varnum (Temple University), Wendy Cory (College
of Charleston), Eric D. Dodds (University of Nebraska, Lincoln), Troy D. Wood (University of
Buffalo), Roy Cohen (Xavier University), Christopher Easley (Auburn University), Leslie
Sombers (North Carolina State University), Victor Hugo Vilchiz (Virginia State University),
Yehia Mechref (Texas Tech University), Lenuta Cires Gonzales (California State University, San
Marcos), Wendell Griffith (University of Toledo), Anahita Izadyar (Arkansas State University),
Leslie Hiatt (Austin Peay State University), David Carter (Angelo State University), Andre
Venter (Western Michigan University), Rosemarie Chinni (Alvernia University), Mary Sohn
(Florida Technical College), Christopher Babayco (Columbia College), Razi Hassan (Alabama
A&M University), Chris Milojevich (University of Tampa), Steven Brown (University of
Delaware), Anne Falke (Worcester State University), Julio Alvarez (Virginia Commonwealth
University), Keith Kuwata (Macalaster College), Levi Mielke (University of Indianapolis),
Simon Mwongela (Georgia Gwinnett College), Omowunmi Sadik (State University of New
York at Binghamton), Jingdong Mao (Old Dominion University), Jani Ingram (Northern Arizona
University), Matthew Mongelli (Kean University), Vince Cammarata (Auburn University), Ed
Segstro (University of Winnipeg), Tiffany Mathews (Villanova University), Andrea Matti (Wayne
State University), Rebecca Barlag (Ohio University), Barbara Munk (Wayne State University),
John Berry (Florida International University), Patricia Cleary (University of Wisconsin, Eau
Claire), and Sandra Barnes (Alcorn State University).
Preface
xix
this
page
left
intentionally
blank
0
The Analytical Process
HOW DOES A HOME PREGNANCY TEST WORK?
Urine
containing
hcG
Antibodies
bound to Au
nanoparticles
Antibody Antibody to
to analyte antibody
Sample
pad
Conjugate
pad
Test line
Nitrocellulose
membrane
Control line
Absorbent
pad
(d) Conjugate reagent not attached to hcG binds to antibody at control line
Au
nanoparticle
Antibodies bound
to Au nanoparticles
(a) Apply drop of urine to sample pad
Analyte
hcG
Sample pad
Test line
(b) hcG binds to antibody as liquid wicks past conjugate pad
Control line
(e) Home pregnancy test [Rob Byron/Shutterstock.]
(c) Another part of hcG binds to antibody at test line
A common home pregnancy test detects a hormone called hcG in urine. This hormone begins
to be secreted shortly after conception.
An antibody is a protein secreted by white blood cells to bind to a foreign molecule called
an antigen. Antibody-antigen binding is the first step in the immune response that eventually
removes a foreign substance or an invading cell from your body. Antibodies to human proteins
such as hcG can be cultivated in animals.
In the lateral flow home pregnancy immunoassay shown in the diagram, urine is applied to
the sample pad at the left end of a horizontal test strip made of nitrocellulose that serves as a
wick. Liquid flows from left to right by capillary action. Liquid first encounters detection
reagent on the conjugate pad. The reagent is called a conjugate because it consists of hcG antibody attached to red-colored gold nanoparticles. The antibody binds to one site on hcG.
As liquid flows to the right, hcG bound to the conjugate is trapped at the test line, which
contains an antibody that binds to another site on hcG. Gold nanoparticles trapped with hcG
at the test line create a visible red line. As liquid continues to the right, it encounters the control line with antibodies that bind to the conjugate reagent. A second red line forms at the
control line. At the far right is an absorbent pad that soaks up liquid containing anything that
was not retained at the test or control lines.
In a positive pregnancy test, both lines turn red. The test is negative if only the control
line turns red. If the control line fails to turn red, the test is invalid.
Bold terms should be learned. Italicized terms
are less important. A glossary of terms is
found at the back of the book.
Quantitative analysis: How much is present?
Qualitative analysis: What is present?
CHAPTER 0 The Analytical Process
Q
uantitative chemical analysis is the measurement of how much of a chemical substance
is present. The purpose of quantitative analysis is usually to answer a question such as
“Does this mineral contain enough copper to be an economical source of copper?” The home
pregnancy test above is a qualitative chemical analysis, which looks for the presence of a
hormone that is produced during pregnancy. This test answers the even more important
question, “Am I pregnant?” Qualitative analysis tells us what is present and quantitative
1
analysis tells us how much is present. In quantitative analysis, the chemical measurement
is only part of a process that includes asking a meaningful question, collecting a relevant
sample, treating the sample so that the chemical of interest can be measured, making the
measurement, interpreting the results, and providing a report.
0-1 The Analytical Chemist’s Job
Notes and references appear after the last
chapter of the book.
My favorite chocolate bar,1 jammed with 33% fat and 47% sugar, propels me over mountains
in California’s Sierra Nevada. In addition to its high energy content, chocolate packs an extra
punch with the stimulant caffeine and its biochemical precursor, theobromine.
O
O
CH3
C
HN
C
C
C
H3C
N
CH3
C
N
C
C
C
N
CH
O
N
CH3
Chocolate is great to eat, but not so easy to
analyze. [Dima Sobko/Shutterstock.]
A diuretic makes you urinate.
A vasodilator enlarges blood vessels.
Chemical Abstracts is the most comprehensive
source for locating articles published in
chemistry journals. SciFinder is software that
accesses Chemical Abstracts.
N
CH
O
N
N
CH3
Theobromine (from Greek “food of the gods”)
Caffeine
A diuretic, smooth muscle relaxant,
A central nervous system stimulant
cardiac stimulant, and vasodilator
Too much caffeine is harmful for many people, and some unlucky individuals cannot
tolerate even small amounts. How much caffeine is in a chocolate bar? How does that
amount compare with the quantity in coffee or soft drinks? At Bates College in Maine,
Professor Tom Wenzel teaches his students chemical problem solving through questions
such as these.2
But, how do you measure the caffeine content of a chocolate bar? Two students, Denby
and Scott, began their quest with a search of Chemical Abstracts for analytical methods.
Looking for the key words “caffeine” and “chocolate,” they uncovered numerous articles in
chemistry journals. Two reports, both entitled “High-Pressure Liquid Chromatographic
Determination of Theobromine and Caffeine in Cocoa and Chocolate Products,”3 described a
procedure suitable for the equipment in their laboratory.4
Sampling
Homogeneous: same throughout
Heterogeneous: differs from region to region
Pestle
The first step in any chemical analysis is procuring a representative sample to measure—
a process called sampling. Is all chocolate the same? Of course not. Denby and Scott bought
one chocolate bar and analyzed pieces of it. If you wanted to make broad statements about
“caffeine in chocolate,” you would need to analyze a variety of chocolates. You would also
need to measure multiple samples of each type to determine the range of caffeine in each
kind of chocolate.
A pure chocolate bar is fairly homogeneous, which means that its composition is the
same everywhere. It might be safe to assume that a piece from one end has the same caffeine
content as a piece from the other end. Chocolate with a macadamia nut in the middle is an
example of a heterogeneous material—one whose composition differs from place to place.
The nut is different from the chocolate. To sample a heterogeneous material, you need to use
a strategy different from that used to sample a homogeneous material. You would need to
know the average mass of chocolate and the average mass of nuts in many candies. You
would need to know the average caffeine content of the chocolate and of the macadamia nut
(if it has any caffeine). Only then could you make a statement about the average caffeine
content of macadamia chocolate.
Sample Preparation
Mortar
FIGURE 0-1 Ceramic mortar and pestle used
to grind solids into fine powders.
2
The first step in the procedure calls for weighing out some chocolate and extracting fat from
it by dissolving the fat in a hydrocarbon solvent. Fat needs to be removed because it would
interfere with chromatography later in the analysis. Unfortunately, if you just shake a chunk
of chocolate with solvent, extraction is not very effective because the solvent has no access to
the inside of the chocolate. So, our resourceful students sliced the chocolate into small bits
and placed the pieces into a mortar and pestle (Figure 0-1), thinking they would grind the
solid into small particles.
CHAPTER 0 The Analytical Process


![Designation: C 471M – 96 METRIC - Chemical Analysis of Gypsum and Gypsum Products [Metric]1 ppsx](https://media.store123doc.com/images/document/2014_07/10/medium_jfk1405009249.jpg)