Báo cáo y học: " Quantitative biomarker analysis of synovial gene expression by real-time PCR" potx
Bạn đang xem bản rút gọn của tài liệu. Xem và tải ngay bản đầy đủ của tài liệu tại đây (166.15 KB, 9 trang )
R352
Introduction
The need to validate therapeutic agents in clinical trials is
a key challenge in drug development for arthritis [1].
Advances in preclinical discovery technology have identi-
fied a large portfolio of targets that can potentially be
tested in patients with inflammatory arthritis. However,
trials that are dependent on clinical endpoints require rela-
tively large numbers of patients due to heterogeneity of
disease and placebo responses. In addition to the sub-
stantial expense, competition for patient enrollment among
the various agents also complicates the process. Alterna-
tive methods to evaluate the drug effect, to predict clinical
responses, and to prioritize targets are needed.
One potential solution to this problem is the use of short-
term clinical trials that focus on biomarker-based analysis [2].
This approach has been employed in rheumatoid arthritis
(RA), although studies often rely on synovial fluid and periph-
eral blood samples [3,4] or on semiquantitative assessments
of synovial tissue protein expression [5] and mRNA expres-
sion [6]. Synovial tissue analysis using immunohistochem-
istry (IHC) has more recently utilized precise image analysis
techniques [7] to determine the relative expression of
protein, although the lack of normalizing and external stan-
dards can potentially limit the power of this method. Analysis
of tissue RNA transcripts, such as in situ hybridization, is less
well established and is subject to additional constraints.
CE = cellular equivalents of expression; C(t) = threshold cycle; CV = coefficient of variation; IFN = interferon; IHC = immunohistochemistry; IL =
interleukin; MMP-1 = matrix metalloproteinase 1; OA = osteoarthritis; PBMC = peripheral blood mononuclear cells; PCR = polymerase chain reac-
tion; Q-PCR = quantitative polymerase chain reaction; RA = rheumatoid arthritis; RE = relative expression; TNF-α = tumor necrosis factor alpha.
Arthritis Research & Therapy Vol 5 No 6 Boyle et al.
Research article
Quantitative biomarker analysis of synovial gene expression by
real-time PCR
David L Boyle
1
, Sanna Rosengren
1
, William Bugbee
2
, Arthur Kavanaugh
1
and Gary S Firestein
1
1
Center for Innovative Therapy, Division of Rheumatology, Allergy and Immunology, UCSD School of Medicine, La Jolla, California, USA
2
Department of Orthopedics, UCSD School of Medicine, La Jolla, California, USA
Correspondence: David L Boyle (e-mail: )
Received: 21 Jan 2003 Revisions requested: 22 Apr 2003 Revisions received: 5 Aug 2003 Accepted: 19 Aug 2003 Published: 8 Oct 2003
Arthritis Res Ther 2003, 5:R352-R360 (DOI 10.1186/ar1004)
© 2003 Boyle et al., licensee BioMed Central Ltd (Print ISSN 1478-6354; Online ISSN 1478-6362). This is an Open Access article: verbatim
copying and redistribution of this article are permitted in all media for any purpose, provided this notice is preserved along with the article's original
URL.
Abstract
Synovial biomarker analysis in rheumatoid arthritis can be used
to evaluate drug effect in clinical trials of novel therapeutic
agents. Previous studies of synovial gene expression for these
studies have mainly relied on histological methods including
immunohistochemistry and in situ hybridization. To increase the
reliability of mRNA measurements on small synovial tissue
samples, we developed and validated real time quantitative PCR
(Q-PCR) methods on biopsy specimens. RNA was isolated
from synovial tissue and cDNA was prepared. Cell-based
standards were prepared from mitogen-stimulated peripheral
blood mononuclear cells. Real time PCR was performed using
TaqMan chemistry to quantify gene expression relative to the
cell-based standard. Application of the cellular standard curve
method markedly reduced intra- and inter-assay variability and
corrected amplification efficiency errors compared with the C(t)
method. The inter-assay coefficient of variation was less than
25% over time. Q-PCR methods were validated by
demonstrating increased expression of IL-1ß and IL-6
expression in rheumatoid arthritis synovial samples compared
with osteoarthritis synovium. Based on determinations of
sampling error and coefficient of variation, twofold differences in
gene expression in serial biopsies can be detected by assaying
approximately six synovial tissue biopsies from 8 to 10 patients.
These data indicate that Q-PCR is a reliable method for
determining relative gene expression in small synovial tissue
specimens. The technique can potentially be used in serial
biopsy studies to provide insights into mechanism of action and
therapeutic effect of new anti-inflammatory agents.
Keywords: arthritis, biomarker, rheumatoid, synovium
Open Access
Available online />R353
To develop a reproducible and accurate method of gene
expression analysis on synovial biopsies, we evaluated
and validated real-time quantitative PCR (Q-PCR) on very
small synovial tissue samples using a novel cell-based
standard curve technique. This method is ideally suited for
small proof-of-concept clinical trials designed to determine
a biomarker endpoint in arthritis. In combination with IHC
or tissue extract-based protein expression measurements
[8], these techniques could help prioritize drug candidates
so that resources can be focused on those patients with
the greatest likelihood for success [9].
Materials and methods
Reagents
All reagents required for reverse transcription PCR and
Q-PCR were from Applied Biosystems (Foster City, CA,
USA), as were the TaqMan primer/probe sets (Pre-Devel-
oped Assay Reagents; Applied Biosystems) for human
tumor necrosis factor alpha (TNF-α), IL-1β, and IL-6. For
human matrix metalloproteinase 1 (MMP-1) Q-PCR, a
primer/probe set (forward primer, TTT CAT TTC TGT TTT
CTG GCC A; reverse primer, CAT CTC TGT CGG CAA
ATT CGT; probe, 6FAM-AAC TGC CAA ATC GGC TTG
AAG CTG CT-TAMRA) was synthesized at Retrogen (San
Diego, CA, USA). RNAStat-60 reagent for RNA isolation
was supplied by TelTest (Friendswood, TX, USA). Ribo-
Green, used to quantitate RNA, was obtained from Molec-
ular Probes, Inc (Eugene, OR, USA). All other reagents
were from Sigma (St Louis, MO, USA).
Patient selection and tissue preparation
Hip or knee synovial tissue was collected at the time of
joint replacement from patients diagnosed with RA or
osteoarthritis (OA), after obtaining informed consent, and
was immediately placed on ice. After transporting the
samples to the laboratory, fragments of the synovium (size
1–2 mm
2
) were excised, placed in RNAStat-60 reagent,
were incubated at room temperature for 15 min, and were
snap frozen in liquid nitrogen. Samples were stored for
less than 5 months at –80°C until the time of RNA isola-
tion.
Preparation of TaqMan standards
Blood was obtained from normal donors by venipuncture
into heparin syringes and peripheral blood mononuclear
cells (PBMC) were isolated using Ficoll-Paque (Amer-
sham-Pharmacia Biotech, Uppsala, Sweden). The PBMC
were cultured overnight at 5 × 10
6
cells/ml in the presence
of 1 µg/ml Concanavalin A to induce transcription of
inflammatory genes. The following day, cells were lysed in
RNAStat-60. Samples were stored at –80°C.
RNA isolation and cDNA synthesis
RNA from the synovium and from PBMC was isolated
using the manufacturer’s recommendations for
RNAStat-60. Briefly, the procedure includes extraction
with chloroform, precipitation of the aqueous phase with
isopropanol, washing the pellet with 4 M lithium chloride
followed by 75% ethanol and, finally, resuspension of the
slightly dry pellet in Tris–EDTA buffer (pH 7.5). The RNA
content was determined with RiboGreen (Molecular
Probes), and up to 500 ng per reaction was reverse-tran-
scribed in a final volume of 50 µl. The resulting synovial
cDNA was stored at –80°C. PBMC cDNA was diluted in
fourfold steps to yield a set of standards representing
mRNA acquired from between 24 and 100,000 cells.
Quantitative PCR
mRNA levels were quantified in synovial samples by sub-
jecting cDNA to TaqMan PCR analysis, in triplicate, using
the GeneAmp 5700 Sequence Detection System
(Applied Biosystems). Predeveloped sequence detection
reagents specific for human TNF-α, IL-1β, and IL-6, includ-
ing forward and reverse primers as well as a fluorogenic
TaqMan FAM/TAMRA-labeled hybridization probe, were
supplied as mixtures and were used at 0.8 µl/25 µl PCR.
The forward primer, the reverse primer and the probe for
MMP-1 transcript quantification were used at concentra-
tions of 50, 300 and 100 nM, respectively. These concen-
trations were optimized in preliminary experiments using
activated PBMC cDNA as a template. All primer/probe
combinations were designed to exclude the detection of
genomic DNA. To control for sample cellularity, GAPDH
forward and reverse primers (0.5 µl each/reaction) and a
TaqMan JOE/TAMRA-labeled probe (0.5 µl/reaction) were
included in separate PCR reactions. Each 25 µl PCR reac-
tion mix also included 1 × TaqMan universal PCR master
mix with AmpliTaq Gold DNA polymerase, uracil-N-glyco-
sylase (AmpErase), dNTPs with dUTP, and a passive ref-
erence to minimize background fluorescence fluctuations.
The thermal cycle conditions were 2 min at 50°C to allow
activation of uracil-N-glycosylase, 10 min at 95°C to acti-
vate the AmpliTaq polymerase, and 40 cycles of 95°C for
15 s/60°C for 1 min. The fluorescent signal at each cycle
generated by the release of fluorophores (FAM or JOE)
from the quencher (TAMRA) by the 5′-exonuclease activity
of AmpliTaq polymerase was plotted versus the cycle
number. The threshold cycle C(t), the cycle number at
which an increase above background fluorescence could
be reliably detected, was determined for each sample
using GeneAmp software.
To relate message levels for cytokines, MMP-1 and
GAPDH to a known standard, fourfold dilutions of PBMC
cDNA were included. The same preparation of PBMC
cDNA was used in all experiments, thereby allowing com-
parison of Q-PCR data obtained in different runs. Stan-
dard curves were generated by linear regression using
log(C(t)) versus log(cell number). The PBMC equivalent
(cellular equivalents of expression [CE]) number for syn-
Arthritis Research & Therapy Vol 5 No 6 Boyle et al.
R354
ovial samples was calculated from C(t) values using the
PBMC standard curve. Data were expressed as the ratio
between the inflammatory mediator CE and the GAPDH
CE, yielding the relative expression (RE). Each PCR run
also included nontemplate controls containing all reagents
except cDNA. These controls generated C(t) > 40 (i.e.
mRNA below the detection level) in all experiments. To
compare the efficiency of the PCR reaction using plasmid
and the PBMC template, serial dilutions of a human IL-6
plasmid (MGC-9215; ATCC, Manassas, VA, USA) in lin-
earized or circular form (highest concentration, 10
4
copies
per reaction) were run concomitantly with the regular
human PBMC standards.
Data analysis
Results are expressed as the mean ± standard error of the
CE or the RE, unless otherwise indicated. The within-
tissue coefficient of variation (CV) was calculated as the
standard deviation expressed as a percentage of the mean
value. Sample size was determined, with a power of 0.8,
with a one-sided α-level of 0.05 and with a medium-high
correlation (0.7), for the number of biopsies required per
tissue, as well as to yield a preliminary estimate of the
required number of subjects needed per treatment group.
Group size calculations were based on the detection of a
change in gene expression, expressed as the ‘fold change’
in a treated group versus a placebo control group. Differ-
ences between relative biomarker expression levels in RA
and OA synovial tissues were determined by the Student t
test, using log-transformed data in order to obtain homo-
geneity of variance.
Results
Development of standard curves to correct for variable
PCR efficiency
One of the primary problems encountered using PCR to
quantify gene expression is that differences in amplifica-
tion efficiency can markedly affect the accuracy. Each
primer pair and template has a unique amplification behav-
ior, resulting in a significant error when two amplification
products are compared. To overcome this problem, we
developed a reproducible standard curve method that
internally corrects for differences in efficiency and reverse
transcription.
In vitro activated PBMC were selected because they
express virtually all of the genes of interest. cDNA from
activated PBMC was synthesized and serially diluted to
establish standards containing cDNA from the equivalent
of 24–100,000 cells. Standard curves were determined
for IL-1β, IL-6, TNF-α, MMP-1, and GAPDH using TaqMan
chemistry and Q-PCR as described in Materials and
methods. Figure 1 shows that the stimulated PBMC are a
source of mRNA for the target genes of interest. The
expression of other relevant genes, including IL-4, IL-10
and IFN-γ, generated satisfactory standard curves (data
not shown). The horizontal axis in Fig. 1 shows the number
of cells, while the vertical axis shows the C(t) where the
PCR product could be detected.
When the efficiency of the Q-PCR reaction using pure
plasmid DNA (IL-6) or PBMC cDNA was compared, no
significant difference was found between circular or lin-
earized plasmid (slopes of –3.37 and –3.48, respectively).
However, the efficiency using the PBMC template was
considerably lower with a slope of –3.90. The magnitude
of the difference in the C(t) between PBMC and the
plasmid template correlated with the concentration of the
template (P < 0.05), indicating that the PCR efficiencies
were significantly different. The use of plasmid DNA as a
standard, either for relative or absolute quantification,
therefore introduces a systematic error in gene expression
compared with a cell-based standard.
To normalize each sample for RNA content, a control gene
(GAPDH) was used. By comparing the C(t) of GAPDH in
an unknown sample with the GAPDH standard curve, one
can estimate the RNA content of the test sample relative
to the stimulated PBMC control. This does not provide
information on the absolute number of cells in the
unknown sample because the GAPDH content of synovial
cells might be different from that of PBMC. Nevertheless,
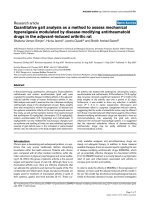
Figure 1
Standard curve expression of IL-1β, IL-6, tumor necrosis factor alpha
(TNF-α), matrix metalloproteinase 1 (MMP-1) and GAPDH. Standard
curves were generated for each cytokine using quantitative PCR on
activated peripheral blood mononuclear cells. The graph shows the
threshold cycle, C(t), where detectable PCR product was observed,
versus the template from a known number of cells. Note that the
slopes of each target gene differ, reflecting different amplification
efficiency. Unless the slopes are identical, the housekeeping gene
cannot be used directly to normalize for RNA content.
15
20
25
30
35
40
12345
GAPDH
TN
F-α
IL-1
β
IL
-6
MMP-1
Ct value
Log (cell number)
it does offer a standard that permits one to normalize the
relative RNA content in multiple specimens so that differ-
ent biopsies can be directly compared.
Figure 2 shows an example of real-time PCR GAPDH
amplification curves using different numbers of PBMC. An
example of cDNA prepared from typical synovial biopsies
is also included to show that the RNA content of these
tissue samples is within the appropriate range of the
GAPDH standard curve. In addition to serving as a mea-
surement of cellularity, amplification of GAPDH can also
be used as an indicator of adequate RNA integrity in
samples. A range of acceptable GAPDH C(t) values is
selected to insure that low abundance mRNAs can be
detected. We selected a C(t) of 34 for GAPDH as repre-
senting the minimum quantity of mRNA suitable for mea-
surement. Samples with GAPDH C(t) values greater than
34 are considered inadequate for reliable measurement
and were repeated with a greater amount of RNA.
Variability of direct C(t) determination versus the
standard curve method
To evaluate the performance of real-time PCR quantifica-
tion using both the raw C(t) measurement and the stan-
dard curve method, we examined identical data sets using
the two techniques. Standard curves for GAPDH were
generated by real-time PCR using cDNA from stimulated
PBMC daily for five consecutive days. A known aliquot of
PBMC was assayed for GAPDH on each day and either
the raw C(t) was recorded or the amount was correlated
to the standard curve generated on the same day. The CV
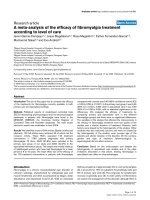
was then calculated for the five separate runs. Figure 3a
shows the CV for replicate assays analyzed by the stan-
dard curve or C(t) methods. The use of the standard
curves substantially improved the CV, especially when
cDNA from relatively low numbers of cells was assayed.
The reduction in variation using the internal standard curve
was even greater when assays were performed over
longer periods of time. Figure 3b shows the variation in
assay results over a period of 4 months with 28 separate
assays. The CV of samples analyzed with the standard
curve consistently yielded a CV < 25%, whereas the C(t)
method resulted in a variable sample-specific CV > 60%.
Q-PCR variation with a cell-based standard on synovial
tissue
To evaluate the applicability of Q-PCR and the standard
curve method to small tissue samples, RA synovial tissue
lysates were prepared and divided into five aliquots for
further processing. Each aliquot was individually assayed
by Q-PCR using the standard curve method. The CEs
were determined based on the PBMC reference standard.
Table 1 presents the CEs of GAPDH, IL-1β, IL-6 and
MMP-1 with the standard deviation and percentage CV
obtained from the replicate experiments. The CE values
are relative to the PBMC standards and do not reflect
absolute expression. For instance, a CE of 1.6 for IL-1β
versus a CE of 11,236 for IL-6 does not imply that more
IL-6 mRNA is present relative to IL-1 in the tissue. Instead,
it relates to the expression in the synovium compared with
that in activated PBMC.
Sampling error and improved CV by normalization to
GAPDH
The synovium is a complex tissue with regional differences
in mRNA expression that can contribute to the sampling
error. To determine the number of random biopsies
required to reflect actual gene expression in the tissue,
biopsies were collected from multiple sites of individual
synovial tissue specimens. Tissue samples were similar in
size to those obtained by percutaneous blind-needle
biopsy (1–2 mm
3
). The mRNA for the target genes was
readily detected in all fragments. Variation in gene expres-
sion was relatively high, in part because of differences in
cellularity from site to site within each tissue (see Table 2
for the CV values). To correct for this influence, the CE
values of the target genes are normalized to a reference
gene using the CE for GAPDH. The RE compared with
GAPDH is determined by dividing the CE of the target
gene by the CE for GAPDH. As anticipated, normalization
to the GAPDH content (RE) improves the precision (see
Table 2). The remaining variations reflect real differences
in gene expression. The REs of three individual tissue frag-
ments from five different RA patients are shown in Fig. 4
for the biomarkers IL-1β, IL-6, TNF-α and MMP-1.
Available online />R355
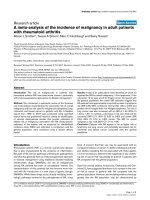
Figure 2
Cycle number versus relative fluorescence for stimulated peripheral
blood mononuclear cells (PBMC) standard. Separate GAPDH
amplification curves are shown for different numbers of activated PBMC.
Each pair of colored lines represents replicate sample amplification plots.
Circles represent amplification of a synovial biopsy to show that it is
within the detection range of quantitative PCR. The dashed line indicates
the threshold cycle, C(t), for this assay. The dark bar at C(t) indicates the
range of C(t) of biopsies containing sufficient mRNA for evaluation. RA,
rheumatoid arthritis; R(n), normalized reporter signal.
GAPDH R(n)
Cycle number
0.01
0.1
1
10 15 20 25 30 35
40
100000
25000
6250
1563
391
98
RA biopsy exemple
Standards (cell number)
Biopsies suitable
for further studies
Threshold
for Ct readout
The CV data allow us to calculate the number of biopsies
from an individual joint needed to minimize the sampling
error as well as the number of patients required for a bio-
marker study. We used a worst-case scenario based on
the highest percentage CV value of 62.7 (IL-6). Power
analysis indicates that four to seven tissue fragments are
required to detect a twofold change in gene expression
with a 25% sampling error (see Table 2). These data were
also used to estimate the number of patients required for a
biomarker-based clinical trial. Detection of a twofold
change in expression following treatment ranges from
three patients for TNF-α to 17 patients for IL-6 using an
α-level of 0.05. Detection of a threefold change requires
between three and nine patients, respectively. This analy-
sis assumes a paired (second biopsy procedure) analysis
comparing the change in the treated group with the
change in the placebo control.
Use of Q-PCR using RA and OA synovia
To determine whether the Q-PCR technique can detect
differences in cytokine gene expression in OA and RA
synovia, nine RA and 13 OA synovial tissues were
sampled and assayed for IL-1β and IL-6 mRNA expres-
Arthritis Research & Therapy Vol 5 No 6 Boyle et al.
R356
Figure 3
Coefficient of variation using PCR techniques. (a) The expression of GAPDH was used to compare assay reproducibility utilizing the standard
curve and threshold cycle, C(t), methods of analysis. Five assays were performed over the course of 1 week. Note that the percentage coefficient
of variation was much greater for the C(t) method compared with that for the standard curve method. (b) The expression of GAPDH was used to
compare assay reproducibility utilizing the standard curve or C(t) methods of analysis. Twenty-eight separate assays were performed over
4 months. Note that the percentage coefficient of variation was greater for the C(t) method compared with that for the standard curve method.
Table 1
Intra-assay variation for quantitative PCR
Mean cell Standard Coefficient
equivalents deviation of variation (%)
GAPDH 237 41 18
IL-1β 1.6 0.2 15
IL-6 11,236 2276 20
MMP-1 4487 1074 24
GAPDH, IL-1β, IL-6 and matrix metalloproteinase 1 (MMP-1)
expression were determined in five replicate samples that were each
processed separately. Data are reported as cell equivalents of
expression relative to the standard. Note: cell equivalents for different
targets cannot be compared directly.
Table 2
Assessment of sampling error in rheumatoid arthritis synovial
biopsies
% Coefficient of variation
Raw data Normalized Number of
(cell equivalents) (relative expression) biopsies*
TNF-α 81.7 ±16.5 56.2 ±9.7 5.2 ±1.6
IL-6 71.7 ±17.2 62.7 ±13.8 7.2 ±1.8
MMP-1 59.4 ±18.3 56.4 ±14.8 6.4 ±2.1
IL-1β 65.3 ±15.1 46.9 ±7.6 4.0 ±0.64
Data presented as mean ±standard error of the mean. Multiple
biopsies were obtained from five rheumatoid arthritis synovial tissues
and assayed for gene expression using the standard curve method.
The coefficient of variation was calculated for each tissue and then the
mean coefficient of variation was determined for each target gene.
Data are presented as cell equivalents of expression and GAPDH
normalized expression (relative expression) within each tissue. Note
that for tumor necrosis factor alpha (TNF-α), matrix metalloproteinase 1
(MMP-1) and IL-1β normalization substantially reduced variation.
*The number of biopsies required to limit the sample error to < 25%.
sion. As shown in Fig. 5, significant differences were
observed for IL-1β and IL-6 using this technique. Real-time
PCR using the standard curve method can therefore be
successfully applied to small samples of synovium.
Available online />R357
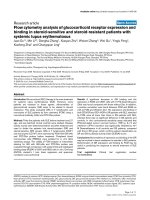
Figure 4
Analysis of sampling error. Intrasynovial variability of (a) IL-1β, (b) IL-6, (c) tumor necrosis factor alpha (TNF-α), and (d) matrix metalloproteinase 1
(MMP-1) mRNA expression. Three biopsies each from five rheumatoid arthritis (RA) synovial tissues were analyzed by quantitative PCR using the
cellular standard curve method. Results are expressed in relative expression units (REU). Data are log-transformed and the mean ±standard
deviation is indicated.
Discussion
Clinical studies designed to evaluate novel therapeutic
agents in arthritis have been limited by imprecise methods
of assessing drug action and by limited power to show sig-
nificant changes of clinical endpoints [10]. Drug develop-
ment has therefore focused on large trials with composite
indices to assess efficacy [11]. While this approach has
been successful in many cases, it is expensive and many
patients must be exposed to the experimental agent for
prolonged periods of time. Furthermore, the complexity of
the studies limits the number of agents that can be tested.
Because of these issues, we have focused on the develop-
ment of reliable biomarker assays that measure the expres-
sion of key mediators at the site of disease. Our studies
demonstrate that real-time Q-PCR can be used on extracts
of very small synovial tissue specimens that can potentially
be used for small proof-of-concept clinical trials.
Biomarker measurement in arthritis patients originally
relied on protein analysis of fluid compartments. Blood
sampling is often included in clinical trials, and measure-
ment of certain plasma constituents, such as C-reactive
protein, provides valuable information as systemic bio-
markers [12]. However, peripheral blood might not be the
best reflection of disease activity and progression in RA
and therefore does not necessarily correlate with clinical
response [13]. Similarly, synovial fluid can be obtained rel-
atively easily by joint aspiration but its utility is markedly
diminished by the fact that the volumes are highly variable
and effusions are frequently absent after treatment with an
effective agent.
As an alternative, many groups have focused on assays
based on gene expression in the target tissue in RA, the
synovium, which is a primary source of cytokines and
effector molecules. The first serial biopsy studies to
assess the effect of therapeutic agents in RA used in
situ hybridization to measure gene expression after treat-
ment with corticosteroids or methotrexate [6]. While
reproducible, in situ hybridization is arduous and
requires estimates of gene expression using image
analysis [14]. Quantification is improving [15] and
radioactive detection systems have a wide linear range,
but the linearity of the widely used chemical systems
today is not well defined.
The most common method for measuring biomarkers in
the synovium is IHC. Selective expression of various pro-
teins can be evaluated using IHC in specific regions such
as the synovial lining, lymphoid aggregates, blood vessels
and the sublining [16–18]. While providing excellent
spatial resolution, the enzymatic detection system relies
on the deposition of a pigmented precipitate. This process
is not necessarily linear and can be difficult to correct
without reliable internal normalization (such as GAPDH),
without comparison to an independent external standard,
or without an accurate method for determining the kinetics
of saturation. Significant improvements in quantification
have been achieved through the elegant use of computer-
based image analysis, and IHC changes can correlate
with clinical activity [5,19]. One potential advantage of
image analysis-based IHC is the ability to evaluate selec-
tive regions of the synovium, although unintentional bias of
Arthritis Research & Therapy Vol 5 No 6 Boyle et al.
R358
Figure 5
Validation of Q-PCR in rheumatoid arthritis (RA) and osteoarthritis (OA) tissue. (a) IL-1β and (b) IL-6 expression in RA synovium. Nine RA and
13 OA synovia were biopsied at the time of joint replacement and were assayed by quantitative PCR using the cellular standard curve method.
Data are expressed as relative expression units. The median is indicated and Student’s t test was performed on log-transformed data.
ascertainment is a possible risk. Validation of extract-
based methods of biomarker analysis in synovial tissue will
require follow-up clinical studies.
One potential advantage of IHC is that the system is
designed to measure protein, rather than RNA, which is
more relevant to function. Nevertheless, studies to evalu-
ate the mechanism of the drug effect would benefit greatly
from complementary evaluation of specific RNA tran-
scripts in tissue that are both reproducible and have a
wide dynamic range (i.e. 10
5
-fold differences for Q-PCR).
Initial studies using PCR to quantify gene expression in
serial biopsies relied on conventional PCR, which is
extremely sensitive and relatively simple [20]. However, lin-
earity is difficult to establish and interexperimental varia-
tions make comparisons over time unreliable. Real-time
PCR differs from conventional methods in that the ampli-
fied product is measured after each thermal cycle using
either a TaqMan probe [21] or an intercalating chemical
like SYBR Green [22] to generate a fluorescent signal.
The cycle in which the fluorescence intensity of each
sample exceeds a defined threshold is the C(t). For a
given set of primers and template, differences in the C(t)
correlate with the amount of starting template. Template
loading using the C(t) methods can be normalized in cell
extracts using a housekeeping gene. Accuracy of normal-
ization based solely on differences in the C(t) requires that
the amplification efficiencies of the target and housekeep-
ing gene are identical [23].
The limitations of the C(t) methods of Q-PCR led us to
consider a set of standard curves by which the assay
results could be quantified and normalized. Development
of a suitable standard for Q-PCR can be problematic.
Plasmids containing the target gene sequence are easy
to obtain at high purity and, in theory, can accurately
determine the absolute copy number. Special plasmids
can be engineered with primer binding sites for multiple
primer pairs yielding a single plasmid species capable of
being a standard template to a family of relevant targets.
However, significant problems limit the use of plasmid
DNA for PCR standards. Plasmid is pure double-
stranded DNA of fixed length, whereas the reverse tran-
scriptase-PCR template isolated from tissues is
single-stranded cDNA or a mRNA–cDNA hybrid with a
target-specific secondary structure. These differences
cause the amplification efficiencies of the standard and
the target to diverge during the first critical PCR cycles
when template predominates. Large differences in syn-
ovial gene expression can be detected using SYBR
green technology and plasmid standards [24]. However,
each plasmid standard must be separately produced and
validated. Use of multiple primed plasmid standards is
further confounded by the fact that the amplification
product has a different sequence and length compared
with the target template.
An alternative and more physiologic approach is to use a
natural source of target mRNA, thereby avoiding the need
to make a separate plasmid for each gene of interest while
simultaneously correcting for differences in reverse tran-
scription efficiency. While PBMC are not an intrinsically
superior source of cellular mRNA, we chose these cells
because they are easy to obtain and can be induced to
express virtually all of the genes relevant to inflammatory
synovitis [25]. This approach also eliminates template
source-based variation in PCR amplification, a significant
cause of assay nonlinearity. The standard curve method
does not provide absolute quantification of any particular
mRNA transcript, but only provides amounts relative to the
standard, similar to a standard curve in a bioassay that
provides a reference unit of biological activity. The raw
data derived from the Q-PCR standard curve is the CE;
that is, the number of PBMC that contain the number of
transcripts expressed in the unknown. This is further
refined as the RE by normalizing to cellular content with
GAPDH, permitting reproducible measurements over time
and comparisons between samples that contain different
numbers of cells.
Clinical trials often require the storage of samples and
repeated measurement. The present findings demonstrate
that the use of a cellular standard significantly reduced
assay drift expressed as the CV over several months.
While the intrinsic variation in PCR assays is slightly
greater than that required for a clinical laboratory analysis
[26], the precision is sufficient to allow detection of
twofold differences. Analysis of individual tissue fragments
from within individual synovia demonstrated that using
about six tissue samples allows for the detection of
twofold differences in gene expression. Interestingly, this
number is similar to previous observations derived from
immunohistochemistry studies [5,27]. Because twofold
changes in gene expression can be detected in groups of
8 to 10 patients with a power of 0.8, proof-of-concept
studies are ideally suited for serial synovial biopsy bio-
marker studies using Q-PCR in combination with protein
assessments such as IHC. Validation studies are still
needed to demonstrate that changes in gene expression
as determined by Q-PCR correlate with clinical disease
activity.
Conclusion
Biomarker analysis of diseased tissue in proof-of-concept
clinical trials can potentially be used to prioritize therapeu-
tic targets and can correlate with clinical efficacy. Q-PCR,
in particular, is a flexible, sensitive and extract-based
method for measuring gene expression in target tissue.
The use of a cellular standard generated with activated
PBMC cDNA significantly improves assay reliability by
reducing variation and by simplifying assay development.
Analysis of RA synovia indicates that six or more synovial
tissue fragments should be pooled to limit sampling error.
Available online />R359
Validation studies performed on surgical samples suggest
that the techniques, especially in combination with protein
analysis techniques such as IHC, can be applied to serial
biopsy studies using 8 to 10 patients per group in which
twofold differences in gene expression are relevant.
Competing interests
None declared.
Acknowledgements
The authors thank Elizabeth Duarte, PhD, for technical assistance and
Dr Tanya Wolfson and Dr Karin Ernstrom for statistical analysis. This
work was supported, in part, by a grant from Pharmacia, Inc. GSF and
DLB have served as consultants for Pharmacia in the past.
References
1. Wagner JA: Overview of biomarkers and surrogate endpoints
in drug development. Dis Markers 2002, 2:41-46.
2. Furberg B: Surrogate markers—substitute measurements.
Easy to measure but irrelevant? Läkartidningen 2002, 15:
1672-1675.
3. Choy EH, Connolly DJ, Rapson N, Jeal S, Brown JC, Kingsley GH,
Panayi GS, Johnston JM: Pharmacokinetic, pharmacodynamic
and clinical effects of a humanized IgG1 anti-CD4 monoclonal
antibody in the peripheral blood and synovial fluid of rheuma-
toid arthritis patients. Rheumatology 2000, 10:1139-1146.
4. Westacott CI, Whicher JT, Barnes IC, Thompson D, Swan AJ,
Dieppe PA: Synovial fluid concentration of five different
cytokines in rheumatic diseases. Ann Rheum Dis 1990, 49:
676-681.
5. Youssef PP, Smeets TJ, Bresnihan B, Cunnane G, Fitzgerald O,
Breedveld F, Tak PP: Microscopic measurement of cellular
infiltration in the rheumatoid arthritis synovial membrane: a
comparison of semiquantitative and quantitative analysis. Br J
Rheumatol 1998, 9:1003-1007.
6. Firestein GS, MM Paine, BH Littman: Gene expression (collage-
nase, tissue inhibitor of metalloproteinases, complement, and
HLA-DR) in rheumatoid arthritis and osteoarthritis synovium:
quantitative analysis and effect of intraarticular cortico-
steroids. Arthritis Rheum 1991, 34:1094-1105.
7. Dolhain RJEM, Ter Haar NT, Dekuiper R, Nieuwenhuis IG, Zwin-
derman AH, Breedveld FC, Miltenburg AM: Distribution of T
cells and signs of T-cell activation in the rheumatoid joint:
implications for semiquantitative comparative histology. Br J
Rheumatol 1998, 37:324-330.
8. Rosengren S, Bugbee WD, Firestein GS, Boyle DL: Quantitative
cytokine protein assays in synovial tissue biopsies for bio-
marker clinical trials [abstract]. Arthritis Rheum 2002, 66:s588.
9. Lathia CD: Biomarkers and surrogate endpoints: how and
when might they impact drug development? Dis Markers
2002, 2:83-90.
10. Paulus HE: Clinical trial design for evaluating combination
therapies. Br J Rheumatol 1995, 2(suppl):92-95.
11. Pincus T: Limitations to standard randomized controlled clini-
cal trials to evaluate combination therapies in rheumatic dis-
eases. Agents Actions 1993, 44(suppl):83-91.
12. Nakamura RM: Progress in the use of biochemical and biologi-
cal markers for evaluation of rheumatoid arthritis. J Clin Lab
Anal 2000, 14:305-313.
13. Firestein GS: Rheumatoid synovitis and pannus. In: Rheumatol-
ogy, 2nd edn. Edited by Klippel JH, Dieppe PA. St Louis, MO:
Mosby International; 1998:5.13.1-5.13.24.
14. Firestein GS, Paine MM, Boyle DL: Mechanisms of methotrex-
ate action in rheumatoid arthritis: selective decrease in syn-
ovial collagenase gene expression. Arthritis Rheum 1994, 37:
193-200.
15. Kriegsmann J, Müller-Ladner U, Sprott H, Bräuer R, Petrow PK,
Otto M, Hansen T, Gay RE, Gay S: Detection of mRNA by non-
radioactive direct primed in situ reverse transcription. His-
tochem Cell Biol 2001, 116:199-204.
16. Bresnihan B, Tak PP: Synovial tissue analysis in rheumatoid
arthritis. Baillieres Best Pract Res Clin Rheumatol 1999, 4:645-
659.
17. Cunnane G, FitzGerald O, Hummel KM, Youssef PP, Gay RE, Gay
S, Bresnihan B: Synovial tissue protease gene expression and
joint erosions in early rheumatoid arthritis. Arthritis Rheum
2001, 8:1744-1753.
18. Kraan MC, Reece RJ, Smeets TJ, Veale DJ, Emery P, Tak PP:
Comparison of synovial tissues from the knee joints and the
small joints of rheumatoid arthritis patients: implications for
pathogenesis and evaluation of treatment. Arthritis Rheum
2002, 8:2034-2038.
19. Kraan MC, Smith MD, Weedon H, Ahern MJ, Breedveld FC, Tak
PP: Measurement of cytokine and adhesion molecule expres-
sion in synovial tissue by digital image analysis. Ann Rheum
Dis 2001, 3:296-298.
20. Berenbaum F, Rajzbaum G, Amor B, Toubert A: Evidence for
GM-CSF receptor expression in synovial tissue. An analysis
by semi-quantitative polymerase chain reaction on rheuma-
toid arthritis and osteoarthritis synovial biopsies. Eur Cytokine
Network 1994, 1:43-46.
21. Heid CA, Stevens J, Livak KJ, Williams PM: Real time quantita-
tive PCR. Genome Res 1996, 6:986-994.
22. Higuchi R, Dollinger G, Walsh PS, Griffith R: Simultaneous
amplification and detection of specific DNA sequences.
Biotechnology 1992, 10:413-417.
23. Relative quantitation of gene expression. ABI PRISM 7700
Sequence Detection System: User Bulletin #2: Index
#4303859 [].
24. Blaschke V, Reich K, Blaschke S, Zipprich S, Neumann C: Rapid
quantization of proinflammatory and chemoattractant
cytokine expression in small tissue samples and monocyte-
derived dendritic cells: validation of a new real-time RT-PCR
technology. J Immunol Methods 2000, 246:79-90.
25. Benveniste O, Vaslin B, Villinger F, Le Grand R, Ansari AA,
Dormont D: Cytokine mRNA levels in unmanipulated (ex vivo)
and in vitro stimulated monkey PBMCs using a semi-quantita-
tive RT-PCR and high sensitivity fluorescence-based detec-
tion strategy. Cytokine 1996, 1:32-41.
26. Shah VP, Midha KK, Dighe S, McGilveray IJ, Skelly JP, Yacobi A,
Layloff T, Viswanathan CT, Cook CE, McDowall RD, Pittman KA,
Spector S: Analytical methods validation: bioavailability, bio-
equivalence and pharmacokinetic studies [conference report].
Eur J Drug Metab Pharmacokinet 1991, 4:249-255.
27. Ulfgren AK, Gröndal L, Lindblad S, Khademi M, Johnell O,
Klareskog L, Andersson U: Interindividual and intra-articular
variation of proinflammatory cytokines in patients with
rheumatoid arthritis: potential implications for treatment. Ann
Rheum Dis 2000, 59:439-447.
Correspondence
David L Boyle, UCSD mail code 0656, 9500 Gilman Drive, La Jolla, CA
92093-0656, USA. Tel: +1 858 822 0784; fax: +1 858 534 2606;
e-mail:
Arthritis Research & Therapy Vol 5 No 6 Boyle et al.
R360