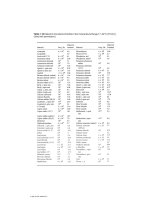
Handbook of sample preparation
Bạn đang xem bản rút gọn của tài liệu. Xem và tải ngay bản đầy đủ của tài liệu tại đây (6.26 MB, 482 trang )
Handbook of Sample Preparation
Handbook of Sample Preparation
Edited by
Janusz Pawliszyn
Heather L. Lord
A John Wiley & Sons, Inc., Publication
www.pdfgrip.com
Copyright © 2010 by John Wiley & Sons, Inc. All rights reserved.
Published by John Wiley & Sons, Inc., Hoboken, New Jersey.
Published simultaneously in Canada.
No part of this publication may be reproduced, stored in a retrieval system, or transmitted in any form or by
any means, electronic, mechanical, photocopying, recording, scanning, or otherwise, except as permitted under
Section 107 or 108 of the 1976 United States Copyright Act, without either the prior written permission of the
Publisher, or authorization through payment of the appropriate per-copy fee to the Copyright Clearance
Center, Inc., 222 Rosewood Drive, Danvers, MA 01923, (978) 750-8400, fax (978) 750-4470, or on the web
at www.copyright.com. Requests to the Publisher for permission should be addressed to the Permissions
Department, John Wiley & Sons, Inc., 111 River Street, Hoboken, NJ 07030, (201) 748-6011, fax
(201) 748-6008, or online at />Limit of Liability/Disclaimer of Warranty: While the publisher and author have used their best efforts in
preparing this book, they make no representations or warranties with respect to the accuracy or completeness
of the contents of this book and specifically disclaim any implied warranties of merchantability or fitness for a
particular purpose. No warranty may be created or extended by sales representatives or written sales materials.
The advice and strategies contained herein may not be suitable for your situation. You should consult with a
professional where appropriate. Neither the publisher nor author shall be liable for any loss of profit or any
other commercial damages, including but not limited to special, incidental, consequential, or other damages.
For general information on our other products and services or for technical support, please contact our
Customer Care Department within the United States at (800) 762-2974, outside the United States at
(317) 572-3993 or fax (317) 572-4002.
Wiley also publishes its books in a variety of electronic formats. Some content that appears in print may
not be available in electronic formats. For more information about Wiley products, visit our web site at
www.wiley.com.
Library of Congress Cataloging-in-Publication Data:
Handbook of sample preparation / edited by Janusz Pawliszyn.
p. cm.
Includes index.
ISBN 978-0-470-09934-6 (cloth)
1. Sample preparation (Chemistry) 2. Extraction (Chemistry)
Janusz.
QD75.4.S24H36 2011
543′.19—dc22
2010010828
3. Chemistry, Analytic.
Printed in the United States of America
10 9 8 7 6 5 4 3 2 1
www.pdfgrip.com
I. Pawliszyn,
Contents
Preface
vii
Contributors
ix
Part I
1
1
2
3
4
5
6
7
8
Fundamental Extraction Techniques
Theory of Extraction
Janusz Pawliszyn
Headspace Gas Chromatography
Zelda E. Penton
Liquid–Liquid Extraction in
Environmental Analysis
Toh Ming Hii and Hian Kee Lee
3
39
53
Solid-Phase Microextraction
Sanja Risticevic, Dajana Vuckovic,
and Janusz Pawliszyn
81
Liquid-Phase Microextraction (LPME)
Utilizing Porous Hollow Fibers
Stig Pedersen-Bjergaard,
Knut Einar Rasmussen, and Jan Åke Jönsson
Sample Preparation in Membrane
Introduction Mass Spectrometry
Raimo A. Ketola, Tapio Kotiaho,
and Frants R. Lauritsen
Supercritical Fluid Extraction
Jeremy J. Kroon and Douglas E. Raynie
12
Microwave-Assisted Extraction
197
J.R. Jocelyn Paré and Jacqueline M.R. Bélanger
13
Chemical Derivatizations in
Analytical Extractions
Jack Rosenfeld
225
Part II Application Considerations
247
14
15
16
103
17
125
18
10
Sample Preparation Techniques for
Environmental Organic Pollutant Analysis
Ray E. Clement and Chunyan Hao
249
Sample Preparation for the Study of
Flavor Compounds in Food
Henryk H. Jelen´
267
Sampling and Sample Preparation for
Clinical and Pharmaceutical Analysis
Hiroyuki Kataoka, Keita Saito,
and Atsushi Yokoyama
285
Statistics of Sampling and
Sample Preparation
Byron Kratochvil
313
SPME Devices Integrating Sampling with
Sample Preparation for On-Site Analysis
Gangfeng Ouyang
325
149
Part III Recent Developments
19
9
191
25
Solid-Phase Extraction
Ronald E. Majors
Microdialysis Sampling as a
Sample Preparation Method
Pradyot Nandi and Susan M. Lunte
11
Pressurized Fluid Extraction
John R. Dean and Renli Ma
163
Superheated Water Extraction
Roger M. Smith
181
341
Developments in the Use of Passive Sampling
Devices for Monitoring Pollutants in Water
343
Graham A. Mills, Rocio Aguilar-Martínez,
Richard Greenwood, Ian J. Allan,
Janine Brümmer, Jesper Knutsson,
and Branislav Vrana
v
www.pdfgrip.com
vi Contents
20
21
22
Solid-Phase Microextraction for
Drug Analysis
Heather L. Lord
Sample Handling Protocols for
Biosensor Applications
Andrew Chan, Teresa Artuso,
and Ulrich J. Krull
Sol-Gel Coatings and Monoliths in
Analytical Sample Preparation
Scott Segro and Abdul Malik
23
365
385
The Use of Molecularly Imprinted Polymers
for Sampling and Sample Preparation
Börje Sellergren and Antonio Martin Esteban
Index
419
www.pdfgrip.com
445
475
Preface
Sample preparation is a critical part of the analytical process
and should be part of any analytical chemistry teaching curriculum. Often though, it is either not mentioned or glossed
over during graduate or undergraduate analytical courses.
The primary reason for this situation is that sample preparation is not typically considered a separate part of analytical
science with unique challenges to be considered, but rather
a set or routine process conducted without much consideration during analytical method development. The result has
been that “advances” in sample preparation in the past three
decades (since the introduction of solid-phase extraction
[SPE]) have primarily revolved around repackaging or
repurposing existing technologies.
The main difficulty in recognizing the scientific principles of sample preparation is that the fundamentals of
extraction, involving natural and frequently complex
samples, are much less developed and understood compared
with physicochemically simpler systems used in the separation and quantification steps of the analytical process,
such as chromatography and mass spectrometry. This
situation creates an impression that rational design and optimization of extraction systems is not possible. Therefore,
the development of sample preparation procedures is frequently considered to be more of an “art” rather than a
“science.”
Given its significance in the overall success of analysis,
advances in the science of sample preparation hold the
promise of providing important gains in analytical method
development. Until quite recently, sample preparation has
been based on very simple “low-tech” approaches such as
sample–solvent or sample–headspace partitioning, while
underlying more scientifically challenging problems associated with the sample matrix have been ignored. This situation is presently changing with the introduction of
nontraditional technologies, which address the need for
solvent-free alternatives, automation, and miniaturization.
These approaches are frequently simpler to operate but more
difficult to optimize, requiring more fundamental knowledge by the analytical chemist not only about equilibrium
conditions, but, more importantly, about the kinetics of mass
transfer in the extraction systems. For some years, we have
been actively involved in teaching the fundamental aspects
of modern sample preparation technology to practitioners of
analytical chemistry, mainly industrial chemists. We recognized a need to provide the fundamental background, not
only to assist users, but also to help educators in developing
their undergraduate and graduate programs. Designing
teaching programs to address the new developments in
extraction technologies is challenging as the scientific literature’s emphasis is mostly placed on the differences between
techniques rather than on their common features, which
would facilitate general understanding.
The present trend in analytical instrumentation is toward
miniaturization and portability. These developments will
eventually enable the attainment of a major goal of the analytical chemist: to perform the analysis at the place where a
sample is located, rather than the current practice of moving
the sample to a laboratory. This new approach will reduce
errors and time associated with sample transport and storage
and thus result in more accurate, precise, and faster data.
Simplification of sample preparation technologies and their
integration with sampling and introduction of extracted
components to analytical instrumentation are both challenges to and opportunities for the contemporary analytical
chemist. The design of easy-to-use but powerful sample
preparation tools will have a profound effect on the future
of analytical methodology.
The purpose of this book is to address the needs and
challenges outlined above in a single resource that provides
practical information on the use of a wide variety of
sample preparation strategies. Leading scientists in this area
have contributed chapters on modern aspects of liquid,
solid-phase, and membrane extractions with and without
derivatization as well as the challenges associated with different types of matrices. In the first chapter on the Theory
of Extraction, an attempt has been made to outline common
features among extraction technologies. The following
chapters are dedicated to different extraction technologies
vii
www.pdfgrip.com
viii Preface
and applications for different types of matrices, and focus
on the impact of new technologies on the science of sample
preparation. Many authors emphasize the fact that extraction
technologies should not be considered in isolation but should
be well integrated with the steps of sampling and the introduction to analytical instrumentation. This is particularly
important when implementing the analytical technology
directly on-site.
This book is not intended to provide a comprehensive
review of the topic of sample preparation, but rather to be a
first step toward a unified treatment of analytical sample
preparation technologies. It is hoped that it will be helpful
for learning more about sample preparation and for identifying the commonalities, as well as for encouraging an interest
in it by outlining the present practice of the technology and
by indicating research opportunities.
www.pdfgrip.com
Janusz Pawliszyn and Heather L. Lord
University of Waterloo
Waterloo, ON, Canada
Contributors
Rocio Aguilar-Martínez, Department of Analytical
Chemistry, University Complutense of Madrid, Ciudad
Universitaria, 28040 Madrid, Spain
Henryk H. Jelen´, Faculty of Food Science and Nutrition,
Poznan´ University of Life Sciences, Wojska Polskiego
31, 60-624 Poznan´, Poland
Ian J. Allan, Contaminants in the Marine Environment
Section, Norsk Institutt for Vannforskning (NIVA),
Gaustadalleen 21, NO-0349 Olso, Norway
Jan Åke Jönsson, Department of Analytical Chemistry,
Lund University, Getingevägen 60, Lund, 22100, Sweden
Teresa Artuso, School of Biological Sciences and Applied
Chemistry, Seneca College, 70 The Pond Road, North
York, ON, M3J 3M6, Canada
Jacqueline M.R. Bélanger, Environmental Science and
Technology Centre, Environment Canada (ret.), Ottawa,
ON, K1A 0H3, Canada
Janine Brümmer, School of Biological Sciences, University
of Portsmouth, King Henry I Street, Portsmouth,
PO1 2DY, Hampshire, UK
Andrew Chan, Chemical Sensors Group, Department of
Chemical and Physical Sciences, University of Toronto
Mississauga, 3359 Mississauga Rd. North, Mississauga,
ON, L5L 1C6, Canada
Ray E. Clement, Ontario Ministry of the Environment,
Laboratory Services Branch, 125 Resources Road,
Etobicoke, ON, M9P 3V6, Canada
John R. Dean, Biomolecular and Biomedical Research
Centre, School of Life Sciences, Northumbria University,
Newcastle upon Tyne, NE1 8ST, UK
Richard Greenwood, School of Biological Sciences,
University of Portsmouth, King Henry I Street,
Portsmouth, PO1 2DY, Hampshire, UK
Hiroyuki Kataoka, School of Pharmacy, Shujitsu
University, Nishigawara, Okayama 703-8516, Japan
Raimo A. Ketola, Centre for Drug Research, Faculty
of Pharmacy, University of Helsinki, P.O. Box 56
(Viikinkaari 5E), Helsinki, FI-00014, Finland
Jesper Knutsson, Water Environment Technology,
Chalmers University of Technology, Sven Hultins gata
8, SE-412 96, Göteborg, Sweden
Tapio Kotiaho, Laboratory of Analytical Chemistry,
Department of Chemistry and Division of Pharmaceutical
Chemistry, Faculty of Pharmacy, University of Helsinki,
A.I. Virtasen aukio 1 (P.O. Box 55), Helsinki, FI-00014,
Finland
Byron Kratochvil, Department of Chemistry, University
of Alberta, 11227 Saskatchewan Drive, Edmonton, AB,
T6G 2G2, Canada
Jeremy J. Kroon, Department of Chemistry and
Biochemistry, South Dakota State University, Brookings,
SD, 57007
Ulrich J. Krull, Chemical Sensors Group, Department of
Chemical and Physical Sciences, University of Toronto
Mississauga, 3359 Mississauga Rd. North, Mississauga,
ON, L5L 1C6, Canada
Chunyan Hao, Ontario Ministry of the Environment,
Laboratory Services Branch, 125 Resources Road,
Etobicoke, ON, M9P 3V6, Canada
Frants R. Lauritsen, Department of Pharmaceutics and
Analytical Chemistry, Faculty of Pharmaceutical
Sciences, Copenhagen University, Universitetsparken 2,
Copenhagen, 2100, Denmark
Toh Ming Hii, Department of Chemistry, National
University of Singapore, 3 Science Drive 3, 119260,
Republic of Singapore
Hian Kee Lee, Department of Chemistry, National
University of Singapore, 3 Science Drive 3, 119260,
Republic of Singapore
ix
www.pdfgrip.com
x Contributors
Heather L. Lord, Department of Chemistry, University of
Waterloo, 200 University Avenue West, Waterloo, ON,
N2L 3G1, Canada
Susan M. Lunte, Department of Pharmaceutical Chemistry
and Ralph N. Adams Institute for Bioanalytical Chemistry,
University of Kansas, 132 Simons Biosciences Research
Laboratories, 2095 Constant Avenue, Lawrence, KS,
66047
Renli Ma, Biomolecular and Biomedical Research Centre,
School of Applied Sciences, Northumbria University,
Newcastle upon Tyne, NE1 8ST, UK
Ronald E. Majors, Agilent Technologies Inc., 2850
Centreville Road, Wilmington, DE, 19808
Abdul Malik, Department of Chemistry, University of
South Florida, 4202 E. Fowler Avenue, CHE 205, Tampa,
FL 33620
Antonio Martin Esteban, Dpto. Medio Ambiente, INIA,
Carretera de A Coruña Km 7.5, 28040 Madrid, Spain
Graham A. Mills, School of Pharmacy and Biomedical
Sciences, University of Portsmouth, White Swan Road,
Portsmouth, PO1 2DT, Hampshire, UK
Pradyot Nandi, University of Colorado Denver, 2100 N.
Ursula Street, Unit 329, Aurora, CO, 80045
Gangfeng Ouyang, School of Chemistry and Chemical
Engineering, Sun Yat-sen University, 135 Xingang Street
West, Guangzhou, 510275, China
J.R. Jocelyn Paré, Your World, 94A Newton Street,
Moncton, NB, E1E 3A4, Canada
Janusz Pawliszyn, Department of Chemistry, University of
Waterloo, 200 University Avenue West, Waterloo, ON
N2L 3G1, Canada
Stig Pedersen-Bjergaard, School of Pharmacy, University
of Oslo, P.O. Box 1068, Blindern, Oslo, N-0316, Norway
Zelda E. Penton, Varian Inc. (ret.); Email: z.penton@
comcast.net
Knut Einar Rasmussen, School of Pharmacy, University
of Oslo, P.O. Box 1068, Blindern, Oslo, N-0316,
Norway
Douglas E. Raynie, Department of Chemistry and
Biochemistry, South Dakota State University, Brookings,
SD 57007
Sanja Risticevic, Department of Chemistry, University of
Waterloo, 200 University Avenue West, Waterloo, ON
N2L 3G1, Canada
Jack Rosenfeld, Department of Pathology and Molecular
Medicine, McMaster University (Professor Emeritus),
14 Huntingwood Avenue, Unit 10, Hamilton, ON, L8H
6X3, Canada
Keita Saito, School of Pharmacy, Shujitsu University,
1-6-1, Nishigawara, Okayama 703-8516, Japan
Scott Segro, Department of Chemistry, University of South
Florida, 4202 E. Fowler Avenue, CHE 205, Tampa, FL
33620
Börje Sellergren, INFU, Technische Universität Dortmund,
Otto Hahn Strasse 6, 44221 Dortmund, Germany
Roger M. Smith, Department of Chemistry, Loughborough
University, Loughborough, Leics, LE11 3TU, UK
Branislav Vrana, Research Centre for Toxic Compounds
in the Environment (RECETOX), Masaryk University,
Kamenice 126/3, 625 00 Brno, Czech Republic
Dajana Vuckovic, Centre for Cellular and Biomolecular
Research, 160 College Street, Room 940, Toronto, ON,
M5S 3E1, Canada
Atsushi Yokoyama, Criminal Investigation Laboratory,
Okayama Prefectural Police Headquarters, Tonda-cho,
Okayama 700-0816, Japan
www.pdfgrip.com
Part I
Fundamental
Extraction Techniques
www.pdfgrip.com
Chapter
1
Theory of Extraction
Janusz Pawliszyn
1.1. PERSPECTIVE ON SAMPLE
PREPARATION
Over the last two decades, active research on sample preparation has been fueled by interest in elimination of organic
solvent from environmental analysis, and rapid analysis of
combinatorial chemistry and biological samples requiring
high-level automation with robots that are able to process
multiwell plates containing an ever-increasing number
of samples. These new developments resulted in miniaturization of the extraction process, leading to new microconfigurations and solvent-free approaches. Fundamental
understanding of extraction principles has advanced in parallel with the development of new technologies. This progress has been very important in the development of novel
approaches resulting in new trends in sample preparation,
for example, microextraction, miniaturization, and integration of the sampling and separation and/or quantification
steps of the analytical process.
The fundamentals of the sampling and sample preparation processes are substantially different from those related
to chromatographic separations or other traditional disciplines of analytical chemistry. Sampling and sample preparation frequently resemble engineering approaches on a
smaller scale. The sample preparation step typically consists
of extraction of components of interest from the sample
matrix. This procedure can vary in degree of selectivity,
speed, and convenience, depending on the approach and
conditions used, as well as on geometric configurations of
the extraction phase. Optimization of this process enhances
overall analytical performance. Proper design of the extraction devices and procedures facilitates rapid and convenient
on-site implementation, integration with separation and
quantification steps, and/or automation. The key to rational
choice, optimization, and design is an understanding of fundamental principles governing mass transfer of analytes in
multiphase systems. There is a tendency to divide extraction
techniques according to random criteria. The objectives of
this chapter are to emphasize common principles among
different extraction techniques, to describe a unified theoretical treatment, and to discuss future research opportunities in integration and miniaturization trends.
1.1.1. Steps in the Analytical Process
The analytical procedure for complex samples consists of
several steps typically including sampling, sample preparation, separation, quantification, statistical evaluation, and
decision making (Fig. 1.1). Each step is critical for obtaining
correct and informative results. The sampling step includes
deciding where to get samples that properly define the object
or problem being characterized, and choosing a method to
obtain samples in the right amount. The objective of the
sample preparation step is to isolate the components of interest from a sample matrix, because most analytical instruments cannot handle the matrix directly. Sample preparation
involves extraction procedures and can also include
“cleanup” procedures for very complex, “dirty” samples.
This step must also bring the analytes to a concentration
level suitable for detection, and therefore, sample preparation methods typically include enrichment. During the separation step of the analytical process, the isolated complex
mixture containing the target analytes is divided into its
constituents, typically by means of a chromatographic or an
electrophoretic technique, which are subsequently identified
and quantified. The identification can be based on retention
time or migration time combined with selective detection,
for example, mass spectrometry (MS). Statistical evaluation
of the results provides an estimate of the concentration of
the target compound in the sample being analyzed. The
resulting data are used to make appropriate decisions, which
might include a move to take another sample for further
investigation of the object or problem.
It is important to note, as emphasized in Figure 1.1, that
analytical steps follow one after another, and a subsequent
step cannot begin until the preceding one has been
Handbook of Sample Preparation, Edited by Janusz Pawliszyn and Heather L. Lord
Copyright © 2010 John Wiley & Sons, Inc.
3
www.pdfgrip.com
4 I Fundamental Extraction Techniques
ACTION
DECISION
STATISTICAL EVALUATION
SEPARATION AND QUANTITATION
SAMPLE PREPARATION
Figure 1.1. Steps in analytical process.
Copyright Wiley-VCH, 1997. Reprinted
with permission.
SAMPLING
completed. Therefore, the slowest step determines the
overall speed of the analytical process, and improving the
speed of a single step may not necessarily result in an
increase in throughput. To increase throughput, all steps
need to be considered. Also, errors performed in any preceding step, including sampling, will result in the overall poor
performance of the procedure.
1.1.2. Sample Preparation as Part of
the Analytical Process
There have been major breakthroughs in the development of
improved instrumentation, which involve miniaturization of
analytical devices and hyphenation of different steps into
one system. It is recognized that an ideal instrument will
perform all the analytical steps with minimal human intervention, preferably directly on the site where an investigated
system is located rather than moving the sample to laboratory, as is a common practice at the present time. This
approach will eliminate errors and reduce the time associated with sample transport and storage, and therefore, result
in faster analysis and more accurate, precise data. Although
such a device has not yet been built, today’s sophisticated
instruments, such as the gas chromatography–mass spectrometry (GC-MS) or liquid chromatography–mass spectrometry (LC-MS), can separate and quantify complex
mixtures and automatically apply chemometric methods to
statistically evaluate results. It is much more difficult to
hyphenate sampling and sample preparation steps, primarily
because the current state-of-the-art sample preparation techniques employ multistep procedures involving organic
solvents. This characteristic makes it difficult to develop
a method that integrates sampling and sample preparation
with separation methods, for the purpose of automation. The
result is that over 80% of analysis time is currently spent on
sampling and sample preparation steps for complex samples.
One of the reasons for slow progress in the area of sample
preparation is that the fundamentals of extraction involving
natural, frequently complex samples are much less developed and understood compared with physicochemically
simpler systems used in separation and quantification steps
such as chromatography and MS. This situation creates an
impression that rational design and optimization of extraction systems is not possible. Therefore, the development of
sample preparation procedures is frequently considered to
be an “art” and not a “science.”
1.1.3. Classification of Extraction Techniques
Figure 1.2 provides a classification of extraction techniques
and unifies the fundamental principles behind the different
extraction approaches. In principle, exhaustive extraction
approaches do not require calibration, because most analytes
are transferred to the extraction phase by employing overwhelming volumes of it. In practice, however, confirmation
of satisfactory recoveries is implemented in the method by
using surrogate standards. To reduce the amount of solvents
and time required to accomplish exhaustive removal, batch
equilibrium techniques (e.g., liquid–liquid extractions
[LLEs]) are frequently replaced by flow-through techniques.
For example, a sorbent bed can be packed with extraction
phase dispersed on a supporting material; when the sample
is passed through, the analytes in the sample are retained on
the bed. Large volumes of sample can be passed through a
small cartridge, and the flow through the well-packed bed
facilitates efficient mass transfer. The extraction procedure
www.pdfgrip.com
1 Theory of Extraction 5
Extraction Techniques
Flow-Through Equilibrium
and Pre-Equilibrium
Exhaustive
Purge and Trap
Nonexhaustive
In-tube SPME
Steady-State Exhaustive
and Nonexhaustive
Batch Equilibrium
and Pre-Equilibrium
Exhaustive
Membrane
Nonexhaustive
LLE
Headspace
Sorbent Trap
S
Soxhlet
S
LLME
SPE
Sorbents
SPME
Figure 1.2. General classification of
extraction techniques. Copyright
Wiley-VCH, 1997. Reprinted with
permission.
SFE
HSE
is followed by desorption of analytes into a small volume of
solvent, resulting in substantial enrichment and concentration of the analytes. This strategy is used in sorbent-trap
techniques and in solid-phase extraction (SPE).1 Alternatively,
the sample (typically, a solid) can be packed in the bed, and
the extraction phase can be used to remove and transport the
analytes to the collection point. In supercritical fluid extraction (SFE), compressed gas is used to wash analytes from
the sample matrix; an inert gas at atmospheric pressure performs the same function in purge-and-trap methods. In
dynamic solvent extraction, for example, in a Soxhlet apparatus, the solvent continuously removes the analytes from
the matrix at the boiling point of the solvent. In more recent
pressurized fluid extraction (PFE) techniques, smaller
volumes of organic solvent or even water are used to achieve
greater enrichment at the same time as extraction, because
of the increased solvent capacity and elution strength at high
temperatures and pressures.2
Alternatively, nonexhaustive approaches can be designed
on the basis of the principles of equilibrium, pre-equilibrium,
and permeation techniques.3 Although equilibrium nonexhaustive techniques are fundamentally analogous to
equilibrium-exhaustive techniques, the capacity of the
extraction phase is smaller and is usually insufficient to
remove most of the analytes from the sample matrix. This
is because of the use of a small volume of the extracting
phase relative to the sample volume, such as is employed in
microextraction (solvent microextraction4 or solid-phase
microextraction [SPME]5), or in the cases of a low sample
matrix–extraction phase distribution constant, as is typically
encountered in gaseous headspace techniques.6 Preequilibrium conditions are accomplished by breaking the
contact between the extraction phase and the sample matrix
before equilibrium with the extracting phase has been
reached. Although the devices used are frequently identical
with those of microextraction systems, shorter extraction
times are employed. The pre-equilibrium approach is conceptually similar to the flow injection analysis (FIA)
approach,7 in which quantification is performed in a dynamic
system and system equilibrium is not required to obtain
Solvent-Free Sample Preparation Methods
Gas-Phase
Extraction
Headspace
Membrane
Extraction
SFE
Static
Static
Dynamic
Dynamic
Sorbent
Extraction
SPE
SPME
Cartridge
Direct
Disk
Headspace
In-tube
Figure 1.3. Classification of solvent-free extraction techniques.
Copyright Wiley-VCH, 1997. Reprinted with permission.
acceptable levels of sensitivity, reproducibility, and accuracy. In permeation techniques, for example, membrane
extraction,8 continuous steady-state transport of analytes
through the extraction phase is accomplished by simultaneous re-extraction of analytes. Membrane extraction can be
made exhaustive by designing appropriate membrane
modules and optimizing the sample and stripping flow conditions,9 or it can be optimized for throughput and sensitivity
in nonexhaustive, open-bed extraction.10
In addition to classification of methods based on more
fundamental principles as discussed above, it is also instructive to divide techniques according to particular characteristics. For example, recently there is a trend toward
solvent-free techniques (Fig. 1.3).11 This is an important
direction, not only because it addresses health and pollution
prevention issues, but also because such approaches tend to
be easier to implement for on-site monitoring in field conditions. This direction has generated a lot of interest and
research opportunities recently, and it is expected to continue to be a very active area in the near future. The most
promising solventless techniques are headspace, membrane,
and sorbent approaches. SFE is able to selectively remove
semivolatile and nonvolatile trace components from solid
matrices, but field implementation of this technology is very
www.pdfgrip.com
6 I Fundamental Extraction Techniques
difficult since it uses heavy and inconvenient components.
However, new developments in the technology, such as miniaturized fluid delivery systems,12 will aid on-site implementations of this technology.
1.2. FUNDAMENTALS
As the preceding discussion and Figure 1.2 indicate, there
is a fundamental similarity among extraction techniques used
in the sample preparation process. In all techniques, the
extraction phase is in contact with the sample matrix, and
analytes are transported between the phases. For exhaustive
techniques, the phase ratio is higher and geometries are more
restrictive to ensure the quantitative transfer of analytes compared with nonexhaustive approaches. The thermodynamics
of the process are defined by the extraction phase–sample
matrix distribution constant. It is instructive to consider in
more detail the kinetics of processes occurring at the extraction phase–sample matrix interface since this defines the
time of the analytical procedure. In many cases, the analytes
are re-extracted from the extraction phase, but this step is
not discussed here since this process is analogous and much
simpler in principle compared with removing analytes from
a more complex sample matrix. The main objective of this
chapter is to outline the common fundamental principles
among various extraction techniques to facilitate a better
understanding of selection criteria for appropriate techniques, device geometries, and operational conditions.
1.2.1. Thermodynamics
The fundamental thermodynamic principle common to all
chemical extraction techniques involves the distribution of
analyte between the sample matrix and the extraction phase.
1.2.1.1. Distribution constant. When a liquid is used
as the extraction medium, then the distribution constant, Kes,
K es = ae as = Ce Cs ,
(1.1)
defines the equilibrium conditions and ultimate enrichment
factors achievable in the technique, where ae and as are the
activities of analytes in the extraction phase and matrix,
correspondingly, and can be approximated by the appropriate concentrations. Figure 1.4 shows the schematic example
of the extraction system for LLE. For solid extraction phase
Ce
ae
Organic Phase
Cs
as
Aqueous Phase
Figure 1.4. Partitioning between aqueous sample matrix and
organic extraction phase. Copyright Wiley-VCH, 1997.
Reprinted with permission.
adsorption, equilibria can be explained by the following
equation:
K ess = Se Cs ,
(1.2)
where Se is the solid extraction phase surface concentration
of adsorbed analytes. The relationship above is similar to
Equation 1.1, except that the extraction phase concentration
is replaced with surface concentration. The Se term in the
numerator indicates that the sorbent surface area available
for adsorption must also be considered. This complicates the
calibration at equilibrium conditions because of displacement effects and the nonlinear adsorption isotherm.13 These
equations can be used to calculate the amount of analyte in
the extraction phase at equilibrium conditions.4 For example,
for equilibrium liquid microextraction techniques and large
samples, including direct extraction from the investigated
system, the appropriate expression for the amount of analyte,
n, is very simple,
n = K esVeCs ,
(1.3)
where Kes is the extraction phase–sample matrix distribution
constant, Ve is the volume of the extraction phase, and Cs is
the concentration of the sample. This equation is valid when
the amount of analytes extracted is insignificant compared
with the amount of analytes present in a sample (large Vs
and/or small Kes), resulting in negligible depletion of analyte
concentration in the original sample. In Equation 1.3, Kes
and Ve determine the sensitivity of the microextraction
method, whereas Kes determines its selectivity. The sample
volume can be neglected, thus integrating sampling and
extraction without the need for a separate sampling procedure, as discussed in more detail later. The nondepletion
property of the small dimensions typically associated with
microextraction systems results in minimum disturbance of
the investigated system, facilitating convenient speciation,
investigation of multiphase distribution equilibria, and
repeated sampling from the same system to follow a process
of interest.
When significant depletion occurs, the sample volume,
Vs, has some impact on the amount extracted and, therefore,
on sensitivity.14 This effect can be calculated using the following equation:
n=
K esVeC0Vs
.
K esVe + Vs
(1.4)
In heterogeneous samples (headspace, immiscible liquids,
and solids), the components of the sample partition in the
multiphase system and are less available for extraction. This
effect depends on analyte affinities and capacities of the
competing phases and can be calculated if appropriate
volumes and distribution constants are known. The distribution constants are dependent on various parameters including temperature, pressure, and sample matrix conditions
such as pH, salt, and organic component concentration. All
these parameters need to be optimized for maximum transfer
of analytes to the extraction phase during the method devel-
www.pdfgrip.com
1 Theory of Extraction 7
opment process. In practice, however, kinetic factors defined
by the dissociation constants, diffusion coefficient, and agitation conditions frequently determine the amounts of
extracted analytes from complex samples since the overall
rates are slow, and therefore, extraction amounts for timelimited experiments do not reach equilibrium values.
1.2.1.2. Matrix effects. Two potential complications
are typically observed when extracting analytes from
complex matrices. One is associated with competition
among different phases for the analyte and the other with
the fouling of the extraction phase, because of the adsorption
of macromolecules such as proteins and humic materials at
the interface. The components of heterogeneous samples
(including headspace, immiscible liquids, and solids) partition in the multiphase system and are less available for
extraction. This effect depends on analyte affinity and the
volume of the competing phases and can be estimated if
appropriate volumes and distribution constants are known.
The mass of an analyte extracted by an extraction phase in
contact with a multiphase sample matrix can be calculated
using the following equation:
n=
K esVeC0Vs
i =m
K esVe + ∑ K isVi + Vs
,
(1.5)
i =1
where K is = Ci∞ Cs∞ is the distribution constant of the analyte
between the ith phase and the matrix of interest.15 Equation
1.5 simplifies to Equation 1.4 if there are no competing
phases in the sample matrix.
The typical approach used to reduce fouling of the extraction phase involves the introduction of a barrier between the
sample matrix and the extraction phase to restrict transport
of high-molecular-weight interferences (Fig. 1.5). For
example, the extraction phase can be surrounded by a porous
membrane with pores smaller than the size of the interfering
macromolecules (Fig. 1.5a), for example, use of a dialysis
membrane with the appropriate molecular weight cutoff.
This approach is conceptually similar to membrane dialysis
a
b
from complex matrices, in which the porous membrane is
used to prevent large molecules from entering the dialyzed
solution.16 Membrane separation has also been used to
protect SPME fibers from humic material.17 More recently,
hollow fiber membranes have been used in solvent microextraction, both to support the small volume of solvent and
to eliminate interferences when extracting biological fluids.18
This concept has been further explored by integrating the
protective structure and the extraction phase in individual
sorbent particles, resulting in restricted access material
(RAM).19 The chemical nature of the small inner pore
surface of the particles is hydrophobic, facilitating extraction of small target analytes, whereas the outer surface is
hydrophilic, thus preventing adsorption of excluded large
proteins. In practice, fouling of the hydrophobic interface
occurs to a large extent only when the interfering macromolecules are hydrophobic in nature.
A gap made of gas is also a very effective separation
barrier (Fig. 1.5b). Analytes must be transported through the
gaseous barrier to reach the coating, thus resulting in exclusion of nonvolatile components of the matrix. This approach
is practically implemented by placing the extraction phase
in the headspace above the sample; it results in a technique
such as headspace SPME, which is suitable for extraction of
complex aqueous and solid matrices.20 The major limitation
of this approach is that the rates of extraction are low for
poorly volatile or polar analytes, because of their small
Henry’s law constants. In addition, sensitivity for highly
volatile compounds can suffer, because these analytes have
high affinity for the gas phase, where they are concentrated.
The effect of the headspace on the amount of analytes
extracted and, therefore, on sensitivity can be calculated
using Equation 1.5, which indicates that reducing its gaseous
volume minimizes the effect.
Extraction at elevated temperatures enhances Henry’s
law constants by increasing the concentrations of the analytes in the headspace; this results in rapid extraction by the
extraction phase. The coating/sample distribution coefficient
also decreases with increasing temperature; however, this
results in diminution of the equilibrium amount of the
analyte extracted. To prevent this loss of sensitivity, the
extraction phase can be cooled simultaneously with sample
heating. This “cold finger” effect results in increased accumulation of the volatilized analytes on the extraction phase.
This additional enhancement in the sample matrix–extraction
phase distribution constant associated with the temperature
gap present in the system can be described by the
equation,21
KT = K0
Figure 1.5. Integrated cleanup and extraction using selective
barrier approaches based on size exclusion with a porous
membrane (a) and based on volatility with a headspace gap (b).
Copyright Wiley-VCH, 1997. Reprinted with permission.
Ts
T
⎡ Cp ⎛ ΔT
exp ⎢ ⎜
+ ln e
Te
Ts
⎣ R ⎝ Te
⎞⎤
⎟⎥ ,
⎠⎦
(1.6)
where KT = Ce(Te)/Cs(Ts) is the distribution constant of the
analyte between cold extraction phase on the fiber having
temperature Te and hot headspace at temperature Ts; Cp
is the constant-pressure heat capacity of the analyte;
www.pdfgrip.com
8 I Fundamental Extraction Techniques
ΔT = Ts − Te; and K0 is the coating/headspace distribution
constant of the analyte when both coating and headspace are
at temperature Te. Because of enhancement of the sample
matrix–extraction phase distribution constant, quantitative
extraction of many analytes,22 including volatile compounds,
is possible with this method.23
1.2.1.3. Characteristics of the extraction phase. The
properties of the extraction phase should be carefully optimized, because they determine the selectivity and reliability
of the method. These properties include both bulk physicochemical properties, for example, polarity, and physical
properties, for example, thermal stability and chemical inertness. Solvents and liquid polymeric phases, for example,
polydimethylsiloxane (PDMS),24 are very popular because
they have wide linear dynamic ranges associated with linear
absorption isotherms. They also facilitate “gentle” sample
preparation, because chemisorption and catalytic properties,
frequently associated with solid surfaces, are absent. No loss
or modification of the analyte occurs during extraction and/
or desorption. Despite these attractive properties of liquid
extraction media, solid phases are frequently used because
of their superior selectivity and extraction efficiency for
some groups of compounds. For example, carbon-based sorbents are effective for extraction of volatile analytes.
The development of selective extraction materials often
parallels that of the corresponding selective chemical
sensors.25 Similar manufacturing approaches and structures
similar to those of sensor surfaces have been implemented
as extraction phases. For example, phases with specific
properties, such as molecularly imprinted polymers26 and
immobilized antibodies,27 have recently been developed for
extraction. These types of sorbents rely on differences
between bulk properties of the extraction phase, and the
highly specific molecular recognition centers dissolved in it
to facilitate high-selectivity extraction with minimum nonspecific adsorption.28 In addition, chemically tuneable properties of the extraction phase can be controlled during the
preparation procedure. For example, polypyrrole has been
used successfully for a range of applications ranging from
ion exchange extraction to hydrophobic extraction based on
selective interaction between the polymer and the target
analytes.29 In addition, tuneable properties of the polymer,
for example, the oxidation/reduction equilibrium in conductive polypyrrole, can be explored to control adsorption and
desorption.30
Demands on the specificity of extraction phases are typically less stringent than for sensor surfaces, because a powerful separation and quantification technique, for example,
GC-MS or LC-MS, is usually used after extraction, facilitating accurate identification of the analyte. More demand
is placed, however, on the thermal stability and chemical
inertness of the extraction phase, because the extraction
materials are frequently exposed to high temperatures and
different solvents during extraction and introduction to the
analytical separation instruments. New coating chemistries,
for example, the sol-gel polymerization approach, have been
developed to address these needs.31
To optimize sensitivity, the choice of the extraction phase
is frequently based on its affinity toward the target analyte.
In practice, however, kinetic factors defined by dissociation
constants, diffusion coefficients, and agitation conditions
frequently determine the amounts of analytes extracted from
complex samples. Because overall extraction rates are slow,
the amounts of analytes extracted during experiments of
limited duration do not reach equilibrium values.
1.2.2. Kinetics
1.2.2.1. LLE. It is instructive to consider a simple case
of static extraction of water with organic solvent, as illustrated in Figure 1.6 to consider the effects of different
parameters on extraction kinetics. An appropriate equation
showing concentration profiles in each of the phases can be
obtained by solving Fick’s second law differential equation
for appropriate boundary conditions:
∂C ( x, t )
∂ 2 C ( x, t )
=D
.
∂t
∂x 2
(1.7)
If no convection is present in the system, the distribution
constant is defined by Equation 1.1, and the two phases are
placed in contact with each other at t = 0, then, the solution
can be found using a Laplace transform approach for aqueous
sample phase (x < 0) to be
(
)
z
+ erf z tDs
K es
Cs ( x, t ) = C0
.
z
1+
K es
For organic extraction phase (x > 0),
Ce ( x, t ) = C0
{
(
z 1 − erf x z tDe
1+
z
K es
)} ,
(1.8a)
(1.8b)
where C0 is the initial concentration of the analyte in the
aqueous phase, De and Ds are the diffusion of analyte in the
extraction phase and in the sample, respectively; z = De/Ds;
and Kes is an appropriate distribution constant defined by
Equation 1.1. The solution to the above equation is shown
graphically in Figure 1.6 for several extraction times when
diffusion of analytes in aqueous and organic phases is
10−5 cm2/s. Figure 1.6 illustrates that the concentration gradient is decreasing and extending deeper into both phases as
a function of time. The flux of analytes is decreasing proportionally with decrease in the gradient. The concentration
effect of analytes at the boundary on the organic side compared with the bulk aqueous concentration is not observed
at the beginning of extraction due to the drop of the concentration on the aqueous side. Therefore, a decrease in boundary layer thickness and the diffusion length by agitation of
one or both phases increases the rate of extraction dramati-
www.pdfgrip.com
1 Theory of Extraction 9
Boundary
C0
Flow
Convection
A
B
C(x,t)
C
Aqueous
Organic
D
kd
Dc
K
DF
A(EP,P)
A(M,S) A(M,L) A(M,I)
D
A(EP,B)
C
B
A
0
–2.0
–1.0
0.0
1.0
Particle Core
2.0
x (mm)
Organic Material
Figure 1.6. Concentration profiles at the interface between
infinite volume sample and extraction phases for analyte
characterized by identical diffusion coefficient in aqueous and
organic phase (10−5 cm2/s). The profiles correspond to A, 1 s;
B, 10 s; C, 100 s; D, 1000 s after merging both phases. Copyright
Wiley-VCH, 1997. Reprinted with permission.
cally. The effects of agitation can be calculated using the
boundary layer model described later. One other way to
improve mass transfer is to use thin films of sample matrix
and/or extraction phase to decrease the diffusion length. In
addition, a combination of agitation of the sample and use
of a thin extraction phase also facilitate shorter extraction
times. If the extraction media and matrix phases are of different states of matter, then it is more critical to overall
extraction kinetics to agitate or use the thin-film format of
the phase, since it is characterized by a smaller diffusion
coefficient. For example, when extracting gas or liquid
samples with PDMS, it is critical to disperse the extraction
phase as a thin film so the equilibrium between the phases
may be rapidly reached.
1.2.2.2. Extraction of solids. The most challenging
extractions occur when a solid is present as a part of the
sample matrix. This case can be considered as the most
general example of extraction since it involves a number of
fundamental processes occurring during extraction. If we
assume that a matrix particle consists of an organic layer on
an impermeable but porous core and the analyte is adsorbed
onto the pore surface, the extraction process can be modeled
by considering several basic steps as shown in Figure 1.7.
To remove the analyte from the extraction vessel, the compound must first be desorbed from the surface (A(M,S), Fig.
1.7); then, it must diffuse through the organic part of the
matrix (A(M,L)) to reach the matrix/fluid interface (A(M,I)).
At this point, the analyte must be solvated by the extraction
phase (A(EP,P)), and then it must diffuse through the static
phase present inside the pore to reach the portion of the
extraction phase influenced by convection, to be transported
through the interstitial pores of the matrix, and eventually
reach the bulk of the extraction phase (A(EP,B)). The simplest way to design a kinetic model for this problem is to
adopt equations developed by engineers to investigate mass
transport through porous media.32,33
Figure 1.7. Processes involved in the extraction of
heterogeneous samples containing porous solid particles.
The symbols/terms in the figure are discussed in the text.
Copyright Wiley-VCH, 1997. Reprinted with permission.
For the purpose of this discussion, we consider the efficient and frequently applied experimental arrangement for
removing solid-bound semivolatile analytes, involving the
use of a piece of stainless steel tubing as the extraction
vessel. The sample is typically placed inside the tubing and
a linear flow restrictor is attached to maintain the pressure
at the end of the vessel. During the process, the extraction
phase continuously removes analytes from the matrix, which
are then transferred to the collection vessel after the expansion of the fluid. This leaching process is very similar to
chromatographic elution with packed columns, particularly
to the frontal method. The main difference is that in sample
preparation, analytes are dispersed in the matrix at the beginning of the experiment, while in chromatographic frontal
analysis, a long plug is introduced into the column at the
initial stage of the separation process. The principal objective of the extraction is to remove analytes from the vessel
in the shortest period of time, requiring elution conditions
under which the analytes are unretained. In chromatography,
on the other hand, the ultimate goal is to separate components of the sample, which requires retention of analytes in
the column. Another major difference is that the packing
matrix is usually well characterized in chromatography, but
in sample preparation, it is often unknown.
One way to develop a mathematical model for this extraction approach is to establish the mass balance equation for
the system after careful consideration of the individual mass
transfer steps occurring during the extraction process (see
Fig. 1.7) and specific boundary conditions.34 Extensive
investigations on similar topics have already been conducted
by engineers who have studied the mass transfer in porous
media12 and chromatographers.13 In these studies, the relationship between various matrix parameters and flow conditions on the elution profile were described mathematically
and verified experimentally. In chromatography, this relationship is usually described as contributions from each
of the mass transfer steps to the height equivalent to
www.pdfgrip.com
10 I Fundamental Extraction Techniques
a theoretical plate (HETP). The overall performance of the
system can be defined as the sum of the relevant individual
components judiciously selected to reflect the most significant individual steps present in the elution process. For the
purpose of this discussion, this approach is adopted to
develop a model for extraction kinetics in flow-through
techniques.
The effect of slow desorption kinetics of analytes from
the matrix on the elution profile can be described as the
contribution to the HETP,8 hRK,
hRK =
2 k ue
,
(1 + k )2 (1 + ko ) kd
(1.9)
where k is the partition ratio; kd is the dissociation rate constant of the analyte–matrix complex of reversible process;
ko is the ratio of the intraparticulate void volume to the
interstitial void space and is expressed as
ko =
ε i (1 − εe )
,
εe
(1.10)
where εi is intraparticulate porosity and εe is interstitial
porosity; and ue is the interstitial linear extraction phase
velocity expressed as
ue = u (1 + ko ) ,
hED = 2λdp ,
2
k
dc2
ue,
3 ( k + 1)2 Ds
(1.12)
where dc is the thickness of the matrix component permeable
to analyte and Ds is the diffusion coefficient of the analyte
in the sample matrix.
The analytes migrate in and out of a pore structure of the
matrix during the elution. This can be described as resistance
to mass transfer in the fluid associated with the porous nature
of the environmental matrices, which gives rise to the following HETP component, hDP,
θ ( ko + k + k ko ) dp2ue
(1.14)
where λ is a structural parameter and is close to 1 for spherical matrix particles. This contribution to band broadening is
the most important factor in high-performance liquid chromatography (HPLC) separations, and it is expected to remain
significant in extractions because matrices typically have
large particle sizes.
In addition, we should also consider analyte diffusion
along the axis of the vessel (longitudinal diffusion), which
can be defined as hLD,
hLD =
(1.11)
where u = L/t0 is the chromatographic linear velocity; L is
the length of the extraction vessel; and t0 is the time required
to remove one void volume of the extraction phase from the
vessel. Chromatographic and interstitial linear velocities are
identical if matrix particles have low porosity. This analysis
can be extended to elution through a matrix having multiple
adsorption sites characterized by different dissociation rate
constants by using the approach described by Giddings.35
The diffusion of the analyte in the liquid or swollen solid
part of the matrix is important when polymeric materials are
extracted, or the matrix has substantial organic content. Its
contribution can be expressed as hDC,
hDC =
and therefore, Dp = De, where De is the diffusion coefficient
of the analyte in the extraction phase. This contribution can
be quite important considering the relatively large particle
size (about 1 mm) of environmental matrices and becomes
particularly important when the pores are filled with dense
organic material, such as humic matter rather than the
extraction phase.
In the flowing bulk of the fluid, an analyte experiences
resistance to mass transfer associated with eddy diffusion
(random paths of the analytes through the vessel filled with
the particles), which is given by hED,
γ M De
,
ue
(1.15)
where γM is the obstruction factor that characterizes the
structure of the matrix. The contribution of this component
is expected to be small. The analyte concentration profile
generated during the experiment as a function of time C(x,t)
can be represented using the equation that describes the
dispersion of a plug of finite width:9
⎧
⎛ L − x − ut
⎜
C ( x, t ) 1 ⎪
1+ k
= ⎨ ERF ⎜ 2
2⎪
C0
σ
2
⎜
⎩
⎝
⎞
⎛ L + x + ut
⎟
⎜2
1+ k
⎟ + ERF ⎜
σ
2
⎟
⎜
⎠
⎝
⎞⎫
⎟⎪
⎟⎬,
⎟⎪
⎠⎭
(1.16)
where L is the length of the vessel; C0 is the initial concentration of analyte in the extraction vessel; and σ is the mean
square root dispersion of the band expressed as
σ= H t
u
,
1+ k
(1.17)
where H is equivalent to the HETP in chromatographic
systems and is a sum of the contributions discussed above,
H = hRK + hDC + hDP + hED + hLD. The mass of analyte eluted
from the vessel during a given extraction time t can be
calculated from the following equation:
2
hDP =
30 ko (1 + ko ) (1 + k ) Dp
2
2
,
− 21 L
(1.13)
where θ is tortuosity factor for the porous particle, dp is the
diameter of the particulate matter, and Dp is the diffusion
coefficient of the analyte in the material filling the pores,
which, in most practical cases, will be an extraction phase,
m (t )
=
m0
∫ C ( x, t ) dx
−∞
Cs L
,
(1.18)
where m(t) is the extracted mass of analyte and m0 is the
total amount of analyte in the vessel at the beginning of the
www.pdfgrip.com
1 Theory of Extraction 11
experiment. We will refer to this function as the “time
elution profile” emphasizing the similarity of the extraction
process in this simple case to chromatographic elution.
1.2.2.3. Convolution model of extraction. The above
discussion applies only to the situation when the analytes
are initially present in a fluid phase, which, in flow-through
techniques, corresponds to elution of uniform spikes from
the extraction vessel, or when weakly adsorbed native analytes are removed from an organic-poor matrix such as sand.
In other words, the above relationships are suitable for
systems in which the partitioning equilibrium between the
matrix and extraction fluid is reached quickly compared with
the fluid flow. They are also suitable to model static/dynamic
extractions, under good solubility conditions (k = 0), in
which the sample is initially exposed to the static extraction
phase (vessel is capped) for a time required to achieve an
equilibrium condition prior to elution by fluid flow. If
dynamic extraction is performed from the beginning of
extraction, then in the majority of practical cases, the system
is not expected to achieve the initial equilibrium conditions.
This is because of slow mass transport between the matrix
and the fluid (e.g., slow desorption kinetics or slow diffusion
in the matrix). The expected relationship between amount
of analyte removed from the vessel versus time can be
obtained in this case by convoluting the function describing
the rate of mass transfer between the phases F(τ) with the
elution time profile m/m0(t) derived above (Eq. 1.18):36
τ=t
m (t − τ)
F ( τ ) dτ.
m0
τ=0
∫
(1.19)
The resulting function describes a process where elution
and mass transfer between the phases occur simultaneously.
In this discussion, we will refer to this function as the
“extraction time profile” to emphasize the point that in a
majority of extraction cases, these two processes are expected
to be combined. F(τ) describes the kinetics of the process,
which defines the release rate of analyte from the sample
matrix and can include, for example, the matrix–analyte
complex dissociation rate constant, the diffusion coefficient,
the time constant that describes the swelling of the matrix
that will facilitate the removal of the analyte, or a combination of the above. Detailed discussion, graphical representations, and applications of this model to describe and/or
investigate processes in SFE have been described in detail
elsewhere.37,38
The conclusion above can be stated in a more general
way. Convolution among functions describing individual
processes occurring during the extraction describes the
overall extraction process and represents a unified way to
describe the kinetics of these complex processes. The exact
mathematical solution to the convolution integral is frequently difficult to obtain, but graphical representation of
the solution can be calculated using Fourier transform
or numerical approaches. Frequently, it is possible to incor-
porate mathematical functions that describe a combination
of the unit processes. In the example of the flow-through
system discussed above, the elution function describes the
effect of porosity and analyte affinity toward the extraction
matrix on the extraction rate. It should be emphasized
that the convolution approach considers all processes
equivalently. In practice, however, a small number and
frequently just one unit process controls the overall rate of
extraction so the equations can be simplified by considering
this fact.
Determination of the limiting step is not possible exclusively by qualitative agreement with the mathematical model
since the effect on recovery of most of the unit processes
has an exponential decay nature. To properly recognize
them, quantitative agreement and/or effect of extraction
parameters need to be examined. Identification of the limiting process provides valuable insight on the most effective
approach to optimization of extraction.
1.3. OPTIMIZATION OF
THE EXTRACTION PROCESS
A fundamental understanding of the process leads to better
strategies for optimization of performance. In heterogeneous
samples, for example, the release of solid-bound analytes
from the sample matrix, through a reversal of chemisorption
or inclusion, frequently controls the extraction rate. By recognizing this fact, extraction parameters can be changed
to increase the extraction rates. For example, dissociation
of the chemisorbed analytes can be accomplished either
by using high temperature or application of catalysts.
Recognition of this fact led to the development of hightemperature SFE,39 followed by the evolution of both the hot
solvent extraction approach40 and microwave extraction,
with more selective energy focusing at the sample matrix–
extraction phase interface.41 There is also an indication that
milder conditions can be applied by taking advantage of the
catalytic properties of the extraction phase or additives.42
However, to realize this opportunity, more research needs
to be performed to gain insight about the nature of interactions between analytes and matrices. Benefits are not only
improved speed, but also selectivity resulting from application of appropriate conditions. This strategy of simultaneous
extraction and cleanup has been applied successfully to a
very difficult case of extraction of polychlorinated dibenzop-dioxins from fly ash.43
If the extraction rate is controlled by mass transport of
analytes in the pores of the matrix, then the process can be
successfully enhanced by application of sonic and microwave energy, which induce convection even in the small
dimensions of the pore. Frequently, diffusion through the
whole or portion of sample matrix containing natural or
synthetic polymeric material controls the extraction rate.44
In this case, swelling the matrix and increasing temperature
result in increased diffusion coefficients and, therefore,
increased extraction rates.
www.pdfgrip.com
12 I Fundamental Extraction Techniques
1.3.1. Flow-Through Techniques
For homogeneous samples and flowing fluid extraction
phase, the description of the extraction process is much
simpler and can be based directly on the chromatographic
theory for liquid stationary phases. Let us consider another
case of the flow-through system where the extraction phase
is dispersed as a thin layer inside the extraction bed, and the
sample flows through the cartridge. The bed can be constructed of a piece of fused-silica capillary, internally coated
with a thin film of extracting phase45 (a piece of open tubular
capillary GC column; in-tube SPME46), or the bed may be
packed with extracting phase dispersed on an inert supporting material (SPE cartridge). In these geometric arrangements, the concentration profile along the x-axis, of the
tubing containing the extracting phase as a function of time
t, can be described by adopting the expression for dispersion
of a concentration front:
ut
⎛
x− s
⎜
+k
1
C ( x, t ) = 0.5Cs ⎜ 1 − erf
σ
2
⎜
⎝
⎞
⎟
⎟,
⎟
⎠
(1.20)
where us is linear velocity of the sample through the tube, k
is the partition ratio defined as
k = K es
Ve
,
Vv
(1.21)
where Kes is the extraction phase–sample matrix distribution
constant, Ve is the volume of the extracting phase, and Vv is
the void volume of the tubing containing the extracting
phase. σ is the mean square root dispersion of the front
defined as
σ = Ht
us
,
1+ k
(1.22)
where H is equivalent to the HETP in chromatographic
systems. This can be calculated as a sum of individual contributions to the front dispersion. These contributions are
dependent on the particular geometry of the extracting
system, as discussed previously.
Figure 1.8 illustrates the normalized concentration
profiles produced in the bed during extraction.25 Full
breakthrough is obtained for the rightmost curve, which
corresponds to the breakthrough volume of the sample
matrix. The time required to pass this required volume
through this extraction system corresponds to the equilibration time of the compound with the bed.
Equation 1.20 and Figure 1.8 indicate that the front of
analyte migrates through the capillary/bed with speed proportional to the linear velocity of the sample, and inversely
related to the partition ratio. For in-tube SPME and short
capillaries with a small dispersion, the minimum extraction
time at equilibrium conditions can be assumed to be similar
to the time required for the center of the band to reach the
end of the capillary,
C/C0
1
0.5
0
0
0.5
1
1.5
2
2.5
3
x
L
Figure 1.8. Normalized concentration profiles for in-tube SPME
calculated using the equation discussed in the text. Copyright
Wiley-VCH, 1997. Reprinted with permission.
V
⎛
L ⎜ 1 + K es e
Vv
⎝
te =
us
⎞
⎟
⎠,
(1.23)
where L is the length of the capillary holding the extraction
phase. For packed bed extractors typically used in SPE techniques, analogous equations can be developed. In that case,
the calculated time corresponds to the maximum extraction
time before breakthrough occurs. As expected, the extraction time is proportional to the length of the capillary and
inversely proportional to the linear flow rate of the sample.
Extraction time also increases with an increase in the extraction phase–sample distribution constant and with the volume
of the extracting phase, but decreases with an increase of the
void volume of the capillary.
1.3.2. Batch Techniques
Coupling equations for systems involving convection caused
by flow through a tube, such as the discussion above, are
frequently not available for other means of agitation and
other geometric configurations. In these cases, the most successful approach is to consider the boundary layer formed
at the interface between the sample matrix and the extraction
phase. Independent of the agitation level, fluid contacting
the extraction phase surface is always stationary, and as the
distance from the surface increases, the fluid movement
gradually increases until it corresponds to bulk flow in the
sample. To model mass transport, the gradation in fluid
motion and convection of molecules in the space surrounding the extraction phase surface can be simplified as a zone
of a defined thickness in which no convection occurs, and
perfect agitation occurs in the bulk of the fluid everywhere
else. This static layer zone is called the Prandtl boundary
layer (Fig. 1.9).47
1.3.3. Boundary Layer Model
A precise understanding of the definition and thickness of
the boundary layer in this sense is useful. The thickness
of the boundary layer (δ) is determined by both the rate of
www.pdfgrip.com
1 Theory of Extraction 13
Extraction Phase
Boundary Layer
Sample
Concentration
t=0
Cs
Absorption
Adsorption
t = te
0
Position
Figure 1.9. Boundary layer model. Copyright Wiley-VCH,
1997. Reprinted with permission.
convection (agitation) in the sample and an analyte’s diffusion coefficient. Thus, in the same extraction process, the
boundary layer thickness will be different for different analytes. Strictly speaking, the boundary layer is a region where
analyte flux is progressively more dependent on analyte diffusion and less on convection, as the extraction phase is
approached. For convenience, however, analyte flux in the
bulk of the sample (outside of the boundary layer) is assumed
to be controlled by convection, whereas analyte flux within
the boundary layer is assumed to be controlled by diffusion.
δ is defined as the position where this transition occurs, or
the point at which convection toward the extraction phase is
equal to diffusion away. At this point, analyte flux from δ
toward the extraction phase (diffusion controlled) is equal
to the analyte flux from the bulk of the sample toward δ,
controlled by convection.
In many cases, when the extraction phase is dispersed
well to form a thin coating, the diffusion of analytes through
the boundary layer controls the extraction rate. The equilibration time, te, can be estimated as the time required to
extract 95% of the equilibrium amount and calculated for
these cases from the equation below:5
te = B
δbK es
,
Ds
(1.24)
where b is the extraction phase thickness; Ds is the analyte’s
diffusion coefficient in the sample matrix; Kes is the analyte’s distribution constant between the extraction phase and
the sample matrix; and B is a geometric factor referring to
the geometry of the supporting material upon which the
extraction phase is dispersed on. The boundary layer thickness can be calculated for given convection conditions using
engineering principles, and it is discussed in more detail
later. Equation 1.24 can be used to predict equilibration
times when the extraction rate is controlled by diffusion
in the boundary layer, which is valid for thin extraction
phase coatings (b < 200 μm) and high distribution constants
(Kes > 100).
a
b
Figure 1.10. Extraction using absorptive (a) and adsorptive
(b) extraction phases immediately after exposure of the phase to
the sample (t = 0) and after completion of the extraction (t = te).
Copyright Wiley-VCH, 1997. Reprinted with permission.
1.3.4. Solid versus Liquid Sorbents
There is a substantial difference in performance between
liquid and solid coatings (Fig. 1.10). In the case of liquid
coatings, the analytes partition into the extraction phase,
where the molecules are solvated by the coating molecules.
The diffusion coefficient in the liquid coating allows the
molecules to penetrate the whole volume of the coating
within a reasonable extraction time if the coating is thin (Fig.
1.10a). In the case of solid sorbents (Fig. 1.10b), the coating
has a well-defined crystalline or amorphous structure, which,
if dense, substantially reduces the diffusion coefficients
within the structure. Therefore, within the experimental
time, sorption occurs only on the porous surface of the
coating (Fig. 1.10b). During extraction by solid phase, compounds with poor affinity toward the phase are frequently
displaced at longer extraction times by analytes characterized by stronger binding, or those present in the sample at
high concentrations. This effect is associated with the fact
that there is only a limited surface area available for adsorption. If this area is substantially occupied, then a competition
effect occurs6 and the equilibrium amount extracted can vary
with concentrations of both the target and other analytes. On
the other hand, in the case of extraction with liquid phases,
partitioning between the sample matrix and extraction phase
occurs. In this case, equilibrium extraction amounts vary
only if the bulk coating properties are modified by the
extracted components, which only occurs when the amount
extracted is a substantial portion (a few percent) of the
extraction phase. This is rarely observed, since extraction/
enrichment techniques are typically used to determine trace
contamination samples; however, it cannot be neglected as
a possible cause of nonlinearity when quantifying very
complex matrices.
www.pdfgrip.com
14 I Fundamental Extraction Techniques
1.3.5. Diffusion-Based Calibration
The only way to overcome the fundamental limitation of
porous coatings, as suggested in Figure 1.10, is to use an
extraction time much less than the equilibrium time, so that
the total amount of analytes accumulated onto the porous
coating is substantially below the saturation value. At saturation, all surfaces available for adsorption are occupied.
When performing experiments with pre-equilibrium short
extraction times, it is critical to precisely control extraction
times and convection conditions since they determine the
thickness of the diffusion layer. One way of eliminating the
need for compensation of differences in convection is to
normalize (use consistent) agitation conditions. For example,
the use of a stirring means at a well-defined rotation rate in
the laboratory, or fans for field air monitoring, can ensure
consistent convection.48,49 The short-time exposure measurement described above has an advantage associated with the
fact that the rate of extraction is defined by diffusivity of
analytes through the boundary layer of the sample matrix
and corresponding diffusion coefficients, rather than by distribution constants. This situation is illustrated in Figure
1.11 for cylindrical geometry of the extraction phase dispersed on the supporting rod.
The analyte concentration in the bulk of the matrix can
be considered constant when a short sampling time is used
and there is a constant supply of an analyte via convection.
These assumptions are true for most cases of sampling,
where the volume of sample is much greater then than the
volume of the interface, and the extraction process does not
affect the bulk sample concentration. In addition, the solid
coating can be treated as a perfect sink. The adsorption
binding is frequently instantaneous and essentially irreversible. The analyte concentration on the coating surface is far
silica rod
pores
from saturation and can be assumed to be negligible for short
sampling times and relatively low analyte concentrations in
a typical sample. The analyte concentration profile can be
assumed to be linear from Cs to C0. In addition, the initial
analyte concentration on the coating surface, C0, can be
assumed to be equal to zero when extraction begins. Diffusion
of analytes inside the pores of a solid coating controls mass
transfer from the outer to the inner surface of the coating.
The function describing the mass of extracted analyte
with sampling time can be derived,50 which results in the
following equation:
n (t ) =
n (t ) =
solid coating
surface (A)
boundary layer
d+b
d
Cs
C0
(1.26)
nδ
.
B1Ds At
(1.27)
The amount of extracted analyte (n) can be estimated from
the detector response.
The thickness of the boundary layer (δ) is a function of
sampling conditions. The most important factors affecting δ
are the geometric configuration of the extraction phase,
sample velocity, temperature, and Ds for each analyte. The
effective thickness of the boundary layer can be estimated
for the coated fiber geometry (Fig. 1.11) using Equation
1.28, adapted from the heat transfer theory:
concentration profile
Figure 1.11. Schematic of the diffusion-based calibration model.
The symbols/terms are defined in the text. Copyright WileyVCH, 1997. Reprinted with permission.
B1Ds A
Cs t ,
δ
where t is the sampling time.51
It can be seen from Equation 1.26 that the amount of
extracted mass is proportional to the sampling time t, Ds for
each analyte and bulk sample concentration, and inversely
proportional to δ. This is consistent with the fact that an
analyte with a greater Ds will cross the interface and reach
the surface of the fiber coating faster. Values of Ds for each
analyte can be found in the literature or estimated from
physicochemical properties.25 This relationship allows for
quantitative analysis. Equation 1.26 can be rearranged to
estimate the analyte concentration in the sample for rapid
sampling with solid sorbents:
Cs =
us
(1.25)
where n is the mass of extracted analyte over sampling time
(t); Ds is the gas-phase molecular diffusion coefficient; A is
the surface area of the sorbent; δ is the thickness of the
boundary layer surrounding the extraction phase; B1 is a
geometric factor; and Cs is analyte concentration in the bulk
of the sample. It can be assumed that the analyte concentration is constant for very short sampling times, and therefore,
Equation 1.25 can be further reduced to
bulk air
movement
Ds
t
B1 ADs
Cs ( t ) dt ,
δ ∫0
δ = 9.52
d
,
Re0.62 Se0.38
(1.28)
where Re is the Reynolds number = 2usd/ν; us is the linear
sample velocity; ν is the kinematic viscosity of matrix; Sc is
the Schmidt number = ν/Ds; and d is the fiber diameter. The
www.pdfgrip.com
1 Theory of Extraction 15
effective thickness of the boundary layer in Equation 1.28
is a surrogate (or average) estimate and does not take into
account changes of the thickness that may occur when the
flow separates and/or a wake is formed. Equation 1.28 indicates that the thickness of the boundary layer will decrease
with an increase of the linear sample velocity (Fig. 1.11).
Similarly, when sample temperature (Tg) increases, the kinematic viscosity also increases. Since the kinematic viscosity
term is present in the denominator of Re and in the numerator
of Sc, the overall effect on δ is small. A reduction of the
boundary layer and an increase of the mass transfer rate for
an analyte can be achieved in at least two ways, that is, by
increasing the sample velocity and by increasing the sample
temperature. However, the temperature increase will reduce
the solid sorbent efficiency. As a result, the sorbent coating
may not be able to adsorb all molecules reaching the surface,
and therefore, may stop behaving as a zero sink for all
analytes.
1.3.6. Calibrants in the Extraction Phase
Internal standardization and standard addition are important
calibration approaches that are very effective when quantifying target analytes in complex matrices. They compensate
for additional capacity or activity of the sample matrix.
However, such approaches require delivery of the standard.
This is incompatible in some sampling situations, such as
on-site or in vivo investigations. The standard in the extraction phase approach is not practical for conventional exhaustive extraction techniques, since the extraction parameters
are designed to facilitate the complete removal of the analytes from the matrix. However, in microextraction, a substantial portion of the analytes remains in the matrix during
the extraction and after equilibrium is reached. This suggests
that the standard could be added to the investigated system
together with the extraction phase. This property of the
microextraction techniques has been explored to integrate
addition of the calibrant with the rest of automated highthroughput analysis.52 In addition, two calibration methods,
kinetic calibration with standard5,3,53 and standard-free
kinetic calibration, were proposed.54
1.3.6.1. Kinetic calibration with standard in the
extraction phase. Chen and Pawliszyn demonstrated the
symmetry of absorption and desorption in the SPME liquid
fiber coating, and a new calibration method, kinetic calibration, was proposed.53 This kinetic calibration method, uses
the desorption of the standards, which are preloaded in the
extraction phase, to calibrate the extraction of the analytes.
For field sampling, the desorption of standard from an
extraction phase can be described by
Q
= exp ( −at ) ,
q0
(1.29)
where q0 is the amount of pre-added standard in the extraction phase and Q is the amount of the standard remaining in
the extraction phase after exposure of the extraction phase
to the sample matrix for the sampling time, t.
Ai proposed a theoretical model based on a diffusioncontrolled mass transfer process to describe the entire kinetic
process of SPME:55,56
n = [1 − exp ( −at )]
K fsVf Vs
C0 ,
K fsVf + Vs
(1.30)
where a is a rate constant that is dependent on the extraction
phase, headspace, and sample volumes; the mass transfer
coefficients; the distribution coefficients; and the surface
area of the extraction phase.
Equation 1.30 can be changed to
n
= 1 − exp ( −at ) ,
ne
(1.31)
where ne is the amount of the extracted analyte at equilibrium. When the constant a has the same value for the absorption of target analytes and the desorption of preloaded
standards, the sum of Q/q0 and n/ne should be 1 at any
desorption/absorption time:53
n Q
+
= 1.
ne q0
(1.32)
Then, the initial concentrations of target analytes in the
sample, C0, can be calculated with Equation 1.33:57,58
C0 =
q0 n
,
K esVe ( q0 − Q )
(1.33)
where Ve is the volume of the extraction phase. Kes is the
distribution coefficient of the analyte between the extraction
phase and the sample.
The change of environmental variables will affect the
extraction of the analyte and the desorption of the preloaded
standard simultaneously; therefore, the effect of environmental factors, such as biofouling, temperature, or turbulence, can be calibrated with this approach. The feasibility
of this technique for time-weighted average (TWA) water
sampling was demonstrated by both theoretical derivations
and field trials.59
This technique is a pre-equilibrium method and can be
used for the entire sampling period. The concentration determined before the sampling reaches equilibrium is a TWA
concentration because the desorption of the preloaded standard calibrated the extraction of the analytes and the extraction is an integrative process. If the sampling reaches
equilibrium, the determined data are the concentrations of
the analytes in the sample at the time the samplers were
retrieved.
The standard in the extraction phase technique makes it
possible to use a simple PDMS rod or PDMS membrane as
a passive sampler to obtain the TWA concentrations of
target analytes in a sampling environment. Both PDMS-rod
and PDMS-membrane samplers are simple and easy to
deploy and retrieve. They have large sampling rates, and the
www.pdfgrip.com
16 I Fundamental Extraction Techniques
sensitivity is much higher than the fiber-retracted SPME
device since the samplers are in direct contact with the
sample matrix.60 The concept of calibrants in the extraction
phase has been extended to determine the concentrations of
target analytes directly in the veins of animals, indicating
that this approach is useful for in vivo studies as well.61
Experiments demonstrated that this calibration corrected for
the sample matrix effects and minimized the displacement
effects due to the use of pre-equilibrium extraction. The
pharmacokinetic profiles of diazepam, nordiazepam, and
oxazepam obtained by kinetic calibration based on deuterated standards are quite similar to those determined by standard calibration method.62 The applications of this technique
for quantitative analysis of liquid-phase microextraction
(LPME) were also reported.55
Deuterated compounds are expensive and sometimes not
available. Zhou et al. proposed an alternative calibration
method, which employs the target analytes as the internal
standards by the means of dominant desorption.63 Dominant
pre-equilibrium desorption not only offers a shorter sample
preparation time but also provides time constants for the
purpose of quantitative analysis. This kinetic calibration
method was successfully applied to on-site sampling of
polycyclic aromatic hydrocarbons (PAHs) in a flow-through
system and in vivo direct pesticide sampling in the leaves of
a jade plant.64
Using kinetic calibration with standard in the extraction
phase method, the samplers require preloading of a certain
amount of standards, either deuterated compounds or target
analytes. Zhao et al. reported several standard loading
approaches, which include (1) headspace extraction of the
standard dissolved in a solvent or pumping oil, (2) headspace extraction of pure standard in a vial, (3) direct extraction in a standard solution, and (4) direct transfer of the
standard solution from the syringe to the fiber.64
The existing SPME kinetic calibration technique, using
desorption of preloaded standards to calibrate extraction of
the analytes requires that the physicochemical properties
of the standard be similar to those of the analyte, which
limits the application of the technique. Recently, a new
method, termed the one-calibrant technique, which uses
only one standard to calibrate all extracted analytes, was
proposed.65 The theoretical considerations were validated in
a flow-through system, using PDMS SPME fibers as passive
samplers. The newly proposed one-calibrant technique
makes the SPME kinetic calibration method more convenient and more applicable.
1.3.6.2. Standard-free kinetic calibration. Kinetic
calibration with standard in the extraction phase can be used
for both grab sampling and long-term monitoring. For fast
on-site or in vivo analysis, preloading standards is inconvenient Also, this calibration method may not work in some
fast sampling situations because the loss of the standard will
be too small to detect. Recently, a standard-free kinetic calibration method was proposed for fast on-site and in vivo
analysis.54 With this calibration method, all analytes can be
directly calibrated with only two samplings.
Equilibrium extraction results in the highest sensitivity in
SPME because the amount of analyte extracted with the
fiber coating is maximized when equilibrium is reached. If
sensitivity is not a major concern in analysis, reduction of
the extraction time is desirable. When the extraction conditions are kept constant, for example, fast sampling, Equation
1.34 can be used for the calculation of ne, the amount of
analyte extracted at equilibrium:
t2 ⎛
n
ln ⎜ 1 − 1
t1 ⎝ ne
⎞
⎛ n2
⎟ = ln ⎜ 1 −
⎠
⎝ ne
⎞
⎟,
⎠
(1.34)
where n1 and n2 are the amount of analyte extracted at sampling times t1 and t2, respectively. Then, the concentration
of the analyte in the sample can be calculated with Equations
1.3 or 1.4.
The feasibility of this calibration method was validated
in a standard aqueous solution flow-through system and a
standard gas flow-through system. Using this standard-free
kinetic calibration method, the sampling time can be markedly shortened. In the reported study, typical sampling times
for the extraction of PAHs in a water environment, which
typically range from 2–24 h (equilibrium), can be shortened
to 2–5 min, and sampling times for benzene, toluene, ethylbenzene, and xylene (BTEX) in air can be shortened from
5–10 min to 5–10 s.54
This calibration method can be used for the entire sampling period, without considering whether the system reaches
equilibrium. This aspect of the technique is desirable for
systems when the equilibrium time is not known, and particularly useful for instances when a number of compounds
are measured simultaneously. The method is unsuitable for
long-term monitoring of pollutants in the environment since
the method requires that the sampling rate remains constant
and the determined concentration is therefore representative
of a spot sampling.
1.3.7. Headspace Extraction
Equations 1.24 and 1.26 indicate that the use of the headspace above the sample as an intermediate phase might be
an interesting approach to accelerate the extraction of analytes characterized by high Henry constants. When a thin
extraction phase is used, the initial extraction rate, and
hence, the extraction time, is controlled by the diffusion of
analytes through the boundary layer present in the sample
matrix. The presence of a gaseous headspace facilitates
rapid transport into the extraction phase because of the high
diffusion coefficients. To increase the transport from the
sample matrix into the headspace, the system can be designed
to produce a large sample/headspace interface. This can be
accomplished by using large diameter vials with good agitation, purge, or even spray systems. At room temperature,
only volatile analytes are transported through the headspace.
For low volatility compounds, heating of the sample is a
www.pdfgrip.com
1 Theory of Extraction 17
good approach, if loss in magnitude of the distribution constant is reasonable. The ultimate approach is to heat the
sample and cool the extraction phase at the same time.
Heating of the sample not only increases the Henry constant
but also induces convection of the headspace due to density
gradients associated with temperature gradients present in
the system, resulting in higher mass transport rates. On the
other hand, cooling the sorbent increases its capacity.
Collection of analytes can be performed in the same vial66
or can be separated in space, as in the purge-and-trap
technique. In the heating–cooling experiments, both kinetic
and thermodynamic factors are addressed simultaneously.
Headspace approaches are also interesting since adverse
affects associated with the presence of solid, oily, or highmolecular-weight interferences, which can cause fouling of
the extraction phase, are eliminated.
1.3.8. Passive TWA Sampling
Consideration of different arrangements of the extraction
phase is always beneficial in order to select the most appropriate geometry for a given application. For example, extension of the boundary layer by a protective shield that restricts
convection will result in TWA measurement of analyte concentration (Eq. 1.24). Various diffusive samplers have been
developed based on this principle. For example, when the
extracting phase in an SPME device is not exposed directly
to the sample, but is contained in a protective tubing (needle)
without any flow of the sample through it (Fig. 1.12), the
diffusive transfer of analytes occurs through the static
sample (gas phase or other matrix) trapped in the needle.
The system consists of an externally coated fiber with the
extraction phase withdrawn into the needle (Fig. 1.12b).
This geometric arrangement represents a very powerful
method, capable of generating a response proportional to the
integral of the analyte concentration over time and space
(when the needle is moved through space).67 In this case, the
only mechanism of analyte transport to the extracting phase
is diffusion through the matrix contained in the needle.
During this process, a linear concentration profile (shown in
Fig. 1.12b) is established in the tubing between the small
a
Z
b
c(t)
0
Z
needle opening, characterized by surface area A and the
distance Z between the needle opening and the position of
the extracting phase. The amount of analyte extracted, dn,
during time interval, dt, can be calculated by considering
Fick’s first law of diffusion:5
dn = ADm
ΔC ( t )
dc
dt = ADm
dt ,
dz
Z
(1.35)
where ΔC(t)/Z is an expression of the gradient established
in the needle between the needle opening and the position
of the extracting phase, Z; ΔC(t) = C(t) – CZ, where C(t) is a
time-dependent concentration of analyte in the sample in the
vicinity of the needle opening; and CZ is the concentration
of the analyte in the gas phase in the vicinity of the coating.
If CZ is close to zero for a high extraction phase/matrix
distribution constant capacity, then, ΔC(t) = C(t). The concentration of analyte at the coating position in the needle,
CZ, will increase with integration time, but it will be kept
low compared with the sample concentration because of the
presence of the extraction phase. Therefore, the accumulated
amount over time can be calculated as
n = Dm
A
Cs ( t ) dx.
Z∫
(1.36)
As expected, the extracted amount of analyte is proportional to the integral of the sample concentration over time,
the diffusion coefficient of analyte in the matrix filling the
needle, Dm, in the area of the needle opening, A, and inversely
proportional to the distance of the coating position with
respect to the needle opening, Z. It should be emphasized
that Equations 1.27 and 1.28 are valid only in a situation
where the amount of analyte extracted onto the sorbent is a
small fraction (below %RSD of the measurement, typically
5%) of the equilibrium amount with respect to the lowest
concentration in the sample. To extend integration times,
the coating can be placed further into the needle (larger Z),
the opening of the needle can be reduced by placing an
additional orifice (smaller A), or a higher capacity sorbent
can be used.68 The first two solutions will result in low
measurement sensitivity. An increase of sorbent capacity
presents a more attractive opportunity and can be achieved
by either increasing the volume of the coating or the affinity
of coating toward the analyte. An increase of the coating
volume will require an increase of the device size. Therefore,
the optimum approach to increased integration time is to use
sorbents characterized by large coating/gas distribution constants. If the matrix filling the needle is different than the
sample matrix, then, an appropriate diffusion coefficient
should be used, as discussed below in the case of membrane
extraction.
1.3.9. Extraction Combined with Derivatization
z
Figure 1.12. SPME/TWA approaches based on in-needle fiber.
Copyright Wiley-VCH, 1997. Reprinted with permission.
The capacity of the extraction phase for analytes that
are difficult to extract, such as polar or ionic species, is
www.pdfgrip.com