Surface enhanced vibrational spectroscopy
Bạn đang xem bản rút gọn của tài liệu. Xem và tải ngay bản đầy đủ của tài liệu tại đây (3.48 MB, 262 trang )
Surface-Enhanced
Vibrational Spectroscopy
Ricardo Aroca
University of Windsor, Ontario, Canada
www.pdfgrip.com
www.pdfgrip.com
Surface-Enhanced
Vibrational Spectroscopy
www.pdfgrip.com
www.pdfgrip.com
Surface-Enhanced
Vibrational Spectroscopy
Ricardo Aroca
University of Windsor, Ontario, Canada
www.pdfgrip.com
Copyright
C
2006
John Wiley & Sons Ltd, The Atrium, Southern Gate, Chichester,
West Sussex PO19 8SQ, England
Telephone (+44) 1243 779777
Email (for orders and customer service enquiries):
Visit our Home Page on www.wileyeurope.com or www.wiley.com
All Rights Reserved. No part of this publication may be reproduced, stored in a retrieval system or
transmitted in any form or by any means, electronic, mechanical, photocopying, recording, scanning
or otherwise, except under the terms of the Copyright, Designs and Patents Act 1988 or under the
terms of a licence issued by the Copyright Licensing Agency Ltd, 90 Tottenham Court Road,
London W1T 4LP, UK, without the permission in writing of the Publisher. Requests to the Publisher
should be addressed to the Permissions Department, John Wiley & Sons Ltd, The Atrium, Southern
Gate, Chichester, West Sussex PO19 8SQ, England, or emailed to , or faxed to
(+44) 1243 770620.
Designations used by companies to distinguish their products are often claimed as trademarks. All
brand names and product names used in this book are trade names, service marks, trademarks or
registered trademarks of their respective owners. The Publisher is not associated with any product
or vendor mentioned in this book.
This publication is designed to provide accurate and authoritative information in regard to the
subject matter covered. It is sold on the understanding that the Publisher is not engaged in rendering
professional services. If professional advice or other expert assistance is required, the services of a
competent professional should be sought.
Other Wiley Editorial Offices
John Wiley & Sons Inc., 111 River Street, Hoboken, NJ 07030, USA
Jossey-Bass, 989 Market Street, San Francisco, CA 94103-1741, USA
Wiley-VCH Verlag GmbH, Boschstr. 12, D-69469 Weinheim, Germany
John Wiley & Sons Australia Ltd, 42 McDougall Street, Milton, Queensland 4064, Australia
John Wiley & Sons (Asia) Pte Ltd, 2 Clementi Loop #02-01, Jin Xing Distripark,
Singapore 129809
John Wiley & Sons Canada Ltd, 22 Worcester Road, Etobicoke, Ontario, Canada M9W 1L1
Wiley also publishes its books in a variety of electronic formats. Some content that appears in print
may not be available in electronic books.
Library of Congress Cataloging-in-Publication Data
Aroca, Ricardo.
Surface enhanced vibrational spectroscopy / Ricardo Aroca.
p. cm.
Includes bibliographical references and index.
ISBN-13: 978-0-471-60731-1 (acid-free paper)
ISBN-10: 0-471-60731-2 (acid-free paper)
1. Vibrational spectra. 2. Molecular spectroscopy. 3. Raman effect, Surface enhanced.
I. Title.
QD96.V53A76 2006
543 .54–dc22
2005036662
British Library Cataloguing in Publication Data
A catalogue record for this book is available from the British Library
ISBN-13 978-0-471-60731-1
ISBN-10 0-471-60731-2
Typeset in 10.5/13pt Sabon by TechBooks, New Delhi, India
Printed and bound in Great Britain by TJ International, Padstow, Cornwall
This book is printed on acid-free paper responsibly manufactured from sustainable forestry
in which at least two trees are planted for each one used for paper production.
www.pdfgrip.com
To my wife Patricia, our children: Patricia Paulina, Marcela Susana
and Ricardo Andres, and our grandchildren: Miguel, Stéphane,
Natalia, Madison, Callum and Maria Elena
www.pdfgrip.com
www.pdfgrip.com
Contents
Preface
xi
Acknowledgments
xvii
Glossary
xix
1
Theory of Molecular Vibrations. The Origin of
Infrared and Raman Spectra
1.1 Electronic, Vibrational, Rotational and
Translational Energy
1.1.1 Electronic Structure of Molecules
1.2 Separation of Nuclear and Electronic Motions
1.2.1 Example. The Potential Energy
Function of Diatomic Molecules
1.3 Vibrations in Polyatomic Molecules
1.4 Equilibrium Properties. Dipole Moment and
Polarizability
1.5 Fundamental Vibrational Transitions in the
Infrared and Raman Regions
1.6 Symmetry of Normal Modes and
Vibrational States
1.7 Selection Rules
1.8 The Example of ab initio Computation of the
Raman and Infrared Spectra
1.8.1 Conventions for Molecular Axes
1.9 Vibrational Intensities
1.9.1 Raman Intensities
1.10 Definition of Cross-Section
1.11 The Units of Energy and Force Constants
References
www.pdfgrip.com
1
1
2
4
6
7
10
12
13
18
20
24
24
29
29
31
32
viii
2
3
4
CONTENTS
The Interaction of Light with Nanoscopic Metal
Particles and Molecules on Smooth Reflecting Surfaces
2.1 Electric Permittivity and Refractive Index
2.2 Propagation of Electromagnetic Waves and the
Optical Properties of Materials
2.2.1 Frequency Dispersion in Solids
2.2.2 Metals
2.3 Scattering and Absorption by
Nanoscopic Particles
2.3.1 Scattering and Absorption
Computations
2.3.2 Mie Computations
2.4 Reflection–Absorption Infrared Spectroscopy
on Smooth Metal Surfaces
2.4.1 Reflection Coefficients and Reflectance
2.4.2 Reflection–Absorption Infrared
Spectroscopy (RAIRS)
2.4.3 RAIRS Example
References
Surface-Enhanced Raman Scattering (SERS)
3.1 Electromagnetic Enhancement Mechanism
3.1.1 Definition of SERS
3.1.2 Single Particle SERS Model Systems
3.1.3 Spherical Model
3.1.4 The Spheroidal Model
3.1.5 The Shape Factor, Aggregates
and Fractals
3.1.6 Distance Dependence
3.1.7 Coverage Dependence of SERS
References
Chemical Effects and the SERS Spectrum
4.1 Physical and Chemical Adsorption
4.2 SERS/SERRS of Physically Adsorbed Molecules
4.3 SERS of Chemically Adsorbed Molecules
without Electronic Resonance Excitation
4.4 SERS of Chemically Adsorbed Molecules with
Charge Transfer Excitation
www.pdfgrip.com
35
38
41
45
48
50
53
57
59
60
64
65
69
73
76
76
77
79
85
89
92
96
101
107
107
112
113
122
CONTENTS
ix
4.5
Metal–Molecule or Molecule–Metal
Charge Transfer
4.6 SERRS from a Surface Complex
References
124
127
129
5
Is SERS Molecule Specific?
References
133
138
6
SERS/SERRS, the Analytical Tool
6.1 Average SERS on Metal Colloids. Preparation
and Properties
6.1.1 Silver Colloids
6.1.2 Gold Colloid
6.1.3 Copper Colloid
6.2 Metal Colloids. The Background SERS
6.3 Metal Colloids. Maximizing the Average SERS
in Solution
6.4 Average SERS on Metal Island Films
6.5 Average SERS on Rough Electrodes
6.6 Ultrasensitive SERS Analysis and Single
Molecule Detection
6.7 Uniqueness of Ultrasensitive Chemical
Analysis. The Moving Target
6.8 Applications and Outlook
References
141
7
Surface-Enhanced Infrared Spectroscopy
7.1 Overview
7.2 Theoretical Models for SEIRA
7.3 SEIRA-Active Substrates
7.4 Interpretation of the Observed SEIRA Spectra
7.5 Applications of SEIRA
7.5.1 SEIRA of Ultrathin Films
7.5.2 Surface Photochemistry and Catalytic
Reactions
7.5.3 Electrochemistry
7.5.4 Analytical Applications
References
Index
143
144
146
148
149
152
156
162
164
171
174
176
185
185
192
198
203
210
210
211
211
212
214
223
www.pdfgrip.com
www.pdfgrip.com
Preface
Everything is vague to a degree you do not realize till you have tried to make it
precise.
Bertrand Russell
British author, mathematician, and philosopher (1872–1970)
Surface-enhanced Raman scattering (SERS) is a moving target. Every
time you look at it, it mutates, and new speculations are suddenly on the
horizon. This elusiveness seems to defy our ability to predict the outcome
of each new SERS experiment. The uncertainty is even more challenging when one approaches the single molecule regime (single molecule
detection – SMD), since the attempt at experimental measurement of
SERS may actually affect the molecule, or the nanostructures interacting
with the molecular system, or both. However, one should not be surprised by this lack of determinism. While it is often taken for granted
in the analytical spectroscopy of ensemble averages, it is particularly
significant in ultrasensitive chemical analysis where one is dealing with
only a few quantum systems (molecules) and nanostructures, with pronounced quantum effects. The difficulty is compounded by the fact that
the enhanced signal is the result of several contributions, and their separation into well-defined components is virtually impossible. Observed
SERS spectra are the final result of multiple factors, and the contribution
of these factors is case specific. It is therefore of the utmost importance
to examine and analyze closely the set of variables that may play a role
in producing observed SERS spectra.
In this book, SERS is narrowly defined as surface plasmon-assisted
enhancement of Raman scattering. Therefore, the term SERS is used
for molecules located on, or close to, nanostructures that can support
surface plasmons leading to an electromagnetic (EM) field enhancement
www.pdfgrip.com
xii
PREFACE
of the Raman signal. This definition excludes smooth surfaces with only
nonradiative plasmons and small atomic clusters where surface plasmons
are not realized. There is consensus on the electromagnetic origin and
fundamental properties of the signal enhancement of SERS, as assisted by
surface plasmon excitation on certain nanostructures. Thus, the presence
of this component in the observed enhanced intensity will define the
observed spectrum as a SERS spectrum.
Defining SERS in terms of one of the components of the observed enhanced intensity may, at first, seem limited and narrow. However, this
definition provides the basis for a full discussion of the observations,
and also a guide for the experimentalist to tune experimental conditions
according to the ultimate goal of their research project. The definition
does not necessarily imply that the plasmon assisted contribution ought
to be the largest; other resonances may contribute and, in some cases,
produce dominant contributions. However, it is the presence of the plasmon resonance that will define the observed spectral intensities as a SERS
spectrum. In addition to this binding definition, the main thrust of the
book is to discuss only two of the many enhanced optical phenomena
in surface-enhanced spectroscopy: surface-enhanced Raman scattering
(SERS) and surface-enhanced infrared absorption (SEIRA). SERS and
SEIRA form a new branch of vibrational spectroscopy, which we now
call surface-enhanced vibrational spectroscopy (SEVS), and it serves as
the title for the book. SEVS deals with the enhanced spectra of molecules
on specially fabricated nanostructures with the ability to support surface plasmons and to enhance optical signals. Stable molecular electronic
states are characterized by their vibrational structure [1–3], and the great
advantage of vibrational spectroscopy, which can provide the fingerprint
of any molecular system, is in the vast body of vibrational assignment
data for gas, liquid, solid and, most relevant to SEVS, surface complex
systems. SEVS is an extremely powerful addition to surface-sensitive and
single molecule spectroscopies (SMS). From the analytical perspective, a
concentrated sample of an analyte (the adsorbed molecule to be assessed)
should form complete monolayer coverage on the surface plasmon supporting nanostructure. However, SERS and SEIRA are not limited to the
first monolayer and, indeed, the EM enhancement is a long-range phenomenon that decays more slowly than the field dipole. That being said,
the first layer will dominate the SEVS spectrum, and it is the spectrum
of this layer that could be used for the compilation of a database. Ultrasensitive analysis in SERS will start at monolayer coverage and move in
the direction of submonolayer coverage, to achieve the ultimate single
molecule–nanostructure limit. Selection rules derived for infrared and
www.pdfgrip.com
PREFACE
xiii
Raman spectra [2] also apply to adsorbed species, with some additional
qualifications. For highly reflecting surfaces in the infrared region, only
those vibrational modes with a component of the dynamic dipole perpendicular to the surface are observed. These stringent ‘surface-selection
rules’ could severely limit the relative intensities in the recorded infrared
spectrum. At the same time, this new spectrum provides information on
the molecular orientation and molecule–surface interaction. The surfaceselection rules that apply to infrared and Raman spectroscopy are extended to SEVS with yet additional qualifications imposed by the nature
of the local field and/or the roughness of the surface used for SEVS.
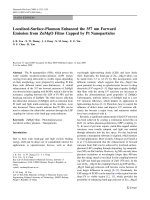
The definition and the main components are illustrated in the cartoon
shown in Figure 1, where single particles and clusters of particles supporting surface plasmons are interacting with a molecular probe.
e (w)
e (w)
SEIRA on Au
Plasmon
SERS
on Ag
300
500
700
Nanometers
900
600
800
1000 1200 1400
Wavenumbers/cm−1
1600
Figure 1 The three SEVS elements: the molecule, the electromagnetic radiation and
the nanostructure, with the resulting plasmon and surface-enhanced spectra.
www.pdfgrip.com
xiv
PREFACE
The study of vibrational energy levels, or vibrational spectroscopy,
is carried out mainly with infrared absorption or inelastic scattering
(Raman) [1–3] of electromagnetic radiation [4]. The quantum description
of the vibrating molecule provides the energy levels, and that is followed
by the study of the dynamics of the molecule–light interaction [5]. The
information obtained from Raman scattering and that gathered from
infrared absorption are complementary, to the point of being mutually
exclusive for centrosymmetric molecules. SEVS spectra are the result of
the molecule–light interaction when the molecule is near or attached to a
nanostructure supporting surface plasmons. In the end, regardless of the
mechanisms involved, the information, as in vibrational spectroscopy, is
contained in a Raman or an infrared spectrum, and the challenge is in
the interpretation of these spectra.
In vibrational spectroscopy, the molecular spectra are indeed ensembleaveraged spectra of many molecules. In SEVS, ensemble-averaged SERS
and SEIRA spectra also form the bulk of the accumulated spectroscopic
data. However, in the absence of the statistical average, the properties
of the SERS spectrum of a single molecule would be unique, since it is a
very sensitive probe of its environment. Hence it is profitable to make a
distinction between ‘average SERS’ spectra and ‘single molecule’ spectra.
The presence of a nanostructure, most commonly a noble metal nanostructure, with the intrinsic property of enhancing optical signals, may
leave its own footprints in the SEVS spectra. The nanostructure’s trail
can be detected in a characteristic frequency due to the surface complex, a frequency shift, a peculiar bandwidth, a distinct relative intensity or a temporal behavior giving rise to fluctuations of the signal. Enhancing nanostructures can be fabricated as isolated particles, nanorods,
nanowires or aggregates. However, in many applications of SEVS the
nanostructures are fabricated on to a solid substrate, and thereby further spectral features may be observed due to reflections and refraction
phenomena on the surface of the substrates. Inevitably, there exists the
danger of drawing the line in the wrong place when discussing vibrational
spectroscopy on surfaces and surface-enhanced vibrational spectroscopy.
The definition of SEVS, used here, separates the results obtained on ‘flat’
or smooth reflecting metal surfaces from the SEVS results obtained on
modified surfaces that contain enhancing nanostructures.
In summary, SEVS is the vibrational spectroscopy of molecules that
is realized on well-defined nanostructures. It is a new molecular spectroscopy that is highly dependent on the optical properties, size and shape
of metallic nanostructures. SERS, in particular, permits giant amplification of the optical signal and single molecule detection. At the SMD level,
www.pdfgrip.com
PREFACE
xv
temporal phenomena or fluctuations may be used as a probe for surface
dynamics. Observing and manipulating biomolecules in single molecule
spectroscopy may directly reveal their dynamic behavior, knowing that
to detect dynamic behavior of target molecules using ensemble-averaged
measurements is almost impossible. Experimentally, near-field scanning
optical microscopy (NSOM) has joined the common far-field Raman
scattering, making it possible to analyze optical properties with a spatial
resolution below the diffraction limit. In a parallel development, SEVS
is becoming a viable technique for nanoparticle characterization.
This book begins by devoting a chapter to reviewing the vibrating
molecule and the origin of infrared and Raman spectra. These are the
fundamentals and they provide the reference needed for the interpretation
of SEVS results. Chapter 2 contains brief discussions on the absorption
and scattering of light by metallic nanoparticles (important for SERS interpretation), the fabrication of nanostructures [6] and the selection of
the appropriate experimental conditions for SERS and SEIRA. Light absorption enhancement by nanoparticles and light scattering enhancement
by nanoparticles supporting surface plasmon are, in themselves, an active
field of research in physics and chemistry [7, 8]. The theory and detection
of surface plasmons of isolated particles of different size and shape [9]
have been advanced by several groups and the references can be found in
Chapter 2. Furthermore, aggregates of nanoparticles can sustain localized and delocalized surface plasmons, and highly localized modes, or hot
spots, allowing for the concentration of electromagnetic energy in small
parts of the system [10]. Finally, a section on reflection spectroscopy with
special attention to reflection–absorption infrared spectroscopy (RAIRS)
is also included to explain the effect that reflecting surfaces have on the
observed relative intensities of vibrational spectra.
Chapter 3 is dedicated to SERS as a surface plasmon-assisted spectroscopy. The most rudimentary models that provide guidance for the
experimentalist are also included. Chapter 4 is an attempt to examine
the chemical effects, or the role in the observed SERS spectra of contributions due to molecule–nanostructure interactions. Chapter 5 is dedicated to demonstrating that SERS is observed for any type of molecular
system, and is, thereby, not molecular specific. A database is provided on
the web for the thousands of references that were reviewed. These form a
catalog of molecules studied by SERS or SERRS, organized according to
the type of molecule system, and intended to help experimentalists who
would like to use SERS as an analytical tool. This is not a comprehensive database, but the time has come for the creation of a collection of
SERS spectra that will be useful for analytical applications. Chapter 6
www.pdfgrip.com
xvi
PREFACE
is an overview of SERS applications. Chapter 7 describes SEIRA and its
applications. Each chapter contains extensive citations to help the user
and to make the book a useful reference. The book contains a glossary
that is intended to be helpful given the multidisciplinary nature of SERS
(chemistry, solid-state physics, optics and electrodynamics).
Thousands of publications, many excellent reviews and, in particular,
the expanding analytical applications of SERS and SEIRA are of such
importance that there is a need for a text on methods and interpretation
of spectra. This book has been written with the intention of meeting,
in part, that need. Since much of the material covered in this book is
recent, it is not possible to feel as comfortable in the description and
of the subject as in a more settled field of spectroscopy, and some users
may find the effort premature. However, I believe that the subject dealt
with here is important and should be part of the working knowledge of
chemists, physicists and material scientists. An attempt to summarize the
developments to date is worth the risk of criticism.
REFERENCES
[1] G. Herzberg, Spectra and Molecular Structure. II. Infrared and Raman Spectra of
Polyatomic Molecules, Van Nostrand, Princeton, NJ, 1945.
[2] E.B. Wilson Jr, J.C. Decius and P.C. Cross, Molecular Vibrations; The Theory of
Infrared and Raman Vibrational Spectra, McGraw-Hill, New York, 1955.
[3] M.B. Bolkenshtein, L.A. Gribov, M.A. Eliashevich and B.I. Stepanov, Molecular Vibrations, Nauka, Moscow, 1972.
[4] M. Born and E. Wolf, Principles of Optics, Pergamon Press, Oxford, 1975.
[5] J.D. Macomber, The Dynamics of Spectroscopic Transitions, John Wiley & Sons,
Inc., New York, 1976.
[6] G.A. Ozin and A.C. Arsenault, Nanochemistry. A Chemical Approach to Nanomaterials, Royal Society of Chemistry, Cambridge, 2005.
[7] D.L. Feldheim and C.A. Foss (eds), Metal Nanoparticles. Synthesis, Characterization
and Applications, Marcel Dekker, New York, 2002.
[8] G. Schmid (ed.), Nanoparticles. From Theory to Applications, Wiley-VCH,
Weinheim, 2005.
[9] E.A. Coronado and G.C. Schatz, J. Chem. Phys., 119, 2003, 3926–3934.
[10] M.I. Stockman, S.V. Faleev and D.J. Bergman, Phys. Rev. Lett., 2001, 87, 167401/1–
167401/4.
www.pdfgrip.com
Acknowledgments
This book is the synergistic product of many people, to whom I extend
thanks for their tireless efforts and unique contributions. First, to my
students who have worked with me initially at the University of Toronto
and then in the Materials and Surface Science Group at the University
of Windsor, for their dedication and research that led to many of the
ideas in this book. In particular, Paul Goulet, Nicholas Pieczonka and
Daniel Ross, who were working with me during the time of writing this
book, and postdoctoral fellows Ramon Alvarez-Puebla, Mathew Halls
and Carlos Constantino, for their valuable input and comments on the
manuscript.
Second, to all my friends and colleagues who have collaborated with
me in the investigation of surface-enhanced vibrational spectroscopy,
from whom, and with whom, I have learned a great deal. I wish to
specifically acknowledge Dr A. Brolo and Dr M. Moskovits for their
insightful comments and suggestions.
Third, I am indebted to the National Science and Engineering Research
Council of Canada, without whose continuous financial support of my
research in surface enhanced spectroscopy this book would not have been
possible.
Finally, I am eternally grateful to my wife for her undivided love and
constant encouragement of this project, and whose sacrificial dedication
over four decades has continually served to inspire me.
www.pdfgrip.com
www.pdfgrip.com
Glossary
Definitions given are related to the content of this book. For extended
acronyms or definitions see references 1 and 2–4, respectively. For a
window into the on’s terminology see Walker and Slack (5), and to avoid
confusions in the world of optical constants, the excellent recollection
by Holm (6) is recommended.
Absorbance (A). The logarithm to the base 10 of the ratio of the spectral radiant power of incident, essentially monochromatic, radiation to
the radiant power of transmitted radiation: A = − log T. In practice, absorbance is the logarithm to the base 10 of the ratio of the spectral radiant
power of light transmitted through the reference sample to that of the
light transmitted through the solution, both observed in identical cells. T
is the (internal) transmittance. This definition supposes that all the incident light is either transmitted or absorbed, reflection or scattering being
negligible.
Absorption of electromagnetic radiation. The transfer of energy from an
electromagnetic field to matter. A process by which light is removed from
the incident beam. This can include exciting electrons to higher energy
states, transfer of light into heat or activation of various vibrational or
rotational modes.
Absorptance. The fraction of light absorbed, equal to one minus the
transmittance (T) plus reflectance (R).
Absorption band. This a region of the absorption spectrum in which the
absorbance includes a maximum.
Absorption coefficient (decadic a or Napierian a). Absorbance divided
by the optical pathlength: a = A/l. Physicists usually use natural logarithms. In this case, α = a ln10, where a is the Napierian absorption
www.pdfgrip.com
xx
GLOSSARY
coefficient. Since absorbance is a dimensionless quantity, the coherent SI
unit for a and α is m−1 . Also cm−1 is often used.
Absorption cross-section (σ ). Molecular entities contained in a unit volume of the absorbing medium along the light path. Operationally, it
can be calculated as the absorption coefficient divided by the number of
molecular entities contained in a unit volume of the absorbing medium
along the light path: σ = α/N.
Absorption spectrum. A two-dimensional plot of the absorbance or
transmittance of a material with respect to wavelength or some function of the wavelength.
Angle of incidence. The angle at which the light beam strikes a surface.
This angle is measured from the normal to the surface.
Anti-Stokes lines. These are Raman lines observed on the shorter wavelength side of the monochromatic radiation source. They arise from those
Raman transitions in which the final vibration level is lower than the initial vibrational level.
Amphiphiles. Molecules with one part hydrophilic (water-loving) and
the other part hydrophobic (water-hating). These are the most common
monolayer-forming materials. The hydrophobic part is necessary to avoid
the immersion of the molecule in the water subphase. The hydrophilic
part is necessary to allow the spreading of the molecule on the water
surface.
Analyte. In chemical analysis, the substance to be assessed is termed the
analyte.
Attenuated total reflectance (ATR) (internal reflection spectroscopy).
ATR is a reflectance sampling technique which is useful for analysis of
liquids, polymer films and semi-solids. In ATR, infrared radiation impinges on a prism of infrared transparent material of high refractive
index. Because of internal reflectance, the light reflects off the crystal
surface at least once before leaving it. The infrared radiation sets up an
evanescent wave which extends beyond the surface of the crystal into the
sample that is in contact with the crystal.
Blinking. At the single molecule level, repeated cycles of fluorescent
emission (‘blinking’) on a time-scale of several seconds are observed.
This behavior would be unobservable in bulk studies.
Chemisorption. Metal–molecule interaction strongly alters the molecular electronic distribution owing to the formation of a chemical bond
www.pdfgrip.com
GLOSSARY
xxi
between molecule and the metal (surface complex), and consequently
frequencies should be shifted.
Colloid. A heterogeneous system consisting of small (1–100 nm) particles
suspended in a solution.
Electric susceptibility. For most common dielectric materials, the strength
of the induced polarization P is proportional and parallel to the applied
electric field E. Provided the field does not become extremely large and
the medium is isotropic, P = ε0 χe E, where the constant χe is the electric
susceptibility of the medium.
Electric displacement, D (C m−2 ). For substances other than ferroelectric,
the presence of an applied electric field, E, induces an electric polarization
P, proportional to the magnitude of the applied field. For most common
materials and weak fields, the response is linear and isotropic: D = εE.
The proportionality constant, ε is the electric permittivity, which in the
general case is known as the dielectric tensor.
Dispersion. The variation of the index of refraction with frequency is
called dispersion. The Kramers–Kronig relations allows one to calculate
the light absorption properties of a medium when its dispersion is known.
Dye. An organic molecule with absorption bands in the visible spectral
region.
Excimer. An excited dimer, dissociative in the ground state, resulting
from the reaction of an excited molecule with a ground-state molecule
of the same type.
Exciplex. An excited complex, dissociative in the ground state, resulting
from the reaction of an excited molecule with a ground-state molecule
of a different type.
Fermi energy. This is defined at absolute zero temperature. All orbitals
of energy below the Fermi energy are occupied and all orbitals of higher
energy are unoccupied. Notably, in the field of solid-state physics the
chemical potential (temperatute dependent) is often called the Fermi level.
Fluorescence. Spontaneous emission of radiation (luminescence) from
an excited molecular entity with the formation of a molecular entity of
the same spin multiplicity.
Frank–Condon principle. Classically, the Frank–Condon principle is
the approximation that an electronic transition is most likely to occur
without changes in the position of the nuclei in the molecular entity and
its environment. The resulting state is called the Frank–Condon state,
www.pdfgrip.com
xxii
GLOSSARY
and the transition involved, a vertical transition. The quantum mechanical formulation of this principle is that the intensity of a vibronic transition is proportional to the square of the overlap integral between the
vibrational wavefunctions of the two states that are involved in the transition.
Full width at half-height or half-maximum (FWHH or FWHM). This is
the width of the transmittance (absorbance or scattering) band measured
at half the maximum transmittance (absorbance or scattering) value.
Langmuir film. Floating monomolecular film on the liquid subphase
(usually water because its high surface tension).
Langmuir–Blodgett (LB) film. Film (monolayer or multilayer) fabricated
transferring the Langmuir film from the liquid surface on to a solid
substrate by the vertical movement of this solid substrate through the
monolayer–air interface (like immersing a cookie in a mug of coffee).
There are three types of LB films, called Z-type (transfer on the upstroke
only), X-type (transfer on the down stroke only) and Y-type (transfer on
the upstroke and down stroke).
Linewidth. The linewidth of the particle-plasmon resonance is controlled
by lifetime broadening due to various decay processes. Part of this lifetime
broadening results from nonradiative decay of the particle plasmon into
electron–hole excitations in the metal; if the excitations occur within the
conduction (s–p) band, the decay process is termed intraband damping.
If the excitations are between d bands and the conduction band, it is
called interband damping.
Near-field. The near-field can be defined as the extension outside a given
material of the field existing inside this material. In most cases, the amplitude of the near-field decays very rapidly along the direction perpendicular to the interface, giving rise to the so-called evanescent wave character
of the near-field. The most relevant to SEVS are surface near-fields that
can only be produced by applying an external excitation (photon excitation).
Organic semiconductors. From the band theory point of view, there is
not much difference between organic and inorganic semiconductors. In
a solid, the density is so high that the interatomic spacing becomes very
small. The interaction of the atoms causes each of the original atomic orbital to split into N components; since N is a extremely large number, the
spacing between the energy levels becomes negligibe and the individual
levels coalesce into an energy band. The valence levels produce a valence
www.pdfgrip.com