Báo cáo hóa học: " Observation of the low frequency vibrational modes of bacteriophage M13 in water by Raman spectroscopy" pot
Bạn đang xem bản rút gọn của tài liệu. Xem và tải ngay bản đầy đủ của tài liệu tại đây (695.69 KB, 11 trang )
BioMed Central
Page 1 of 11
(page number not for citation purposes)
Virology Journal
Open Access
Research
Observation of the low frequency vibrational modes of
bacteriophage M13 in water by Raman spectroscopy
KT Tsen*
1
, Eric C Dykeman
1
, Otto F Sankey
1
, Nien-Tsung Lin
2
, Shaw-
Wei D Tsen
3
and Juliann G Kiang
4,5,6
Address:
1
Department of Physics and Astronomy, Arizona State University, Tempe, AZ 85287-1504, USA,
2
Institute of Microbiology, Immunology
and Molecular Medicine, Tzu Chi University, 701, Sec. 3, Chung-Yang Rd., Hualien 970, Taiwan, R.O.C,
3
Department of Pathology, Johns Hopkins
Medical Institutions, Baltimore, MD 21231, USA,
4
Department of Cellular Injury, Walter Reed Army Institute of Research, Silver Spring, MD
20910-7500, USA,
5
Department of Medicine, Uniformed Services University of The Health Sciences, Bethesda, MD 20814-4799, USA and
6
Department of Pharmacology, Uniformed Services University of The Health Sciences, Bethesda, MD 20814-4799, USA
Email: KT Tsen* - ; Eric C Dykeman - ; Otto F Sankey - ; Nien-
Tsung Lin - ; Shaw-Wei D Tsen - ; Juliann G Kiang -
* Corresponding author
Abstract
Background: Recently, a technique which departs radically from conventional approaches has
been proposed. This novel technique utilizes biological objects such as viruses as nano-templates
for the fabrication of nanostructure elements. For example, rod-shaped viruses such as the M13
phage and tobacco mosaic virus have been successfully used as biological templates for the
synthesis of semiconductor and metallic nanowires.
Results and discussion: Low wave number (≤ 20 cm
-1
) acoustic vibrations of the M13 phage have
been studied using Raman spectroscopy. The experimental results are compared with theoretical
calculations based on an elastic continuum model and appropriate Raman selection rules derived
from a bond polarizability model. The observed Raman mode has been shown to belong to one of
the Raman-active axial torsion modes of the M13 phage protein coat.
Conclusion: It is expected that the detection and characterization of this low frequency
vibrational mode can be used for applications in nanotechnology such as for monitoring the process
of virus functionalization and self-assembly. For example, the differences in Raman spectra can be
used to monitor the coating of virus with some other materials and nano-assembly process, such
as attaching a carbon nanotube or quantum dots.
Background
Although viruses are generally regarded as etiologic agents
of disease, they can also be made useful, and the concept
of using them as a template to build uniform semiconduc-
tor nanostructures seems to be increasingly plausible.
Among the crucial issues associated with molecular-beam
epitaxy (MBE) self-assembly for applications in nanotech-
nology is the variation in component size [1,2]. The pro-
duction of identical or nearly identical structures at
nanoscale is desirable; however, this is extremely difficult
to accomplish with conventional techniques. To date,
MBE-grown nanowires, nanorods, and quantum dots,
which are proposed to be elements in future nanoelec-
tronic circuits, have been characterized by size dispersion
Published: 22 September 2006
Virology Journal 2006, 3:79 doi:10.1186/1743-422X-3-79
Received: 23 August 2006
Accepted: 22 September 2006
This article is available from: />© 2006 Tsen et al; licensee BioMed Central Ltd.
This is an Open Access article distributed under the terms of the Creative Commons Attribution License ( />),
which permits unrestricted use, distribution, and reproduction in any medium, provided the original work is properly cited.
Virology Journal 2006, 3:79 />Page 2 of 11
(page number not for citation purposes)
despite numerous efforts towards the control of size and
shape [3,4]. Although the method of self-assembly by
employment of chemically generated templates [5,6]
decreases to some extent the size dispersion of the grown
structures, the results are still not satisfactory.
Recently, a technique which departs radically from con-
ventional approaches has been proposed [7-11]. This
novel technique utilizes biological objects such as viruses
as nano-templates for the fabrication of nanostructure ele-
ments. For example, rod-shaped viruses such as the M13
phage and tobacco mosaic virus (TMV) have been success-
fully used as biological templates for the synthesis of sem-
iconductor and metallic nanowires [7,10,11].
Furthermore, genetically modified TMV and M13 phage
have been shown to be useful for the self-assembly of
nanomaterials into liquid crystals, films and fibers [8,9].
It is therefore very likely that genetically programmed
viruses will play an important role in developing the next
generation of optoelectronic devices and nanoelectronic
circuits.
For monitoring the abovementioned self-assembly proc-
esses, an in-situ, non-destructive technique is desirable.
Raman spectroscopy has been shown to be a non-invasive
technique in material research. To the authors' knowl-
edge, previous studies of viruses using Raman spectros-
copy have focused only on the high frequency (large wave
number) regions (≥ 600 cm
-1
) where the internal virus
composition, i.e. localized vibrations of multiply bonded
or electron-rich groups in proteins, was studied [12]. In
this paper, we report the first observation of low wave
number (≤ 20 cm
-1
) acoustic vibrations of the M13 phage
using Raman spectroscopy. The observed vibrations are
compared with theoretical calculations based on an elastic
continuum model and appropriate Raman intensities and
selection rules derived from a continuum limit of the
bond polarizability model. The observed Raman mode
has been shown to belong to one of the Raman-active
axial torsion modes of the M13 phage protein coat.
Because of the sensitivity of these frequencies upon envi-
ronments, it is expected that the detection of this low fre-
quency vibrational mode can be used to monitor and help
to control the process of virus functionalization, By virus
functionalization we mean virus being used to make use-
ful things such as nanostructure and nanoelectronic
devices; for instance, when coating viruses with different
materials, attaching viruses to quantum dots and carbon
nanotubes, and forming multiple superstructures.
Samples and experimental technique
The M13 phage samples in water solution used in this
work were prepared as follows: To propagate the M13
phage, an overnight culture of the host cell, JM101, was
diluted 20-fold into 125-ml flasks containing 20 ml of LB
medium. When the culture reached 0.5 of optical density
at 550 nm (OD
550
), the phage was added at a multiplicity
of infection of 20 and further grown until stationary phase
(ca. 12 h postinfection). Crude phage suspensions were
prepared by centrifugation (10,000 × g, 15 min) of the
culture to remove the cells and passing the supernatants
through a membrane filter (0.45-µm pore size). To con-
centrate the phage titer, the filtrated supernatant was pre-
cipitated by 0.25 M NaCl and 2.5% polyethylene glycol
6000 for 4 hr on ice. The pellet collected by centrifugation
(13500 × g for 15 min at 4°C) was dissolved in 100 µl of
distilled water. To determine the phage titer, a double-
layer bioassay [13] was performed on an LB agar plate.
To prevent heating of the samples by laser irradiation dur-
ing the Raman scattering experiments, the second har-
monic output of a cw mode-locked YAlG laser was used as
an excitation source [14]. The laser, which has photon
energy of 2.34 eV, was operated at a repetition rate of 76
MHz and has a pulse width of about 70 ps. 90°-scattering
geometry was employed. The Raman scattered signal was
collected and analyzed by a standard computer-controlled
Raman system which included a double spectrometer and
a photomultiplier tube with associated photon counting
electronics. The spectrometer had a spectral resolution of
about 1.0 cm
-1
. All the data reported here were taken at T
= 300K.
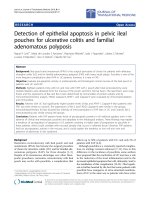
Experimental results, theoretical model
calculations and discussions
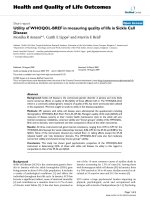
A typical Raman scattering spectrum taken for M13
phages at 10
20
pfu/ml and in the spectral range between 2
and 20 cm
-1
is shown in Fig. 1 (the solid circles). The
experiments have been repeated at least 30 times and the
data have been found to be reproducible. They were an
average of at least 30 experiments. The statistic error
(mostly from that of photon counting) associated with
the data is minimal. The distinctive feature of the spec-
trum is a broad shoulder around 8.5 cm
-1
sitting on top of
a background. To rule out both instrumental artifacts and
the possibility of contributions from the DNA within the
phages, we repeated the experiments with M13 phages
without protein coats, i.e. with only the single-stranded
M13 phage DNA at the same concentration in water. We
notice that from the dimension of M13 phage and the
weight of a single stranded DNA inside the phage, one can
determine the equivalent weight of single stranded DNA
for M13 phages with 10
20
and 10
21
pfu/ml. It is this equiv-
alent weight of single stranded DNA that was used in the
experiments. The results are shown as a solid line in Fig.
1. Comparison of the two spectra shows that there is
indeed a broad structure at 8.5 cm
-1
associated with scat-
tering of light from the M13 phage protein coats. The
remaining background is due to imperfections in the
rejection of elastic light by the spectrometer. The actual
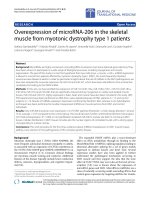
Virology Journal 2006, 3:79 />Page 3 of 11
(page number not for citation purposes)
low frequency acoustic vibrational mode signal from the
phages is obtained by the subtraction of these two spectra.
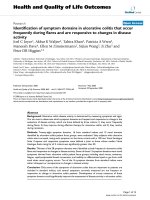
Figure 2 shows the resulting structure after the subtrac-
tion. The broad peak has been found to center around 8.5
cm
-1
and is asymmetric. It has a full-width-at-half-maxi-
mum (FWHM) of about 5.0 cm
-1
. Since the spectral reso-
lution of our Raman system is about 1.0 cm
-1
, we conclude
that the relatively broad Raman peak observed here likely
resulted from inhomogeneous broadening.
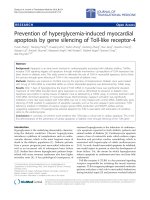
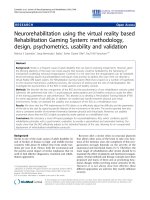
In order to further test our interpretations, we carried out
similar Raman experiments with M13 phages at the higher
concentration of 10
21
pfu/ml in water solution. The result
is shown in Fig. 3. Again, the solid squares and solid line
refer to the results for M13 phages with and without pro-
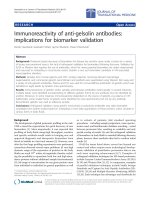
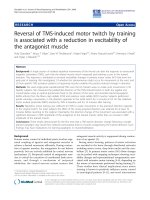
tein coats, respectively. Fig. 4 shows the resulting structure
after the subtraction. Similar to Fig. 2, the observed broad
Raman peak is centered around 8.5 cm
-1
and is asymmet-
ric; however, the signal-to-noise ratio is significantly
improved. This further confirms that what we have
observed is the low frequency acoustic vibrational mode
associated with the M13 phage protein coat.
Fig. 5 shows a comparison of the observed broad struc-
tures for the two concentrations studied, 10
20
pfu/ml and
10
21
pfu/ml. The data are properly normalized. We find
that the integrated area under the peaks scales very well
with M13 phage concentration, as expected.
To obtain better insight into the character of the observed
low frequency vibrational Raman mode of M13 phages,
we performed theoretical calculations in which an elastic
continuum model is assumed and appropriate Raman
selection rules were derived based on a continuum exten-
sion of the bond polarizability model.
Experimental Raman spectroscopy is able to observe a low
frequency mode of a cylindrical type viral particle; how-
ever, it is unable to provide a qualitative picture of the
type of atomic displacements involved in the vibration.
To understand what types of modes are being excited by
the Raman spectroscopy experiment, we turn to a theoret-
ical analysis of the problem.
There are several routes that can be followed in develop-
ing a theory capable of predicting Raman spectral lines,
including atomistic models which give full atomic detail,
Raman scattering spectrum of M13 phages in water for a concentration of 10
20
pfu/ml with (solid circles) and without (solid curve) protein coatingFigure 1
Raman scattering spectrum of M13 phages in water for a concentration of 10
20
pfu/ml with (solid circles) and without (solid
curve) protein coating. The solid curve represents background signal resulting from the imperfection of rejection of elastic
scattering of light by spectrometer.
0 2 4 6 8 10121416182022
0
2
4
6
8
10
12
14
M13 with 10
20
pfu/cc
: M13
: M13 w/o Protein Coating
Raman Intensity (a.u.)
Frequency Shift (cm
-1
)
Virology Journal 2006, 3:79 />Page 4 of 11
(page number not for citation purposes)
to a continuum model which averages over the local
geometry on the atomic scale and expands its vision to a
larger length scale. Low frequency modes being probed
here through Raman scattering have long wavelengths
and thus are not sensitive to atomic details. Rather they
are the result of the average global properties of the phage.
Our goal here is to provide qualitative insights and a semi-
quantitative understanding concerning the types of vibra-
tional modes accessible through Raman scattering of a
cylindrical phage. Thus a continuum approach, when
used cautiously, is a method of choice due to its relative
simplicity and ease of interpretation.
In building a continuum model, it is important to first
understand the structure of the M13 bacteriophage. M13
is composed of individual coat proteins bundled together
so that in cross section the bundle has approximately the
shape of a long circular cylinder (>860 nm), or tube [15].
Each individual coat protein in the bundle is comprised of
50 amino acids and has the conformation of an α-helix
roughly aligned with the tube axis. Figure 6 shows a small
segment of the filament. In cross section, there are 10 indi-
vidual proteins packed together. The coat proteins are
packed in a partially helical fashion so that they form the
shape of a cone. The narrow neck at the top of one cone
fits inside the large base of the cone above it. One end of
each cone contains acidic residues while the other end is
basic. This produces strong cone-cone interactions which
increase the stability of the assembly. The central region of
the cone is apolar and enhances the interactions between
α-helices of a single cone. The stacking of thousands of
such cones gives the phage its long worm-like structure.
Inside the core of the tube resides the ssDNA and water.
We model the long fiber as a solid cylindrical tube of elas-
tic continuous material, as shown in Figure 6c. Following
Balandin et al. [16] the viral protein coat has an inner
radius "a" and outer radius "b". The inner and outer radii
of the M13 shell are set to a = 1.9 nm and b = 3.4 nm,
respectively, which were determined from the atomistic
structure of the capsid by averaging over distances
between atoms in the structure. Elastic wave theory
[17,18] is used to arrive at an analytic expression that
describes the frequencies and displacement patterns of
each vibrational mode of the cylindrical shell. Cylindrical
coordinates (r, θ, z) are used where z is the direction along
the axis of the cylinder. In general, the vibrational modes
depend on the wave vector k
Z
varying as e
ik
z
Z
. We assume
that the viral particle is longer than the wavelength of the
light; Raman scattering is then only produced by waves
The low frequency vibrational mode of M13 with a concentration of 10
20
pfu/ml obtained after the subtraction of the back-ground signalFigure 2
The low frequency vibrational mode of M13 with a concentration of 10
20
pfu/ml obtained after the subtraction of the back-
ground signal.
0246810121416182022
-0.2
0.0
0.2
0.4
0.6
0.8
1.0
1.2
1.4
1.6
The Low-Frequency Vibrational
Mode of M13 with 10
20
pfu/cc
Raman Intensity (a.u.)
Frequency Shift (cm
-1
)
Virology Journal 2006, 3:79 />Page 5 of 11
(page number not for citation purposes)
with k
z
≈ 0. The displacement vectors of the vibrational
modes are then (r, θ) with no z dependence (e
ik
z
Z
= 1),
and with components u
r
(radial direction), u
θ
(angular
direction) and u
Z
(axial direction). The radial dependence
is a linear combination of Bessel functions of the 1
st
and
2
nd
kinds, and the angular dependence is sinusoidal being
proportional to sin(nθ) and cos(nθ) where n is an integer,
n = [0,∞]. Since the net radial force is zero on the surfaces
of the shell, the radial stress components
σ
rr
,
σ
r
θ
, and
σ
rz
must vanish at the inner and outer radii "a" and "b." This
gives six conditions relating the amplitudes that produce
a 6 × 6 determinant
17
which must vanish at the allowed
frequencies ω. There are just two parameters in the theory,
and they are the longitudinal and transverse sound
speeds, c
l
and c
t
. We use c
l
= 1817 m/s and c
t
= 915 m/s, the
measured sound speeds in lysozymes [19], which is simi-
lar to the measured speeds of sound in different protein
crystals such as ribonuclease and hemoglobin.
Elastic wave theory provides a complete description of the
possible frequencies and their displacement patterns of
vibrational modes which are then used to determine their
Raman scattering intensity. The Raman intensity is pro-
portional to the Raman tensor ∆
χ
as [20]
where , describe the polarization of the incident and
scattered light. The Raman tensor ∆ depends on how
the polarizability (due to the electromagnetic field of the
laser) of the material changes with displacements pro-
duced by the vibrational mode.
For the computation of the Raman tensor we generalize
the bond polarizability model [21] to a continuum-like
model. We assume that the material is composed of
bonds between atoms in which each bond has a derivative
of the polarizability tensor with components parallel to
u
I
dd
si
∝
()
ˆˆ
,
i
i
∆
χ
2
Eq. 1
ˆ
d
i
ˆ
d
s
χ
Raman scattering spectrum of M13 phages in water for a concentration of 10
21
pfu/ml with (solid circles) and without (solid curve) protein coatingFigure 3
Raman scattering spectrum of M13 phages in water for a concentration of 10
21
pfu/ml with (solid circles) and without (solid
curve) protein coating. The solid curve corresponds to background signal due to the imperfection of rejection of elastic scat-
tering of light by spectrometer.
0246810121416182022
-2
0
2
4
6
8
10
12
14
16
18
20
M13 with 10
21
pfu/cc
: M13
: M13 w/o Protein Coating
Raman Intensity (a.u.)
Frequency Shift (cm
-1
)
Virology Journal 2006, 3:79 />Page 6 of 11
(page number not for citation purposes)
the bond direction ( ) and perpendicular ( ) due to
changes in bond length. Each bond is assumed to occupy
a volume V
b
and all bonds are assumed to have the same
polarizability derivates. The bonds are then averaged over
all random orientations. The spirit of the model is to pro-
duce a long length-scale theory that averages over many
atoms but is derived from a tested atomistic model. The
derived change of the polarizability tensor due to the
strain field is
The parameters
α
s
and
α
c
are the polarizability changes of
the material due to shear strain and compressional strain,
respectively. The parameters
α
s
and
α
c
are related to
and , but we treat them as parameters. Our calculation
only predicts relative (not absolute) intensities, so only
the ratio
α
c
/
α
s
is important. We set this ratio to 1/2, which
models carbon-carbon bonds well. Only the n = 0 modes
depend on this ratio (see Eqs. 3a-c). Details of the model
are described in Ref. 22. Integrating Eq. 2 over the volume
of the cylindrical viral shell gives the total susceptibly ten-
sor of the viral coat. Since the polarizabilty per unit vol-
ume, Eq. 2, is dependant on either cos(n
θ
)or sin(n
θ
), the
integral over the angular dependence implies that the
total susceptibility tensor in Cartesian coordinates is non
zero for only n = 0,1 and 2 modes of the cylindrical shell.
The results are,
α
’
α
⊥
’
∆
α
αα
=
−⋅
()
+
()
s
b
c
b
V
UITr
U
V
Tr
U
I
1
3
Eq. 2
α
’
α
⊥
’
I
c
s
∝
+
()
+
=
()
0
2
2
1
3
2
0
2
λµ
α
α
Γ ,; for n
Eq. 3A
I ∝⋅ =
()
µ
Γ
1
2
1,; for n
Eq 3B
The low frequency vibrational mode of M13 with a concentration of 10
21
pfu/ml obtained after the subtraction of the back-ground signalFigure 4
The low frequency vibrational mode of M13 with a concentration of 10
21
pfu/ml obtained after the subtraction of the back-
ground signal.
0 2 4 6 8 10 12 14 16 18 20 22
-2
0
2
4
6
8
10
12
14
16
18
The Low-Frequency Vibrational
Mode of M13 with 10
21
pfu/cc
Raman Intensity (a.u.)
Frequency Shift (cm
-1
)
Virology Journal 2006, 3:79 />Page 7 of 11
(page number not for citation purposes)
Here
λ
and
µ
are functions of the scattering angle
θ
,
λ
= Q4
- 6 sin
2
(
θ
)N
µ
= Q14 - sin
2
(
θ
)N, and Γ
n
are numerically eval-
uated integrals over the displacement pattern of the
modes. The experiments were performed at a scattering
angle of 90°. The Γ integrals are over the displacement
pattern of the vibration. For example, the n = 0 integral is,
where J
n
and Y
n
are Bessel functions.
Applying this theoretical foundation to the M13 bacteri-
ophage, we find several peaks in the range of frequency
range of 0–25 cm
-1
. Figure 7 shows the modes and their
Raman intensities (Gaussians broadened by 1 cm
-1
). Fig-
ure 7a shows the radial models, Figure 7b shows the axial
models, and all modes are shown together in Figure 7c. It
is important to separate the modes by their character
because damping of the two types of modes is expected to
be quite different. The radial modes will be highly
damped since the atomic displacements of the virus move
in or out radially either pushing against the water on the
exterior or against the water/DNA solution in the interior
cavity of the virus. Axial modes produce displacements of
the atoms that are parallel to the axis of the virus and
hence should not interact strongly with water. The motion
relative to water of the axial modes will be shear motion
(rather than compressional as for radial modes) and
damping will be marginal. The modes marked with a star
(*) in Fig. 7c are axial. We hypothesize that only the axial
modes (those with a star) are observable in the Raman
experiment because the other (radial) modes are strongly
damped.
There are two main Raman intensities predicted in Figure
7c – one at 10.5 cm
-1
that is axial, and one at 20.4 cm
-1
that
is radial. The mode patterns of these two modes are
shown in Figure 8a and 8b. The first main peak at 10.5 cm
-
1
is the largest and corresponds to an n = 1 axial mode of
vibration for the cylindrical shell. In this mode each α-
helix that comprises the protein coat undergoes axial
shearing. Circling about the virus by an angle θ produces
a modulation of the displacement by cos(θ) (or sin(θ), as
it is doubly degenerate). The mode pattern for one plane
of atoms in a plane of the virus is similar to that of a drum-
I ∝
+
()
=
()
2
2
2
4
2
λµ
Γ
,. for n
Eq. 3C
Γ
0
=
()
+
()
∫
ω
ω
2
2
c
rdr AJ
rcl
BY
rcl
l
a
b
nn
[
//
]
ω
Raman spectra of low frequency vibrational mode of M13 phages for two concentrations, as indicatedFigure 5
Raman spectra of low frequency vibrational mode of M13 phages for two concentrations, as indicated. The Raman intensity has
been found to scale with theconcentration of the phages, as expected.
0 2 4 6 8 10121416182022
-2
0
2
4
6
8
10
12
14
16
Low-Frequency Vibrational
Mode of M13 Phages
: 10
20
pfu/cc
: 10
21
pfu/cc
Raman Intensity (a.u.)
Frequency Shift (cm
-1
)
Virology Journal 2006, 3:79 />Page 8 of 11
(page number not for citation purposes)
head. The second major peak at 20.4 cm
-1
corresponds to
radial compression/expansion of the virus. The mode has
n = 0, so that there is no dependence on the angle θ.
Our hypothesis for the observed Raman scattering profile
is shown in Figure 9. In this figure we have only included
the axial modes since they should resonate with little
damping. We have included a Gaussian broadening of 5
cm
-1
, consistent with inhomogeneous broadening
observed in the experiment. The low frequency vibra-
tional mode observed in our Raman measurements (~8.5
cm
-1
) agrees remarkably well with the theoretical predic-
tion of a single peak (~10.5 cm
-1
) produced by an axial
modes.
There are many other modes of higher frequency that are
predicted by the continuum model. We do not investigate
frequencies higher than 25 cm
-1
here because either (i)
these modes correspond to n>2 and hence are not active
in Raman spectroscopy, or (ii) the modes have internal
wavelengths of a few Ångstroms which means that they
will not be predicted reliably in a continuum model. An
example of such a mode is shown in Figure 8c. This mode
is just over 30 cm
-1
and has an internal wavelength of
about 10Å. A continuum model averages over many
atoms (distances of several bondlengths) and this mode is
not expected to be computed accurately. Future work will
develop the model further to include atomistic details and
coupling of the modes with the solvent. Such extensions
will further test the limits of the continuum theory, and
probe deeper into our hypothesis concerning the relative
importance of damping of the various modes.
In summary, the theory has identified the low frequency
modes of vibration of the M13 phage in solution and
qualitatively and semi-quantitatively reproduced the
observed Raman spectrum. This indicates that Raman
spectroscopy is a useful, non-destructive technique for
probing the low frequency modes of the virus. These
modes are global, being affected by the overall conforma-
Diagrams of the structure of M13 phageFigure 6
Diagrams of the structure of M13 phage. (a) A molecular model containing 10 α-helix coat proteins forming a cone of the
structure. (b) A cross section of the phage composed of α-helix coat proteins. (c) The elastic continuum model of M13; a cir-
cular cylinder of outer radius "b" and inner radius "a."
Virology Journal 2006, 3:79 />Page 9 of 11
(page number not for citation purposes)
Cross sectional displacement patterns for three low fre-quency modes with significant Raman intensityFigure 8
Cross sectional displacement patterns for three low fre-
quency modes with significant Raman intensity. (a) An axial
mode at 10.5 cm
-1
. This mode we identify as the 8.5 cm
-1
mode observed in experiment. (b) A radial mode at 20.4 cm
-
1
, expected to be damped by solution. (c) An axial mode at
30.6 cm
-1
.
Theoretical Raman Intensity of (a) radial modes; (b) axial modes; (c) all modesFigure 7
Theoretical Raman Intensity of (a) radial modes; (b) axial
modes; (c) all modes. Radial modes are expected to be highly
damped by the solution. In (c), the undamped axial modes
are indicated by a star (*).
Virology Journal 2006, 3:79 />Page 10 of 11
(page number not for citation purposes)
tional properties of the virus, and will be useful in provid-
ing information on how viruses are functionalized for
applications in nanotechnology.
We note that Balandin's article [16] calculated the lowest
vibrational modes of M13 and TMV viruses in water and
air. The authors also pointed out the possible observation
of these modes by micro-Raman spectroscopy. They nei-
ther (1) performed the micro-Raman experiments; nor (2)
calculated/predicted the Raman intensity in a quantitative
way. On the other hand, our present work is the first
experimental results reported in the literature so far for the
low vibrational modes of M13 phages. In addition, we
have used bond-polarizability model to calculate/predict
the relative strength of various Raman active modes in
M13 phages. By using this theoretical model, we were able
to not only explain the frequency of the mode observed in
our Raman experiments but also identify it to be the axial
torsion mode of the protein coat of M13 phages. There-
fore, our current contributions significantly advance the
work of Balandin's.
Conclusion
Low frequency vibrational modes of the M13 phage have
been studied by Raman spectroscopy. The observed vibra-
tional mode at 8.5 cm
-1
agrees well with theoretical model
calculations that are based on an elastic continuum model
and a bond polarizability model with Raman selection
rules. With the help of theoretical data, we have deter-
mined that the observed Raman mode corresponds to an
axial (drum-head-like) vibrational mode of the M13
phage protein coat which suffers minimal damping in the
exterior solvent. The differences in Raman spectra can be
used to monitor the coating of virus with some other
materials and nano-assembly process, such as attaching a
carbon nanotube or quantum dots. Our results suggest
that Raman spectroscopy is a feasible, non-destructive
technique for probing the process of virus functionaliza-
tion. Bacteriophage M13 is one of the simplest paradigms
for viral capsids, and the characterization of its low fre-
quency vibrational modes is a significant step towards the
use of these modes for functionalization studies.
Acknowledgements
This work is supported in part by the National Science Foundation under
Grant No. DMR-0305147 and by DOD RAD II STO C. The opinions or
assertions contained herein are the private views of the authors and are not
to be construed as official or reflecting the views of the US Department of
the Army, the Uniformed Services University of the Health Sciences, or the
US Department of Defense.
Final theoretical Raman intensity prediction after considering the damping effects of the solvent and the validity of the elastic continuum modelFigure 9
Final theoretical Raman intensity prediction after considering the damping effects of the solvent and the validity of the elastic
continuum model.
Publish with BioMed Central and every
scientist can read your work free of charge
"BioMed Central will be the most significant development for
disseminating the results of biomedical research in our lifetime."
Sir Paul Nurse, Cancer Research UK
Your research papers will be:
available free of charge to the entire biomedical community
peer reviewed and published immediately upon acceptance
cited in PubMed and archived on PubMed Central
yours — you keep the copyright
Submit your manuscript here:
/>BioMedcentral
Virology Journal 2006, 3:79 />Page 11 of 11
(page number not for citation purposes)
References
1. Liu JL, Wu WG, Balandin A, Jin G, Wang KL: Intersubband
Absorption in boron-doped multiple Ge quantum dot. Appl
Phys Lett 1999, 74:185-187.
2. Liu JL, Wu WG, Balandin A, Lin G, Luo YH, Thomas SG, Lu Y, Wang
KL: Observation of inter-sub-level transitions in modulation-
doped Ge quantum dots. Appl Phys Lett 1999, 75:1745-1747.
3. Kamins TI, Williams RS: Lithographic positioning of self-assem-
bled Ge islands on Si (001). Appl Phys Lett 1997, 71:1201-1203.
4. Balandin A, Jin G, Wang KL: Issues of practical realization of a
quantum dot register for quantum computing. J Electronics
Materials 2000, 29:549-553.
5. Bandyopadhyay S, Miller AE, Chang HC, Banerjee G, Yue DE, Ricker
RE, Jones S, Eastman JA, Chandrasekhar M: Electrochemically
assembled quasi-periodic quantum dot arrays. Nanotechnology
1996, 7:360-371.
6. Balandin A, Wang KL, Kouklin N, Bandyopadhyay S: Raman spec-
troscopy of electrochemically self-assembled CdS quantum
dots. Appl Phys Lett 2000, 76:137-139.
7. Shenton W, Douglas , Young TM, Stubbs G, Mann S: Inorganic-
organic nanotube composites from template mineralzation
of tobacco mosaic virus. Adv Mater 1999, 11:253-256.
8. Flynn CE, Lee SW, Peelle BR, Belcher AM: Viruses asvehicles for
growth, organization and assembly of materials. Acta Materi-
alia 2003, 51:5867-5880.
9. Mao C, Solis DJ, Reiss BD, Kottmann SD, Sweeney RY, Hayhurst A,
Georgiou G, Iverson B, Belcher AM: Virus-based toolkit for the
directed synthesis of magnetic and semiconductoring
nanowires. Science 2004, 303:213-217.
10. Knez M, Bittner AM, Boes F, Wege C, Jeske H, Maiss E, Kern K: Bio-
template of 3-nm nickel and cobalt nanowires. Nano letters
2003, 3:1079-1082.
11. Knez M, Sumser M, Bittner AM, Wege C, Jeske H, Martin TP, Kern K:
Spatially selective nucleation of metal clusters on the
tobacco mosaic viruses. Adv Funct Mater 2004, 14:116-124.
12. Tuma R, Thomas GJ: Raman Spectroscopy of Viruses, in Handbook of
Vibrational Spectroscopoy Edited by: Chalmers JM, Griffiths PR. John
Wileys & Sons, Chichester; 2002.
13. Eisenstark A: Bacteriophage techniques. In Methods in virology Vol-
ume 1. Edited by: Maramorosch K, Koprowski H. Academic Press,
New York, N.Y; 1967:449-524.
14. Tsen KT, Wald KR, Ruf Tobias, Yu PY, Morkoc H: Electron-optical
phonon interactions in ultrathin GaAs-AlAs multiple quan-
tum well structures. Phys Rev Lett 1991, 67:2557-2560.
15. Marvin DA, Welsh LC, Symmons MF, Scott WRP, Strauss SK: Molec-
ular structure and fd (f1, M13) filamentous bacteriophage
refined with respect to X-ray fibre diffraction and solid-state
NMR data supports specific models of phage assembly at the
bacterial membrane. J Mol Biol 2006, 355:294-309.
16. Balandin A, Fonoberov VA: Vibrational modes ofNano-Tem-
plate Viruses. Journal of Biomedical Nanotechnology 2005, 1:90-95.
17. Graff KF: Wave motion in elastic solids Ohio State University Press,
New York; 1991.
18. Landau LD, Lifshitz EM: Theory of Elasticity third edition. Pergamon
Press, London; 1986.
19. Tachibana M, Kojima K, Ikuyama R, Kobayashi Y, Ataka M: Sound
velocity and dynamic elastic constants of lysozyme single
crystals. Chem Phys Lett 2000, 332:259-264.
20. Yu PY, Cardona M: Fundamentals of Semiconductors – Physics and Mate-
rials Properties 2nd edition. Springer-Verlag, Berlin; 1999:362-371.
21. Go S, Bilz H, Cardona M: Bond Charge, BondPolarizability, and
Phonon Spectra in Semiconductors. Phys Rev Lett 1975,
34:580-583.
22. Dykeman EC, Tsen KT, Sankey OF: . to be published