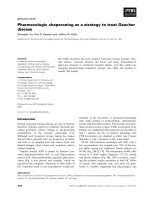
Tài liệu Báo cáo khoa học: "Different Structures for Evaluating Answers to Complex Questions: Pyramids Won’t Topple, and Neither Will Human Assessors" docx
Bạn đang xem bản rút gọn của tài liệu. Xem và tải ngay bản đầy đủ của tài liệu tại đây (364.02 KB, 8 trang )
Proceedings of the 45th Annual Meeting of the Association of Computational Linguistics, pages 768–775,
Prague, Czech Republic, June 2007.
c
2007 Association for Computational Linguistics
Different Structures for Evaluating Answers to Complex Questions:
Pyramids Won’t Topple, and Neither Will Human Assessors
Hoa Trang Dang
Information Access Division
National Institute of Standards and Technology
Gaithersburg, MD 20899
Jimmy Lin
College of Information Studies
University of Maryland
College Park, MD 20742
Abstract
The idea of “nugget pyramids” has re-
cently been introduced as a refinement to the
nugget-based methodology used to evaluate
answers to complex questions in the TREC
QA tracks. This paper examines data from
the 2006 evaluation, the first large-scale de-
ployment of the nugget pyramids scheme.
We show that this method of combining
judgments of nugget importance from multi-
ple assessors increases the stability and dis-
criminative power of the evaluation while in-
troducing only a small additional burden in
terms of manual assessment. We also con-
sider an alternative method for combining
assessor opinions, which yields a distinction
similar to micro- and macro-averaging in the
context of classification tasks. While the
two approaches differ in terms of underly-
ing assumptions, their results are neverthe-
less highly correlated.
1 Introduction
The emergence of question answering (QA) systems
for addressing complex information needs has ne-
cessitated the development and refinement of new
methodologies for evaluating and comparing sys-
tems. In the Text REtrieval Conference (TREC) QA
tracks organized by the U.S. National Institute of
Standards and Technology (NIST), improvements in
evaluation processes have kept pace with the evolu-
tion of QA tasks. For the past several years, NIST
has implemented an evaluation methodology based
on the notion of “information nuggets” to assess an-
swers to complex questions. As it has become the
de facto standard for evaluating such systems, the
research community stands to benefit from a better
understanding of the characteristics of this evalua-
tion methodology.
This paper explores recent refinements to the
nugget-based evaluation methodology developed by
NIST. In particular, we examine the recent so-called
“pyramid extension” that incorporates relevance
judgments from multiple assessors to improve eval-
uation stability (Lin and Demner-Fushman, 2006).
We organize our discussion as follows: The next
section begins by providing a brief overview of
nugget-based evaluations and the pyramid exten-
sion. Section 3 presents results from the first large-
scale implementation of nugget pyramids for QA
evaluation in TREC 2006. Analysis shows that this
extension improves both stability and discriminative
power. In Section 4, we discuss an alternative for
combining multiple judgments that parallels the dis-
tinction between micro- and macro-averaging often
seen in classification tasks. Experiments reveal that
the methods yield almost exactly the same results,
despite operating on different granularities (individ-
ual nuggets vs. individual users).
2 Evaluating Complex Questions
Complex questions are distinguished from factoid
questions such as “Who shot Abraham Lincoln?” in
that they cannot be answered by named entities (e.g.,
persons, organizations, dates, etc.). Typically, these
information needs are embedded in the context of a
scenario (i.e., user task) and often require systems to
768
synthesize information from multiple documents or
to generate answers that cannot be easily extracted
(e.g., by leveraging inference capabilities).
To date, NIST has already conducted several
large-scale evaluations of complex questions: def-
inition questions in TREC 2003, “Other” ques-
tions in TREC 2004–2006, “relationship” questions
in TREC 2005, and the complex, interactive QA
(ciQA) task in TREC 2006. Definition and Other
questions are similar in that they both request novel
facts about “targets”, which can be persons, orga-
nizations, things, and events. Relationship ques-
tions evolved into the ciQA task and focus on in-
formation needs such as “What financial relation-
ships exist between South American drug cartels and
banks in Liechtenstein?” Such complex questions
focus on ties (financial, military, familial, etc.) that
connect two or more entities. All of these evalua-
tions have employed the nugget-based methodology,
which demonstrates its versatility and applicability
to a wide range of information needs.
2.1 Basic Setup
In the TREC QA evaluations, an answer to a
complex question consists of an unordered set of
[document-id, answer string] pairs, where the strings
are presumed to provide some relevant information
that addresses the question. Although no explicit
limit is placed on the length of the answer, the final
metric penalizes verbosity (see below).
Evaluation of system output proceeds in two
steps. First, answer strings from all submissions
are gathered together and presented to a single as-
sessor. The source of each answer string is blinded
so that the assessor can not obviously tell which
systems generated what output. Using these an-
swers and searches performed during question de-
velopment, the assessor creates a list of relevant
nuggets. A nugget is a piece of information (i.e.,
“fact”) that addresses one aspect of the user’s ques-
tion. Nuggets should be atomic, in the sense that
an assessor should be able to make a binary de-
cision as to whether the nugget appears in an an-
swer string. Although a nugget represents a con-
ceptual entity, the assessor provides a natural lan-
guage description—primarily as a memory aid for
the subsequent evaluation steps. These descriptions
range from sentence-length document extracts to
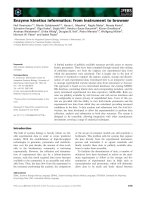
r = # of vital nuggets returned
a = # of okay nuggets returned
R = # of vital nuggets in the answer key
l = # of non-whitespace characters in entire run
recall: R = r/R
allowance: α = 100 × (r + a)
precision: P =
1 if l < α
1 −
l−α
l
otherwise
F (β) =
(β
2
+ 1) × P × R
β
2
× P + R
Figure 1: Official definition of F-score for nugget
evaluation in TREC.
key phrases to telegraphic short-hand notes—their
readability greatly varies from assessor to assessor.
The assessor also manually classifies each nugget
as either vital or okay (non-vital). Vital nuggets rep-
resent concepts that must be present in a “good” an-
swer. Okay nuggets may contain interesting infor-
mation, but are not essential.
In the second step, the same assessor who cre-
ated the nuggets reads each system’s output in turn
and marks the appearance of the nuggets. An an-
swer string contains a nugget if there is a conceptual
match; that is, the match is independent of the partic-
ular wording used in the system’s output. A nugget
match is marked at most once per run—i.e., a sys-
tem is not rewarded for retrieving a nugget multiple
times. If the system’s output contains more than one
match for a nugget, the best match is selected and
the rest are left unmarked. A single [document-id,
answer string] pair in a system response can match
0, 1, or multiple nuggets.
The final F-score for an answer is calculated in the
manner described in Figure 1, and the final score of
a run is the average across the F-scores of all ques-
tions. The metric is a weighted harmonic mean be-
tween nugget precision and nugget recall, where re-
call is heavily favored (controlled by the β parame-
ter, usually set to three). Nugget recall is calculated
solely on vital nuggets, while nugget precision is ap-
proximated by a length allowance based on the num-
ber of both vital and okay nuggets returned. In an
769
earlier pilot study, researchers discovered that it was
not possible for assessors to consistently enumer-
ate the total set of nuggets contained in an answer,
which corresponds to the denominator in a precision
calculation (Voorhees, 2003). Thus, a penalty for
verbosity serves as a surrogate for precision.
2.2 The Pyramid Extension
The vital/okay distinction has been identified as
a weakness in the TREC nugget-based evalua-
tion methodology (Hildebrandt et al., 2004; Lin
and Demner-Fushman, 2005; Lin and Demner-
Fushman, 2006). There do not appear to be any re-
liable indicators for predicting nugget importance,
which makes it challenging to develop algorithms
sensitive to this consideration. Since only vital
nuggets affect nugget recall, it is difficult for sys-
tems to achieve non-zero scores on topics with few
vital nuggets in the answer key. Thus, scores are
easily affected by assessor errors and other random
variations in evaluation conditions.
One direct consequence is that in previous TREC
evaluations, the median score for many questions
turned out to be zero. A binary distinction on nugget
importance is insufficient to discriminate between
the quality of runs that return no vital nuggets but
different numbers of okay nuggets. Also, a score
distribution heavily skewed towards zero makes
meta-analyses of evaluation stability difficult to per-
form (Voorhees, 2005).
The pyramid extension (Lin and Demner-
Fushman, 2006) was proposed to address the issues
mentioned above. The idea was relatively simple: by
soliciting vital/okay judgments from multiple asses-
sors (after the list of nuggets has been produced by
a primary assessor), it is possible to define nugget
importance with greater granularity. Each nugget is
assigned a weight between zero and one that is pro-
portional to the number of assessors who judged it
to be vital. Nugget recall from Figure 1 can be rede-
fined to incorporate these weights:
R =
m∈A
w
m
n∈V
w
n
Where A is the set of reference nuggets that are
matched in a system’s output and V is the set of all
reference nuggets; w
m
and w
n
are the weights of
nuggets m and n, respectively.
1
The calculation of
nugget precision remains the same.
3 Nugget Pyramids in TREC 2006
Lin and Demner-Fushman (2006) present exper-
imental evidence in support of nugget pyramids
by applying the proposal to results from previous
TREC QA evaluations. Their simulation studies ap-
pear to support the assertion that pyramids address
many of the issues raised in Section 2.2. Based on
the results, NIST proceeded with a trial deployment
of nugget pyramids in the TREC 2006 QA track. Al-
though scores based on the binary vital/okay distinc-
tion were retained as the “official” metric, pyramid
scores were simultaneously computed. This pro-
vided an opportunity to compare the two method-
ologies on a large scale.
3.1 The Data
The basic unit of evaluation for the main QA task
at TREC 2006 was the “question series”. Each se-
ries focused on a “target”, which could be a person,
organization, thing, or event. Individual questions
in a series inquired about different facets of the tar-
get, and were explicitly classified as factoid, list, or
Other. One complete series is shown in Figure 2.
The Other questions can be best paraphrased as “Tell
me interesting things about X that I haven’t already
explicitly asked about.” It was the system’s task to
retrieve interesting nuggets about the target (in the
opinion of the assessor), but credit was not given
for retrieving facts already explicitly asked for in the
factoid and list questions. The Other questions were
evaluated using the nugget-based methodology, and
are the subject of this analysis.
The QA test set in TREC 2006 contained 75 se-
ries. Of the 75 targets, 19 were persons, 19 were
organizations, 19 were events, and 18 were things.
The series contained a total of 75 Other questions
(one per target). Each series contained 6–9 ques-
tions (counting the Other question), with most se-
ries containing 8 questions. The task employed the
AQUAINT collection of newswire text (LDC cat-
alog number LDC2002T31), consisting of English
data drawn from three sources: the New York Times,
1
Note that this new scoring model captures the existing
binary vital/okay distinction in a straightforward way: vital
nuggets get a score of one, and okay nuggets zero.
770
147 Britain’s Prince Edward marries
147.1 FACTOID When did Prince Edward engage to marry?
147.2 FACTOID Who did the Prince marry?
147.3 FACTOID Where did they honeymoon?
147.4 FACTOID Where was Edward in line for the throne at the time of the wedding?
147.5 FACTOID What was the Prince’s occupation?
147.6 FACTOID How many people viewed the wedding on television?
147.7 LIST What individuals were at the wedding?
147.8 OTHER
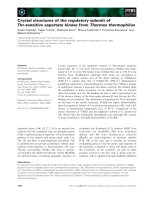
Figure 2: Sample question series from TREC 2006.
Nugget 0 1 2 3 4 5 6 7 8
The couple had a long courtship 1 0 0 0 0 0 1 1 0
Queen Elizabeth II was delighted with the match 0 1 0 1 0 0 0 0 1
Queen named couple Earl and Contessa of Wessex 0 1 0 0 1 1 1 0 0
All marriages of Edward’s siblings ended in divorce 0 0 0 0 0 1 0 0 1
Edward arranged for William to appear more cheerful in photo 0 0 0 0 0 0 0 0 0
they were married in St. Georges Chapel, Windsor 1 1 1 0 1 0 1 1 0
Figure 3: Multiple assessors’ judgments of nugget importance for Series 147 (vital=1, okay=0). Assessor 2
was the same as the primary assessor (assessor 0), but judgments were elicited at different times.
the Associated Press, and the Xinhua News Service.
There are approximately one million articles in the
collection, totaling roughly three gigabytes. In to-
tal, 59 runs from 27 participants were submitted to
NIST. For more details, see (Dang et al., 2006).
For the Other questions, nine sets of judgments
were elicited from eight judges (the primary assessor
who originally created the nuggets later annotated
the nuggets once again). Each assessor was asked to
assign the vital/okay label in a rapid fashion, without
giving each decision much thought. Figure 3 gives
an example of the multiple judgments for nuggets in
Series 147. There is variation in notions of impor-
tance not only between different assessors, but also
for a single assessor over time.
3.2 Results
After the human annotation process, nugget pyra-
mids were built in the manner described by Lin and
Demner-Fushman (2006). Two scores were com-
puted for each run submitted to the TREC 2006 main
QA task: one based on the vital/okay judgments of
the primary assessor (which we call the binary F-
score) and one based on the nugget pyramids (the
pyramid F-score). The characteristics of the pyra-
mid method can be inferred by comparing these two
sets of scores.
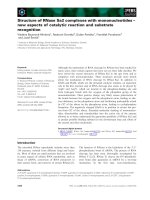
Figure 4 plots the average binary and average
pyramid F-scores for each run (which represents av-
erage performance across all series). Even though
the nugget pyramid does not represent any single
real user (a point we return to later), pyramid F-
scores do correlate highly with the binary F-scores.
The Pearson’s correlation is 0.987, with a 95% con-
fidence interval of [0.980, 1.00].
While the average F-score for a run is stable given
a sufficient number of questions, the F-score for
a single Other question exhibits greater variability
across assessors. This is shown in Figure 5, which
plots binary and pyramid F-scores for individual
questions from all runs. In this case, the Pearson
correlation is 0.870, with a 95% confidence interval
of [0.863, 1.00].
For 16.4% of all Other questions, the nugget pyra-
mid assigned a non-zero F-score where the origi-
nal binary F-score was zero. This can be seen in
the band of points on the left edge of the plot in
Figure 5. This highlights the strength of nugget
771
0.00 0.05 0.10 0.15 0.20 0.25
0.00 0.05 0.10 0.15 0.20 0.25
Average binary F−score
Average pyramid F−score
Figure 4: Scatter plot comparing the binary and
pyramid F-scores for each run.
pyramids—their ability to smooth out assessor dif-
ferences and more finely discriminate among sys-
tem outputs. This is a key capability that is useful
for system developers, particularly since algorithmic
improvements are often incremental and small.
Because it is more stable than the single-assessor
method of evaluation, the pyramid method also ap-
pears to have greater discriminative power. We fit
a two-way analysis of variance model with the se-
ries and run as factors, and the binary F-score as
the dependent variable. We found significant differ-
ences between series and between runs (p essentially
equal to 0 for both factors). To determine which runs
were significantly different from each other, we per-
formed a multiple comparison using Tukey’s hon-
estly significant difference criterion and controlling
for the experiment-wise Type I error so that the prob-
ability of declaring a difference between two runs to
be significant, when it is actually not, is at most 5%.
With 59 runs, there are C
59
2
= 1711 different pairs
that can be compared. The single-assessor method
was able to declare one run to be significantly better
than the other in 557 of these pairs. Using the pyra-
mid F-scores, it was possible to find significant dif-
ferences in performance between runs in 617 pairs.
3.3 Discussion
Any evaluation represents a compromise between
effort (which correlates with cost) and insightful-
ness of results. The level of detail and meaning-
0.0 0.2 0.4 0.6 0.8
0.0 0.2 0.4 0.6 0.8
Binary F−score
Pyramid F−score
Figure 5: Scatter plot comparing the binary and
pyramid F-scores for each Other question.
fulness of evaluations are constantly in tension with
the availability of resources. Modifications to exist-
ing processes usually come at a cost that needs to be
weighed against potential gains. Based on these con-
siderations, the balance sheet for nugget pyramids
shows a favorable orientation. In the TREC 2006
QA evaluation, soliciting vital/okay judgments from
multiple assessors was not very time-consuming (a
couple of hours per assessor). Analysis confirms
that pyramid scores confer many benefits at an ac-
ceptable cost, thus arguing for its adoption in future
evaluations.
Cost considerations precluded exploring other re-
finements to the nugget-based evaluation methodol-
ogy. One possible alternative would involve ask-
ing multiple assessors to create different sets of
nuggets from scratch. Not only would this be time-
consuming, one would then need to deal with the
additional complexities of aligning each assessor’s
nuggets list. This includes resolving issues such as
nugget granularity, overlap in information content,
implicature and other relations between nuggets, etc.
4 Exploration of Alternative Structures
Despite the demonstrated effectiveness of nugget
pyramids, there are a few potential drawbacks that
are worth discussing. One downside is that the
nugget pyramid does not represent a single assessor.
The nugget weights reflect the aggregation of opin-
ions across a sample population, but there is no guar-
772
antee that the method for computing those weights
actually captures any aspect of real user behavior.
It can be argued that the binary F-score is more re-
alistic since it reflects the opinion of a real user (the
primary assessor), whereas the pyramid F-score tries
to model the opinion of a mythical average user.
Although this point may seem somewhat counter-
intuitive, it represents a well-established tradition
in the information retrieval literature (Voorhees,
2002). In document retrieval, for example, relevance
judgments are provided by a single assessor—even
though it is well known that there are large indi-
vidual differences in notions of relevance. IR re-
searchers believe that human idiosyncrasies are an
inescapable fact present in any system designed for
human users, and hence any attempt to remove those
elements in the evaluation setup is actually undesir-
able. It is the responsibility of researchers to develop
systems that are robust and flexible. This premise,
however, does not mean that IR evaluation results
are unstable or unreliable. Analyses have shown
that despite large variations in human opinions, sys-
tem rankings are remarkably stable (Voorhees, 2000;
Sormunen, 2002)—that is, one can usually be confi-
dent about system comparisons.
The philosophy in IR sharply contrasts with work
in NLP annotation tasks such as parsing, word sense
disambiguation, and semantic role labeling—where
researchers strive for high levels of interannota-
tor agreement, often through elaborate guidelines.
The difference in philosophies arises because unlike
these NLP annotation tasks, where the products are
used primarily by other NLP system components, IR
(and likewise QA) is an end-user task. These sys-
tems are intended for real world use. Since people
differ, systems must be able to accommodate these
differences. Hence, there is a strong preference in
QA for evaluations that maintain a model of the in-
dividual user.
4.1 Micro- vs. Macro-Averaging
The current nugget pyramid method leverages mul-
tiple judgments to define a weight for each individ-
ual nugget, and then incorporates this weight into
the F-score computation. As an alternative, we pro-
pose another method for combining the opinions of
multiple assessors: evaluate system responses indi-
vidually against N sets of binary judgments, and
then compute the mean across those scores. We de-
fine the macro-averaged binary F-score over a set
A = {a
1
, , a
N
} of N assessors as:
F =
a∈A
F
a
N
Where F
a
is the binary F-score according to the
vital/okay judgments of assessor a. The differ-
ences between the pyramid F-score and the macro-
averaged binary F-score correspond to the distinc-
tion between micro- and macro-averaging discussed
in the context of text classification (Lewis, 1991).
In those applications, both measures are mean-
ingful depending on focus: individual instances or
entire classes. In tasks where it is important
to correctly classify individual instances, micro-
averaging is more appropriate. In tasks where it
is important to correctly identify a class, macro-
averaging better quantifies performance. In classi-
fication tasks, imbalance in the prevalence of each
class can lead to large differences in macro- and
micro-averaged scores. Analogizing to our work,
the original formulation of nugget pyramids corre-
sponds to micro-averaging (since we focus on indi-
vidual nuggets), while the alternative corresponds to
macro-averaging (since we focus on the assessor).
We additionally note that the two methods en-
code different assumptions. Macro-averaging as-
sumes that there is nothing intrinsically interesting
about a nugget—it is simply a matter of a particular
user with particular needs finding a particular nugget
to be of interest. Micro-averaging, on the other hand,
assumes that some nuggets are inherently interest-
ing, independent of the particular interests of users.
2
Each approach has characteristics that make it
desirable. From the perspective of evaluators, the
macro-averaged binary F-score is preferable be-
cause it models real users; each set of binary judg-
ments represents the information need of a real user,
each binary F-score represents how well an answer
will satisfy a real user, and the macro-averaged bi-
nary F-score represents how well an answer will sat-
isfy, on average, a sample population of real users.
From the perspective of QA system developers, the
micro-averaged nugget pyramid F-score is prefer-
able because it allows finer discrimination in in-
2
We are grateful to an anonymous reviewer for this insight.
773
dividual nugget performance, which enables better
techniques for system training and optimization.
The macro-averaged binary F-score has the same
desirable properties as the micro-averaged pyramid
F-score in that fewer responses will have zero F-
scores as compared to the single-assessor binary F-
score. We demonstrate this as follows. Let X be a
response that receives a non-zero pyramid F-score.
Let A = {a
1
, a
2
, a
3
, , a
N
} be the set of N asses-
sors. Then it can be proven that X also receives a
non-zero macro-averaged binary F-score:
1. There exists some nugget v with weight greater
than 0, such that an answer string r in X
matches v. (def. of pyramid recall)
2. There exists some assessor a
p
∈ A who marked
v as vital. (def. of pyramid nugget weight)
3. To show that X will also receive a non-zero
macro-averaged binary score, it is sufficient to
show that there is some assessor a
m
∈ A such
that X receives a non-zero F-score when evalu-
ated using just the vital/okay judgments of a
m
.
(def. of macro-averaged binary F-score)
4. But, such an assessor does exist, namely asses-
sor a
p
: Consider the binary F-score assigned
to X according to just assessor a
p
. The re-
call of X is greater than zero, since X contains
the response r that matches the nugget v that
was marked as vital by a
p
(from (2), (1), and
the def. of recall). The precision must also be
greater than zero (def. of precision). Therefore,
the macro-averaged binary F-score of X is non-
zero. (def. of F-score)
4.2 Analysis from TREC 2006
While the macro-averaged method is guaranteed to
produce no more zero-valued scores than the micro-
averaged pyramid method, it is not guaranteed that
the scores will be the same for any given response.
What are the empirical characteristics of each ap-
proach? To explore this question, we once again ex-
amined data from TREC 2006.
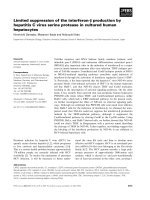
Figure 6 shows a scatter plot of the pyramid F-
score and macro-averaged binary F-score for every
Other questions in all runs from the TREC 2006
QA track main task. Despite focusing on differ-
ent aspects of the evaluation setup, these measures
0.0 0.2 0.4 0.6 0.8
0.0 0.2 0.4 0.6 0.8
Pyramid F−score
Macro−averaged binary F−score
Figure 6: Scatter plot comparing the pyramid and
macro-averaged binary F-scores for all questions.
binary micro macro
binary 1.000/1.000 0.870/0.987 0.861/0.988
micro - 1.000/1.000 0.985/0.996
macro - - 1.000/1.000
Table 1: Pearson’s correlation of F-scores, by ques-
tion and by run.
are highly correlated, even at the level of individ-
ual questions. Table 1 provides a summary of the
correlations between the original binary F-score, the
(micro-averaged) pyramid F-score, and the macro-
averaged binary F-score. Pearson’s r is given for
F-scores at the individual question level (first num-
ber) and at the run level (second number). The cor-
relation between all three variants are about equal at
the level of system runs. At the level of individual
questions, the micro- and macro-averaged F-scores
(using multiple judgments) are still highly correlated
with each other, but each is less correlated with the
single-assessor binary F-score.
4.3 Discussion
The differences between macro- and micro-
averaging methods invoke a more general discus-
sion on notions of nugget importance. There are
actually two different issues we are attempting to
address with our different approaches: the first is
a more granular scale of nugget importance, the
second is variations across a population of users. In
774
the micro-averaged pyramid F-scores, we achieve
the first by leveraging the second, i.e., binary
judgments from a large population are combined
to yield weights for individual nuggets. In the
macro-averaged binary F-score, we focus solely on
population effects without addressing granularity of
nugget importance.
Exploring this thread of argument, we can for-
mulate additional approaches for tackling these is-
sues. We could, for example, solicit more granular
individual judgments on each nugget from each as-
sessor, perhaps on a Likert scale or as a continuous
quantity ranging from zero to one. This would yield
two more methods for computing F-scores, both a
macro-averaged and a micro-averaged variant. The
macro-averaged variant would be especially attrac-
tive because it reflects real users and yet individual
F-scores remain discriminative. Despite its possi-
ble advantages, this extension is rejected based on
resource considerations; making snap binary judg-
ments on individual nuggets is much quicker than a
multi-scaled value assignment—at least at present,
the additional costs are not sufficient to offset the
potential gains.
5 Conclusion
The important role that large-scale evaluations play
in guiding research in human language technologies
means that the community must “get it right.” This
would ordinarily call for a more conservative ap-
proach to avoid changes that might have unintended
consequences. However, evaluation methodologies
must evolve to reflect the shifting interests of the re-
search community to remain relevant. Thus, orga-
nizers of evaluations must walk a fine line between
progress and chaos. Nevertheless, the introduction
of nugget pyramids in the TREC QA evaluation pro-
vides a case study showing how this fine balance can
indeed be achieved. The addition of multiple judg-
ments of nugget importance yields an evaluation that
is both more stable and more discriminative than the
original single-assessor evaluation, while requiring
only a small additional cost in terms of human labor.
We have explored two different methods for com-
bining judgments from multiple assessors to address
shortcomings in the original nugget-based evalua-
tion setup. Although they make different assump-
tions about the evaluation, results from both ap-
proaches are highly correlated. Thus, we can con-
tinue employing the pyramid-based method, which
is well-suited for developing systems, and still be as-
sured that the results remain consistent with an eval-
uation method that maintains a model of real indi-
vidual users.
Acknowledgments
This work has been supported in part by DARPA
contract HR0011-06-2-0001 (GALE). The second
author would like to thank Kiri and Esther for their
kind support.
References
H. Dang, J. Lin, and D. Kelly. 2006. Overview of the
TREC 2006 question answering track. In Proc. of
TREC 2006.
W. Hildebrandt, B. Katz, and J. Lin. 2004. Answering
definition questions with multiple knowledge sources.
In Proc. HLT/NAACL 2004.
D. Lewis. 1991. Evaluating text categorization. In Proc.
of the Speech and Natural Language Workshop.
J. Lin and D. Demner-Fushman. 2005. Automatically
evaluating answers to definition questions. In Proc. of
HLT/EMNLP 2005.
J. Lin and D. Demner-Fushman. 2006. Will pyramids
built of nuggets topple over? In Proc. of HLT/NAACL
2006.
E. Sormunen. 2002. Liberal relevance criteria of
TREC—counting on negligible documents? In Proc.
of SIGIR 2002.
E. Voorhees. 2000. Variations in relevance judgments
and the measurement of retrieval effectiveness. IP&M,
36(5):697–716.
E. Voorhees. 2002. The philosophy of information re-
trieval evaluation. In Proc. of CLEF Workshop.
E. Voorhees. 2003. Overview of the TREC 2003 ques-
tion answering track. In Proc. of TREC 2003.
E. Voorhees. 2005. Using question series to evaluate
question answering system effectiveness. In Proc. of
HLT/EMNLP 2005.
775