Tài liệu Báo cáo khoa học: "Ensemble Document Clustering Using Weighted Hypergraph Generated by NMF" docx
Bạn đang xem bản rút gọn của tài liệu. Xem và tải ngay bản đầy đủ của tài liệu tại đây (99.39 KB, 4 trang )
Proceedings of the ACL 2007 Demo and Poster Sessions, pages 77–80,
Prague, June 2007.
c
2007 Association for Computational Linguistics
Ensemble Document Clustering
Using Weighted Hypergraph Generated by NMF
Hiroyuki Shinnou, Minoru Sasaki
Ibaraki University,
4-12-1 Nakanarusawa, Hitachi,
Ibaraki, Japan 316-8511
shinnou,msasaki @mx.ibaraki.ac.jp
Abstract
In this paper, we propose a new ensemble
document clustering method. The novelty
of our method is the use of Non-negative
Matrix Factorization (NMF) in the genera-
tion phase and a weighted hypergraph in the
integration phase. In our experiment, we
compared our method with some clustering
methods. Our method achieved the best re-
sults.
1 Introduction
In this paper, we propose a new ensemble docu-
ment clustering method using Non-negative Matrix
Factorization (NMF) in the generation phase and a
weighted hypergraph in the integration phase.
Document clustering is the task of dividing a doc-
ument’s data setinto groupsbased ondocumentsim-
ilarity. This is the basic intelligent procedure, and
is important in text mining systems (M. W. Berry,
2003). As the specific application, relevant feed-
back in IR, where retrieved documents are clus-
tered, is actively researched (Hearst and Pedersen,
1996)(Kummamuru et al., 2004).
In document clustering, the document is repre-
sented as a vector, which typically uses the “bag
of word” model and the TF-IDF term weight. A
vector represented in this manner is highly dimen-
sional and sparse. Thus, in document clustering,
a dimensional reduction method such as PCA or
SVD is appliedbeforeactual clustering (Boley et al.,
1999)(Deerwester et al., 1990). Dimensional reduc-
tion maps data in a high-dimensional space into a
low-dimensional space, and improves both cluster-
ing accuracy and speed.
NMF is a dimensional reduction method (Xu et
al., 2003) that is based on the “aspect model” used
in the Probabilistic Latent Semantic Indexing (Hof-
mann, 1999). Because the axis in the reduced space
by NMF corresponds to a topic, the reduced vector
represents the clustering result. For a given term-
document matrix and cluster number, we can obtain
the NMF result with an iterative procedure (Lee and
Seung, 2000). However, this iteration does not al-
ways converge to a global optimum solution. That
is, NMF results depend on the initial value. The
standard countermeasure for this problem is to gen-
erate multiple clustering results by changing the ini-
tial value, and then select the best clustering result
estimated by an object function. However, this se-
lection often fails because the object function does
not always measure clustering accuracy.
To overcome this problem, we use ensemble clus-
tering, which combines multiple clustering results to
obtain an accurate clustering result.
Ensemble clustering consists of generation and
integration phases. The generation phase produces
multiple clustering results. Many strategies have
been proposed to achieve this goal, including ran-
dom initialization (Fred and Jain, 2002), feature ex-
traction based onrandom projection (Fern andBrod-
ley, 2003) and the combination of sets of “weak”
partitions (Topchy et al., 2003). The integration
phase, as the name implies, integrates multiple clus-
tering results to improve the accuracy of the final
clustering result. This phase primarily relies on two
methods. The first method constructs a new simi-
77
larity matrix from multiple clustering results (Fred
and Jain, 2002). The second method constructs new
vectors for each instance data usingmultiplecluster-
ing results (Strehl and Ghosh, 2002). Both methods
apply the clustering procedure to the new object to
obtain the final clustering result.
Our method generates multiple clustering results
by random initialization of the NMF, and integrates
them witha weighted hypergraph instead ofthe stan-
dard hypergraph (Strehl and Ghosh, 2002). An ad-
vantage of our method is that the weighted hyper-
graph can be directly obtained from the NMF result.
In our experiment, we compared the k-means,
NMF, the ensemble method using a standard hyper-
graph and the ensemble method using a weighted
hypergraph. Our method achieved the best results.
2 NMF
The NMF decomposes the term-document
matrix
to the matrix and the transposed
matrix of the
matrix (Xuet al., 2003), where
is the number of clusters; that is,
The -th document corresponds to the -th row
vector of V; that is,
. The
cluster number is obtained from
.
For a given term-document matrix
, we can ob-
tain
and by the following iteration (Lee and
Seung, 2000):
(1)
(2)
Here,
, and represent the -th rowand
the
-th columnelement of , and respectively.
After each iteration,
must be normalized as fol-
lows:
(3)
Either the fixed maximum iteration number, or the
distance
between and stops the iteration:
(4)
In NMF, the clustering result depends on the ini-
tial values. Generally, we conduct NMF several
times with random initialization, and then select the
clusteringresult with thesmallestvalue of Eq.4. The
value of Eq.4 represents the NMF decomposition er-
ror and not the clustering error. Thus, we cannot al-
way select the best result.
3 Ensemble clustering
3.1 Hypergraph data representation
To overcome the above mentioned problem, we
used ensemble clustering. Ensemble clustering con-
sists of generation and integration phases. The first
phase generates multiple clustering results with ran-
dom initialization of the NMF. We integrated them
with the hypergraph proposed in (Strehl and Ghosh,
2002).
Suppose that the generation phase produces
clustering results, and each result has clusters. In
this case, the dimension of the new vector is
.
The
-th dimensional value of the data
is defined as follows: If the -th cluster of the -th
clustering result includes the data
, the value is 1.
Otherwise, the value is 0. Thus, the
dimensional
vector for the data
is constructed.
Consider a simple example, where ,
and the data set is . We generate
four clustering results. Supposing that the first clus-
tering result is
,we
can obtain the 1st, 2nd and 3rd column of the hy-
pergraph as follows:
Repeating the procedure produces a total of four
matrices from four clustering results. Connecting
these four partial matrices, we obtain the following
matrix, which is the hypergraph.
78
3.2 Weighted hypergraph vs. standard
hypergraph
Each element of the hypergraph is 0 or 1. However,
the element value must be real because it represents
the membership degree for the corresponding clus-
ter.
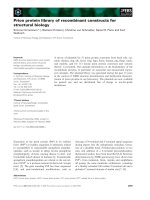
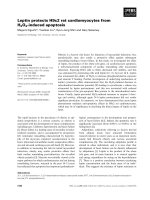
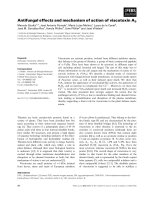
Fortunately, the matrix V produced by NMF de-
scribes the membership degree. Thus, we assign the
real value describedin
to the elementofthe hyper-
graph whose value is 1. Figure 1 shows an example
of this procedure. Our method uses this weighted
hypergraph, instead of a standard hypergraph for in-
tegration.
⎥
⎥
⎥
⎥
⎥
⎥
⎥
⎥
⎥
⎦
⎤
⎢
⎢
⎢
⎢
⎢
⎢
⎢
⎢
⎢
⎣
⎡
809.0190.0001.0
722.0163.0115.0
262.0230.0508.0
151.0438.0411.0
131.0556.0313.0
025.0015.0960.0
127.0150.0723.0
d
d
d
d
d
d
d
ddddddd
NMF
V
normalize
⎥
⎥
⎥
⎥
⎥
⎥
⎥
⎥
⎥
⎦
⎤
⎢
⎢
⎢
⎢
⎢
⎢
⎢
⎢
⎢
⎣
⎡
100
100
001
010
010
001
001
d
d
d
d
d
d
d
⎥
⎥
⎥
⎥
⎥
⎥
⎥
⎥
⎥
⎦
⎤
⎢
⎢
⎢
⎢
⎢
⎢
⎢
⎢
⎢
⎣
⎡
809.000
722.000
00508.0
0438.00
0556.00
00960.0
00723.0
d
d
d
d
d
d
d
Standard
Hyper Graph
Weighted
Hyper Graph
Figure 1: Weighted hypergraph through the matrix
4 Experiment
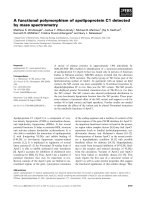
To confirm the effectiveness of our method,we com-
pared the k-means, NMF, the ensemble method us-
ing a standard hypergraph and the ensemble method
using a weighted hypergraph.
In our experiment, we use 18 document data
sets provided at
/>gkhome/cluto/cluto/download
.
The document vector is not normalized for each
data set. We normalize them using TF-IDF.
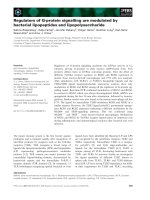
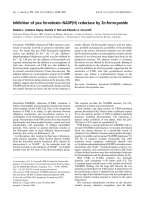
Table 1 shows the result of the experiment
1
. The
value in the table represents entropy, and the smaller
it is, the better the clustering result.
In NMF, we generated 20 clustering results us-
ing random initialization, and selected the cluster-
1
We used the clustering toolkit CLUTO for clustering the
hypergraph.
ing result with the smallest decomposition error.
The selected clustering result is shown as “NMF”
in Table 1. “NMF means” in Table 1 is the average
of 20 entropy values for 20 clustering results. The
“standard hypergraph” and “weighted hypergraph”
in Table 1 show the results of the ensemble method
obtained using the two hypergraph types. Table 1
shows the effectiveness of our method.
5 Related works
When we generate multiple clustering results, the
number of clusters in each clustering is fixed to the
number of clusters in the final clustering result. This
is not a limitation of our ensemble method. Any
number is available for each clustering. Experience
shows that the ensemble clustering using k-means
succeeds when each clustering has many clusters,
and they are combined into fewer clusters, which is
a heuristics that has been reported (Fred and Jain,
2002), and is available for our method
Our method uses the weighted hypergraph, which
is constructed by changing the value 1 in the stan-
dard hypergraph to the corresponding real value in
the matrix
. Taking this idea one step further,
it may be good to change the value 0 in the stan-
dard hypergraph to its real value. In this case,
the weighted hypergraph is constructed by only
connecting multiple
s. We tested this complete
weighted hypergraph, and the results are shown as
“hypergraph V” in Table 1.
“Hypergraph V” was better than the standard hy-
pergraph, but worse than our method. Further-
more, the value 0 may be useful because we can use
the graph spectrum clustering method (Ding et al.,
2001), which is a powerful clustering method for the
spare hypergraph.
In clustering, the cluster label is unassigned.
However, if cluster labeling is possible, we can use
many techniques in the ensemble learning (Breiman,
1996). Cluster labeling is not difficult when there
are two or three clusters. We plan to study this ap-
proach of the labeling cluster first and then using the
techniques from ensemble learning.
6 Conclusion
This paper proposed a new ensemble document clus-
tering method. The novelty of our method is the use
79
Table 1: Document data sets and Experiment results
Data #of #of #of k-means NMF NMF Standard Weighted Hypergraph
doc. terms classes means hypergraph hypergraph V
cacmcisi 4663 41681 2 0.750 0.817 0.693 0.691 0.690 0.778
cranmed 2431 41681 2 0.113 0.963 0.792 0.750 0.450 0.525
fbis 2463 2000 17 0.610 0.393 0.406 0.408 0.381 0.402
hitech 2301 126373 6 0.585 0.679 0.705 0.683 0.684 0.688
k1a 2340 21839 20 0.374 0.393 0.377 0.386 0.351 0.366
k1b 2340 21839 6 0.221 0.259 0.238 0.456 0.216 0.205
la1 3204 31472 6 0.641 0.464 0.515 0.458 0.459 0.491
la2 3075 31472 6 0.620 0.576 0.551 0.548 0.468 0.486
re0 1504 2886 13 0.368 0.419 0.401 0.383 0.379 0.378
re1 1657 3758 25 0.374 0.364 0.346 0.334 0.325 0.337
reviews 4069 126373 5 0.364 0.398 0.538 0.416 0.408 0.391
tr11 414 6429 9 0.349 0.338 0.311 0.300 0.304 0.280
tr12 313 5804 8 0.493 0.332 0.375 0.308 0.307 0.316
tr23 204 5832 6 0.527 0.485 0.489 0.493 0.521 0.474
tr31 927 10128 7 0.385 0.402 0.383 0.343 0.334 0.310
tr41 878 7454 10 0.277 0.358 0.299 0.245 0.270 0.340
tr45 690 8261 10 0.397 0.345 0.328 0.277 0.274 0.380
wap 1560 6460 20 0.408 0.371 0.374 0.336 0.327 0.344
Average 1946.2 27874.5 9.9 0.436 0.464 0.451 0.434 0.397 0.416
of NMF in the generation phase and a weighted hy-
pergraph in the integration phase. One advantage of
our method is that the weighted hypergraph can be
obtained directly from the NMF results. Our exper-
iment showed the effectiveness of our method using
18 document data sets. In the future, we will use an
ensemble learning technique by labeling clusters.
References
D. Boley, M. L. Gini, R. Gross, E. Han, K. Hastings,
G. Karypis, V. Kumar, B. Mobasher, and J. Moore.
1999. Document categorization and query generation
on the world wide web using webace. Artificial Intel-
ligence Review, 13(5-6):365–391.
L. Breiman. 1996. Bagging predictors. Machine Learn-
ing, 24(2):123–140.
S. C. Deerwester, S. T. Dumais, T. K. Landauer, G. W.
Furnas, and R. A. Harshman. 1990. Indexing by latent
semantic analysis. Journal of the American Society of
Information Science, 41(6):391–407.
C. Ding, X. He, H. Zha, M. Gu, and H. Simon. 2001.
Spectral Min-max Cut for Graph Partitioning and Data
Clustering. In Lawrence Berkeley National Lab. Tech.
report 47848.
X. Z. Fern and C. E. Brodley. 2003. Random Projec-
tion for High Dimensional Data Clustering: A Cluster
Ensemble Approach. In the 20th International Con-
ference of Machine Learning (ICML-03).
A.L.N. Fred and A. K. Jain. 2002. Data Clustering Us-
ing Evidence Accumulation. In the 16th international
conference on pattern recognition, pages 276–280.
M. A. Hearst and J. O. Pedersen. 1996. Reexamining the
cluster hypothesis: Scatter/gather on retrieval results.
In Proceedings of SIGIR-96, pages 76–84.
T. Hofmann. 1999. Probabilistic Latent Semantic Index-
ing. In Proceedings of the 22nd Annual ACM Con-
ference on Research and Development in Information
Retrieval, pages 50–57.
K. Kummamuru, R. Lotlikar, S. Roy, K. Singal, and
R. Krishnapuram. 2004. A Hierarchical Monothetic
Document Clustering Algorithm for Summarization
and Browsing Search Results. In Proceedings of
WWW-04, pages 658–665.
D. D. Lee and H. S. Seung. 2000. Algorithms for non-
negative matrix factorization. In NIPS, pages 556–
562.
M. W. Berry, editor. 2003. Survey of Text Mining: Clus-
tering, Classification, and Retrieval. Springer.
A. Strehl and J. Ghosh. 2002. Cluster Ensembles - A
Knowledge Reuse Framework for Combining Multi-
ple Partitions. In Conference on Artificial Intelligence
(AAAI-2002), pages 93–98.
A. Topchy, A. K. Jain, and W. Punch. 2003. Combining
Multiple Weak Clusterings.
W. Xu, X. Liu, and Y. Gong. 2003. Document clus-
tering based on non-negative matrix factorization. In
Proceedings of SIGIR-03, pages 267–273.
80