Tài liệu Báo cáo khoa học: "An Empirical Study of Information Synthesis Tasks" doc
Bạn đang xem bản rút gọn của tài liệu. Xem và tải ngay bản đầy đủ của tài liệu tại đây (282.13 KB, 8 trang )
An Empirical Study of Information Synthesis Tasks
Enrique Amig
´
o Julio Gonzalo V
´
ıctor Peinado Anselmo Pe
˜
nas Felisa Verdejo
Departamento de Lenguajes y Sistemas Inform
´
aticos
Universidad Nacional de Educaci
´
on a Distancia
c/Juan del Rosal, 16 - 28040 Madrid - Spain
{enrique,julio,victor,anselmo,felisa}@lsi.uned.es
Abstract
This paper describes an empirical study of the “In-
formation Synthesis” task, defined as the process of
(given a complex information need) extracting, or-
ganizing and inter-relating the pieces of information
contained in a set of relevant documents, in order to
obtain a comprehensive, non redundant report that
satisfies the information need.
Two main results are presented: a) the creation
of an Information Synthesis testbed with 72 reports
manually generated by nine subjects for eight com-
plex topics with 100 relevant documents each; and
b) an empirical comparison of similarity metrics be-
tween reports, under the hypothesis that the best
metric is the one that best distinguishes between
manual and automatically generated reports. A met-
ric based on key concepts overlap gives better re-
sults than metrics based on n-gram overlap (such as
ROUGE) or sentence overlap.
1 Introduction
A classical Information Retrieval (IR) system helps
the user finding relevant documents in a given text
collection. In most occasions, however, this is only
the first step towards fulfilling an information need.
The next steps consist of extracting, organizing and
relating the relevant pieces of information, in or-
der to obtain a comprehensive, non redundant report
that satisfies the information need.
In this paper, we will refer to this process as In-
formation Synthesis. It is normally understood as
an (intellectually challenging) human task, and per-
haps the Google Answer Service
1
is the best gen-
eral purpose illustration of how it works. In this ser-
vice, users send complex queries which cannot be
answered simply by inspecting the first two or three
documents returned by a search engine. These are a
couple of real, representative examples:
a) I’m looking for information concerning the history of text
compression both before and with computers.
1
b) Provide an analysis on the future of web browsers, if
any.
Answers to such complex information needs are
provided by experts which, commonly, search the
Internet, select the best sources, and assemble the
most relevant pieces of information into a report,
organizing the most important facts and providing
additional web hyperlinks for further reading. This
Information Synthesis task is understood, in Google
Answers, as a human task for which a search engine
only provides the initial starting point. Our mid-
term goal is to develop computer assistants that help
users to accomplish Information Synthesis tasks.
From a Computational Linguistics point of view,
Information Synthesis can be seen as a kind of
topic-oriented, informative multi-document sum-
marization, where the goal is to produce a single
text as a compressed version of a set of documents
with a minimum loss of relevant information. Un-
like indicative summaries (which help to determine
whether a document is relevant to a particular topic),
informative summaries must be helpful to answer,
for instance, factual questions about the topic. In
the remainder of the paper, we will use the term
“reports” to refer to the summaries produced in an
Information Synthesis task, in order to distinguish
them from other kinds of summaries.
Topic-oriented multi-document summarization
has already been studied in other evaluation ini-
tiatives which provide testbeds to compare alterna-
tive approaches (Over, 2003; Goldstein et al., 2000;
Radev et al., 2000). Unfortunately, those stud-
ies have been restricted to very small summaries
(around 100 words) and small document sets (10-
20 documents). These are relevant summarization
tasks, but hardly representative of the Information
Synthesis problem we are focusing on.
The first goal of our work has been, therefore,
to create a suitable testbed that permits qualitative
and quantitative studies on the information synthe-
sis task. Section 2 describes the creation of such a
testbed, which includes the manual generation of 72
reports by nine different subjects across 8 complex
topics with 100 relevant documents per topic.
Using this testbed, our second goal has been to
compare alternative similarity metrics for the Infor-
mation Synthesis task. A good similarity metric
provides a way of evaluating Information Synthe-
sis systems (comparing their output with manually
generated reports), and should also shed some light
on the common properties of manually generated re-
ports. Our working hypothesis is that the best metric
will best distinguish between manual and automati-
cally generated reports.
We have compared several similarity metrics, in-
cluding a few baseline measures (based on docu-
ment, sentence and vocabulary overlap) and a state-
of-the-art measure to evaluate summarization sys-
tems, ROUGE (Lin and Hovy, 2003). We also intro-
duce another proximity measure based on key con-
cept overlap, which turns out to be substantially bet-
ter than ROUGE for a relevant class of topics.
Section 3 describes these metrics and the experi-
mental design to compare them; in Section 4, we an-
alyze the outcome of the experiment, and Section 5
discusses related work. Finally, Section 6 draws the
main conclusions of this work.
2 Creation of an Information Synthesis
testbed
We refer to Information Synthesis as the process
of generating a topic-oriented report from a non-
trivial amount of relevant, possibly interrelated doc-
uments. The first goal of our work is the generation
of a testbed (ISCORPUS) with manually produced
reports that serve as a starting point for further em-
pirical studies and evaluation of information synthe-
sis systems. This section describes how this testbed
has been built.
2.1 Document collection and topic set
The testbed must have a certain number of features
which, altogether, differentiate the task from current
multi-document summarization evaluations:
Complex information needs. Being Informa-
tion Synthesis a step which immediately follows a
document retrieval process, it seems natural to start
with standard IR topics as used in evaluation con-
ferences such as TREC
2
, CLEF
3
or NTCIR
4
. The
title/description/narrative topics commonly used in
such evaluation exercises are specially well suited
for an Information Synthesis task: they are complex
2
3
4
/>and well defined, unlike, for instance, typical web
queries.
We have selected the Spanish CLEF 2001-2003
news collection testbed (Peters et al., 2002), be-
cause Spanish is the native language of the subjects
recruited for the manual generation of reports. Out
of the CLEF topic set, we have chosen the eight
topics with the largest number of documents man-
ually judged as relevant from the assessment pools.
We have slightly reworded the topics to change the
document retrieval focus (“Find documents that ”)
into an information synthesis wording (“Generate a
report about ”). Table 1 shows the eight selected
topics.
C042: Generate a report about the invasion of Haiti by UN/US
soldiers.
C045: Generate a report about the main negotiators of the
Middle East peace treaty between Israel and Jordan, giving
detailed information on the treaty.
C047: What are the reasons for the military intervention of
Russia in Chechnya?
C048: Reasons for the withdrawal of United Nations (UN)
peace- keeping forces from Bosnia.
C050: Generate a report about the uprising of Indians in
Chiapas (Mexico).
C085: Generate a report about the operation “Turquoise”, the
French humanitarian program in Rwanda.
C056: Generate a report about campaigns against racism in
Europe.
C080: Generate a report about hunger strikes attempted in
order to attract attention to a cause.
Table 1: Topic set
This set of eight CLEF topics has two differenti-
ated subsets: in a majority of cases (first six topics),
it is necessary to study how a situation evolves in
time; the importance of every event related to the
topic can only be established in relation with the
others. The invasion of Haiti by UN and USA troops
(C042) is an example of such a topic. We will refer
to them as “Topic Tracking” (TT) reports, because
they resemble the kind of topics used in such task.
The last two questions (56 and 80), however, re-
semble Information Extraction tasks: essentially,
the user has to detect and describe instances of
a generic event (cases of hunger strikes and cam-
paigns against racism in Europe); hence we will re-
fer to them as “IE” reports.
Topic tracking reports need a more elaborated
treatment of the information in the documents, and
therefore are more interesting from the point of view
of Information Synthesis. We have, however, de-
cided to keep the two IE topics; first, because they
also reflect a realistic synthesis task; and second, be-
cause they can provide contrastive information as
compared to TT reports.
Large document sets. All the selected CLEF
topics have more than one hundred documents
judged as relevant by the CLEF assessors. For ho-
mogeneity, we have restricted the task to the first
100 documents for each topic (using a chronologi-
cal order).
Complex reports. The elaboration of a com-
prehensive report requires more space than is al-
lowed in current multi-document summarization ex-
periences. We have established a maximum of fifty
sentences per summary, i.e., half a sentence per doc-
ument. This limit satisfies three conditions: a) it
is large enough to contain the essential information
about the topic, b) it requires a substantial compres-
sion effort from the user, and c) it avoids defaulting
to a “first sentence” strategy by lazy (or tired) users,
because this strategy would double the maximum
size allowed.
We decided that the report generation would be
an extractive task, which consists of selecting sen-
tences from the documents. Obviously, a realistic
information synthesis process also involves rewrit-
ing and elaboration of the texts contained in the doc-
uments. Keeping the task extractive has, however,
two major advantages: first, it permits a direct com-
parison to automatic systems, which will typically
be extractive; and second, it is a simpler task which
produces less fatigue.
2.2 Generation of manual reports
Nine subjects between 25 and 35 years-old were re-
cruited for the manual generation of reports. All
of them self-reported university degrees and a large
experience using search engines and performing in-
formation searches.
All subjects were given an in-place detailed de-
scription of the task in order to minimize divergent
interpretations. They were told that, in a first step,
they had to generate reports with a maximum of in-
formation about every topic within the fifty sentence
space limit. In a second step, which would take
place six months afterwards, they would be exam-
ined from each of the eight topics. The only docu-
mentation allowed during the exam would be the re-
ports generated in the first phase of the experiment.
Subjects scoring best would be rewarded.
These instructions had two practical effects: first,
the competitive setup was an extra motivation for
achieving better results. And second, users tried to
take advantage of all available space, and thus most
reports were close to the fifty sentences limit. The
time limit per topic was set to 30 minutes, which is
tight for the information synthesis task, but prevents
the effects of fatigue.
We implemented an interface to facilitate the gen-
eration of extractive reports. The system displays a
list with the titles of relevant documents in chrono-
logical order. Clicking on a title displays the full
document, where the user can select any sentence(s)
and add them to the final report. A different frame
displays the selected sentences (also in chronolog-
ical order), together with one bar indicating the re-
maining time and another bar indicating the remain-
ing space. The 50 sentence limit can be temporarily
exceeded and, when the 30 minute limit has been
reached, the user can still remove sentences from
the report until the sentence limit is reached back.
2.3 Questionnaires
After summarizing every topic, the following ques-
tionnaire was filled in by every user:
• Who are the main people involved in the topic?
• What are the main organizations participating in the
topic?
• What are the key factors in the topic?
Users provided free-text answers to these ques-
tions, with their freshly generated summary at hand.
We did not provide any suggestions or constraints
at this point, except that a maximum of eight slots
were available per question (i.e. a maximum of
8X3 = 24 key concepts per topic, per user).
This is, for instance, the answer of one user for
the topic 42 about the invasion of Haiti by UN and
USA troops in 1994:
People Organizations
Jean Bertrand Aristide ONU (UN)
Clinton EEUU (USA)
Raoul Cedras OEA (OAS)
Philippe Biambi
Michel Josep Francois
Factors
militares golpistas (coup attempting soldiers)
golpe militar (coup attempt)
restaurar la democracia (reinstatement of democracy)
Finally, a single list of key concepts is gener-
ated for each topic, joining all the different answers.
Redundant concepts (e.g. “war” and “conflict”)
were inspected and collapsed by hand. These lists
of key concepts constitute the gold standard for the
similarity metric described in Section 3.2.5.
Besides identifying key concepts, users also filled
in the following questionnaire:
• Were you familiarized with the topic?
• Was it hard for you to elaborate the report?
• Did you miss the possibility of introducing annotations
or rewriting parts of the report by hand?
• Do you consider that you generated a good report?
• Are you tired?
Out of the answers provided by users, the most
remarkable facts are that:
• only in 6% of the cases the user missed “a lot”
the possibility of rewriting/adding comments
to the topic. The fact that reports are made ex-
tractively did not seem to be a significant prob-
lem for our users.
• in 73% of the cases, the user was quite or very
satisfied about his summary.
These are indications that the practical con-
straints imposed on the task (time limit and extrac-
tive nature of the summaries) do not necessarily
compromise the representativeness of the testbed.
The time limit is very tight, but the temporal ar-
rangement of documents and their highly redundant
nature facilitates skipping repetitive material (some
pieces of news are discarded just by looking at the
title, without examining the content).
2.4 Generation of baseline reports
We have automatically generated baseline reports in
two steps:
• For every topic, we have produced 30 tentative
baseline reports using DUC style criteria:
– 18 summaries consist only of picking the
first sentence out of each document in 18
different document subsets. The subsets
are formed using different strategies, e.g.
the most relevant documents for the query
(according to the Inquery search engine),
one document per day, the first or last 50
documents in chronological order, etc.
– The other 12 summaries consist of a)
picking the first n sentences out of a set
of selected documents (with different val-
ues for n and different sets of documents)
and b) taking the full content of a few doc-
uments. In both cases, document sets are
formed with similar criteria as above.
• Out of these 30 baseline reports, we have se-
lected the 10 reports which have the highest
sentence overlap with the manual summaries.
The second step increases the quality of the base-
lines, making the task of differentiating manual and
baseline reports more challenging.
3 Comparison of similarity metrics
Formal aspects of a summary (or report), such
as legibility, grammatical correctness, informative-
ness, etc., can only be evaluated manually. How-
ever, automatic evaluation metrics can play a useful
role in the evaluation of how well the information
from the original sources is preserved (Mani, 2001).
Previous studies have shown that it is feasible to
evaluate the output of summarization systems au-
tomatically (Lin and Hovy, 2003). The process is
based in similarity metrics between texts. The first
step is to establish a (manual) reference summary,
and then the automatically generated summaries are
ranked according to their similarity to the reference
summary.
The challenge is, then, to define an appropriate
proximity metric for reports generated in the infor-
mation synthesis task.
3.1 How to compare similarity metrics without
human judgments? The QARLA
estimation
In tasks such as Machine Translation and Summa-
rization, the quality of a proximity metric is mea-
sured in terms of the correlation between the rank-
ing produced by the metric, and a reference ranking
produced by human judges. An optimal similarity
metric should produce the same ranking as human
judges.
In our case, acquiring human judgments about
the quality of the baseline reports is too costly, and
probably cannot be done reliably: a fine-grained
evaluation of 50-sentence reports summarizing sets
of 100 documents is a very complex task, which
would probably produce different rankings from
different judges.
We believe there is a cheaper and more robust
way of comparing similarity metrics without using
human assessments. We assume a simple hypothe-
sis: the best metric should be the one that best dis-
criminates between manual and automatically gen-
erated reports. In other words, a similarity metric
that cannot distinguish manual and automatic re-
ports cannot be a good metric. Then, all we need
is an estimation of how well a similarity metric sep-
arates manual and automatic reports. We propose
to use the probability that, given any manual report
M
ref
, any other manual report M is closer to M
ref
than any other automatic report A:
QARLA(sim) = P (sim(M, M
ref
) > sim(A, M
ref
))
where M, M
ref
∈ M, A ∈ A
where M is the set of manually generated re-
ports, A is the set of automatically generated re-
ports, and “sim” is the similarity metric being eval-
uated.
We refer to this value as the QARLA
5
estimation.
QARLA has two interesting features:
• No human assessments are needed to compute
QARLA. Only a set of manually produced
summaries and a set of automatic summaries,
for each topic considered. This reduces the
cost of creating the testbed and, in addition,
eliminates the possible bias introduced by hu-
man judges.
• It is easy to collect enough data to achieve sta-
tistically significant results. For instance, our
testbed provides 720 combinations per topic
to estimate QARLA probability (we have
nine manual plus ten automatic summaries per
topic).
A good QARLA value does not guarantee that
a similarity metric will produce the same rankings
as human judges, but a good similarity metric must
have a good QARLA value: it is unlikely that
a measure that cannot distinguish between manual
and automatic summaries can still produce high-
quality rankings of automatic summaries by com-
parison to manual reference summaries.
3.2 Similarity metrics
We have compared five different metrics using the
QARLA estimation. The first three are meant as
baselines; the fourth is the standard similarity met-
ric used to evaluate summaries (ROUGE); and the
last one, introduced in this paper, is based on the
overlapping of key concepts.
3.2.1 Baseline 1: Document co-selection metric
The following metric estimates the similarity of two
reports from the set of documents which are repre-
sented in both reports (i.e. at least one sentence in
each report belongs to the document).
DocSim(M
r
, M) =
|Doc(M
r
) ∩ Doc(M )|
|Doc(M
r
)|
where M
r
is the reference report, M a second re-
port and Doc(M
r
), Doc(M) are the documents to
which the sentences in M
r
, M belong to.
5
Quality criterion for reports evaluation metrics
3.2.2 Baselines 2 and 3: Sentence co-selection
The more sentences in common between two re-
ports, the more similar their content will be. We can
measure Recall (how many sentences from the ref-
erence report are also in the contrastive report) and
Precision (how many sentences from the contrastive
report are also in the reference report):
SentenceSimR(M
r
, M) =
|S(M
r
) ∩ S(M)|
|S(M
r
)|
SentenceSimP (M
r
, M) =
|S(M
r
) ∩ S(M)|
|S(M )|
where S(M
r
), S(M ) are the sets of sentences in
the reports M
r
(reference) and M (contrastive).
3.2.3 Baseline 4: Perplexity
A language model is a probability distribution over
word sequences obtained from some training cor-
pora (see e.g. (Manning and Schutze, 1999)). Per-
plexity is a measure of the degree of surprise of a
text or corpus given a language model. In our case,
we build a language model LM(M
r
) for the refer-
ence report M
r
, and measure the perplexity of the
contrastive report M as compared to that language
model:
P erplexitySim(M
r
, M) =
1
P erp(LM (M
r
), M)
We have used the Good-Turing discount algo-
rithm to compute the language models (Clarkson
and Rosenfeld, 1997). Note that this is also a base-
line metric, because it only measures whether the
content of the contrastive report is compatible with
the reference report, but it does not consider the cov-
erage: a single sentence from the reference report
will have a low perplexity, even if it covers only a
small fraction of the whole report. This problem
is mitigated by the fact that we are comparing re-
ports of approximately the same size and without
repeated sentences.
3.2.4 ROUGE metric
The distance between two summaries can be estab-
lished as a function of their vocabulary (unigrams)
and how this vocabulary is used (n-grams). From
this point of view, some of the measures used in the
evaluation of Machine Translation systems, such as
BLEU (Papineni et al., 2002), have been imported
into the summarization task. BLEU is based in the
precision and n-gram co-ocurrence between an au-
tomatic translation and a reference manual transla-
tion.
(Lin and Hovy, 2003) tried to apply BLEU as
a measure to evaluate summaries, but the results
were not as good as in Machine Translation. In-
deed, some of the characteristics that define a good
translation are not related with the features of a good
summary; then Lin and Hovy proposed a recall-
based variation of BLEU, known as ROUGE. The
idea is the same: the quality of a proposed sum-
mary can be calculated as a function of the n-grams
in common between the units of a model summary.
The units can be sentences or discourse units:
ROUGE
n
=
C∈{M U}
n-gram∈C
Count
m
C∈{M U}
n-gram∈C
Count
where MU is the set of model units, Count
m
is
the maximum number of n-grams co-ocurring in a
peer summary and a model unit, and Count is the
number of n-grams in the model unit. It has been
established that unigram and bigram based metrics
permit to create a ranking of automatic summaries
better (more similar to a human-produced ranking)
than n-grams with n > 2.
For our experiment, we have only considered un-
igrams (lemmatized words, excluding stop words),
which gives good results with standard summaries
(Lin and Hovy, 2003).
3.2.5 Key concepts metric
Two summaries generated by different subjects may
differ in the documents that contribute to the sum-
mary, in the sentences that are chosen, and even in
the information that they provide. In our Informa-
tion Synthesis settings, where topics are complex
and the number of documents to summarize is large,
it is likely to expect that similarity measures based
on document, sentence or n-gram overlap do not
give large similarity values between pairs of man-
ually generated summaries.
Our hypothesis is that two manual reports, even if
they differ in their information content, will have the
same (or very similar) key concepts; if this is true,
comparing the key concepts of two reports can be a
better similarity measure than the previous ones.
In order to measure the overlap of key concepts
between two reports, we create a vector
kc for every
report, such that every element in the vector repre-
sents the frequency of a key concept in the report in
relation to the size of the report:
kc(M)
i
=
freq(C
i
, M)
|words(M)|
being f req(C
i
, M) the number of times the
key concept C
i
appears in the report M, and
|words(M)| the number of words in the report.
The key concept similarity NICOS (Nuclear In-
formative Concept Similarity) between two reports
M and M
r
can then be defined as the inverse of the
Euclidean distance between their associated concept
vectors:
NICOS(M, M
r
) =
1
|
kc(M
r
) −
kc(M)|
In our experiment, the dimensions of kc vectors
correspond to the list of key concepts provided by
our test subjects (see Section 2.3). This list is our
gold standard for every topic.
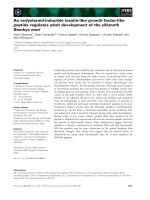
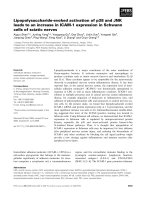
4 Experimental results
Figure 1 shows, for every topic (horizontal axis),
the QARLA estimation obtained for each similarity
metric, i.e., the probability of a manual report being
closer to other manual report than to an automatic
report. Table 2 shows the average QARLA measure
across all topics.
Metric TT topics IE topics
Perplexity 0.19 0.60
DocSim 0.20 0.34
SentenceSimR 0.29 0.52
SentenceSimP 0.38 0.57
ROUGE 0.54 0.53
NICOS 0.77 0.52
Table 2: Average QARLA
For the six TT topics, the key concept similarity
NICOS performs 43% better than ROUGE, and all
baselines give poor results (all their QARLA proba-
bilities are below chance, QARLA < 0.5). A non-
parametric Wilcoxon sign test confirms that the dif-
ference between NICOS and ROUGE is highly sig-
nificant (p < 0.005). This is an indication that the
Information Synthesis task, as we have defined it,
should not be studied as a standard summarization
problem. It also confirms our hypothesis that key
concepts tend to be stable across different users, and
may help to generate the reports.
The behavior of the two Information Extraction
(IE) topics is substantially different from TT topics.
While the ROUGE measure remains stable (0.53
versus 0.54), the key concept similarity is much
worse with IE topics (0.52 versus 0.77). On the
other hand, all baselines improve, and some of them
(SentenceSim precision and perplexity) give better
results than both ROUGE and NICOS.
Of course, no reliable conclusion can be obtained
from only two IE topics. But the observed differ-
ences suggest that TT and IE may need different
approaches, both to the automatic generation of re-
ports and to their evaluation.
Figure 1: Comparison of similarity metrics by topic
One possible reason for this different behavior is
that IE topics do not have a set of consistent key
concepts; every case of a hunger strike, for instance,
involves different people, organizations and places.
The average number of different key concepts is
18.7 for TT topics and 28.5 for IE topics, a differ-
ence that reveals less agreement between subjects,
supporting this argument.
5 Related work
Besides the measures included in our experiment,
there are other criteria to compare summaries which
could as well be tested for Information Synthesis:
Annotation of relevant sentences in a corpus.
(Khandelwal et al., 2001) propose a task, called
“Temporal Summarization”, that combines summa-
rization and topic tracking. The paper describes the
creation of an evaluation corpus in which the most
relevant sentences in a set of related news were an-
notated. Summaries are evaluated with a measure
called “novel recall”, based in sentences selected by
a summarization system and sentences manually as-
sociated to events in the corpus. The agreement rate
between subjects in the identification of key events
and the sentence annotation does not correspond
with the agreement between reports that we have
obtained in our experiments. There are, at least, two
reasons to explain this:
• (Khandelwal et al., 2001) work on an average
of 43 documents, half the size of the topics in
our corpus.
• Although there are topics in both experiments,
the information needs in our testbed are more
complex (e.g. motivations for the invasion of
Chechnya)
Factoids. One of the problems in the evalua-
tion of summaries is the versatility of human lan-
guage. Two different summaries may contain the
same information. In (Halteren and Teufel, 2003),
the content of summaries is manually represented,
decomposing sentences in factoids or simple facts.
They also annotate the composition, generalization
and implication relations between extracted fac-
toids. The resulting measure is different from un-
igram based similarity. The main problem of fac-
toids, as compared to other metrics, is that they re-
quire a costly manual processing of the summaries
to be evaluated.
6 Conclusions
In this paper, we have reported an empirical study
of the “Information Synthesis” task, defined as the
process of (given a complex information need) ex-
tracting, organizing and relating the pieces of infor-
mation contained in a set of relevant documents, in
order to obtain a comprehensive, non redundant re-
port that satisfies the information need.
We have obtained two main results:
• The creation of an Information Synthesis
testbed (ISCORPUS) with 72 reports manually
generated by 9 subjects for 8 complex topics
with 100 relevant documents each.
• The empirical comparison of candidate metrics
to estimate the similarity between reports.
Our empirical comparison uses a quantitative cri-
terion (the QARLA estimation) based on the hy-
pothesis that a good similarity metric will be able to
distinguish between manual and automatic reports.
According to this measure, we have found evidence
that the Information Synthesis task is not a standard
multi-document summarization problem: state-of-
the-art similarity metrics for summaries do not per-
form equally well with the reports in our testbed.
Our most interesting finding is that manually
generated reports tend to have the same key con-
cepts: a similarity metric based on overlapping key
concepts (NICOS) gives significantly better results
than metrics based on language models, n-gram co-
ocurrence and sentence overlapping. This is an in-
dication that detecting relevant key concepts is a
promising strategy in the process of generating re-
ports.
Our results, however, has also some intrinsic lim-
itations. Firstly, manually generated summaries are
extractive, which is good for comparison purposes,
but does not faithfully reflect a natural process of
human information synthesis. Another weakness is
the maximum time allowed per report: 30 minutes
seems too little to examine 100 documents and ex-
tract a decent report, but allowing more time would
have caused an excessive fatigue to users. Our vol-
unteers, however, reported a medium to high satis-
faction with the results of their work, and in some
occasions finished their task without reaching the
time limit.
ISCORPUS is available at:
/>Acknowledgments
This research has been partially supported by a
grant of the Spanish Government, project HERMES
(TIC-2000-0335-C03-01). We are indebted to E.
Hovy for his comments on an earlier version of
this paper, and C. Y. Lin for his assistance with the
ROUGE measure. Thanks also to our volunteers for
their valuable cooperation.
References
P. Clarkson and R. Rosenfeld. 1997. Statistical
language modeling using the CMU-Cambridge
toolkit. In Proceeding of Eurospeech ’97,
Rhodes, Greece.
J. Goldstein, V. O. Mittal, J. G. Carbonell, and
J. P. Callan. 2000. Creating and Evaluating
Multi-Document Sentence Extract Summaries.
In Proceedings of Ninth International Confer-
ences on Information Knowledge Management
(CIKM´00), pages 165–172, McLean, VA.
H. V. Halteren and S. Teufel. 2003. Examin-
ing the Consensus between Human Summaries:
Initial Experiments with Factoids Analysis. In
HLT/NAACL-2003 Workshop on Automatic Sum-
marization, Edmonton, Canada.
V. Khandelwal, R. Gupta, and J. Allan. 2001. An
Evaluation Corpus for Temporal Summarization.
In Proceedings of the First International Confer-
ence on Human Language Technology Research
(HLT 2001), Tolouse, France.
C. Lin and E. H. Hovy. 2003. Automatic Evalua-
tion of Summaries Using N-gram Co-ocurrence
Statistics. In Proceeding of the 2003 Language
Technology Conference (HLT-NAACL 2003), Ed-
monton, Canada.
I. Mani. 2001. Automatic Summarization, vol-
ume 3 of Natural Language Processing. John
Benjamins Publishing Company, Amster-
dam/Philadelphia.
C. D. Manning and H. Schutze. 1999. Foundations
of statistical natural language processing. MIT
Press, Cambridge Mass.
P. Over. 2003. Introduction to DUC-2003: An In-
trinsic Evaluation of Generic News Text Summa-
rization Systems. In Proceedings of Workshop on
Automatic Summarization (DUC 2003).
K. Papineni, S. Roukos, T. Ward, and W. Zhu.
2002. Bleu: a method for automatic evalua-
tion of machine translation. In Proceedings of
the 40th Annual Meeting of the Association for
Computational Linguistics (ACL), pages 311–
318, Philadelphia.
C. Peters, M. Braschler, J. Gonzalo, and M. Kluck,
editors. 2002. Evaluation of Cross-Language
Information Retrieval Systems, volume 2406 of
Lecture Notes in Computer Science. Springer-
Verlag, Berlin-Heidelberg-New York.
D. R. Radev, J. Hongyan, and M. Budzikowska.
2000. Centroid-Based Summarization of Mul-
tiple Documents: Sentence Extraction, Utility-
Based Evaluation, and User Studies. In Proceed-
ings of the Workshop on Automatic Summariza-
tion at the 6th Applied Natural Language Pro-
cessing Conference and the 1st Conference of the
North American Chapter of the Association for
Computational Linguistics, Seattle, WA, April.