Tài liệu Báo cáo khoa học: "Learning with Unlabeled Data for Text Categorization Using Bootstrapping and Feature Projection Techniques" doc
Bạn đang xem bản rút gọn của tài liệu. Xem và tải ngay bản đầy đủ của tài liệu tại đây (232.1 KB, 8 trang )
Learning with Unlabeled Data for Text Categorization Using Bootstrapping
and Feature Projection Techniques
Youngjoong Ko
Dept. of Computer Science, Sogang Univ.
Sinsu-dong 1, Mapo-gu
Seoul, 121-742, Korea
Jungyun Seo
Dept. of Computer Science, Sogang Univ.
Sinsu-dong 1, Mapo-gu
Seoul, 121-742, Korea
Abstract
A wide range of supervised learning
algorithms has been applied to Text
Categorization. However, the supervised
learning approaches have some problems. One
of them is that they require a large, often
prohibitive, number of labeled training
documents for accurate learning. Generally,
acquiring class labels for training data is costly,
while gathering a large quantity of unlabeled
data is cheap. We here propose a new
automatic text categorization method for
learning from only unlabeled data using a
bootstrapping framework and a feature
projection technique. From results of our
experiments, our method showed reasonably
comparable performance compared with a
supervised method. If our method is used in a
text categorization task, building text
categorization systems will become
significantly faster and less expensive.
1 Introduction
Text categorization is the task of classifying
documents into a certain number of pre-defined
categories. Many supervised learning algorithms
have been applied to this area. These algorithms
today are reasonably successful when provided
with enough labeled or annotated training
examples. For example, there are Naive Bayes
(McCallum and Nigam, 1998), Rocchio (Lewis et
al., 1996), Nearest Neighbor (kNN) (Yang et al.,
2002), TCFP (Ko and Seo, 2002), and Support
Vector Machine (SVM) (Joachims, 1998).
However, the supervised learning approach has
some difficulties. One key difficulty is that it
requires a large, often prohibitive, number of
labeled training data for accurate learning. Since a
labeling task must be done manually, it is a
painfully time-consuming process. Furthermore,
since the application area of text categorization has
diversified from newswire articles and web pages
to E-mails and newsgroup postings, it is also a
difficult task to create training data for each
application area (Nigam et al., 1998). In this light,
we consider learning algorithms that do not require
such a large amount of labeled data.
While labeled data are difficult to obtain,
unlabeled data are readily available and plentiful.
Therefore, this paper advocates using a
bootstrapping framework and a feature projection
technique with just unlabeled data for text
categorization. The input to the bootstrapping
process is a large amount of unlabeled data and a
small amount of seed information to tell the learner
about the specific task. In this paper, we consider
seed information in the form of title words
associated with categories. In general, since
unlabeled data are much less expensive and easier
to collect than labeled data, our method is useful
for text categorization tasks including online data
sources such as web pages, E-mails, and
newsgroup postings.
To automatically build up a text classifier with
unlabeled data, we must solve two problems; how
we can automatically generate labeled training
documents (machine-labeled data) from only title
words and how we can handle incorrectly labeled
documents in the machine-labeled data. This paper
provides solutions for these problems. For the first
problem, we employ the bootstrapping framework.
For the second, we use the TCFP classifier with
robustness from noisy data (Ko and Seo, 2004).
How can labeled training data be automatically
created from unlabeled data and title words?
Maybe unlabeled data don’t have any information
for building a text classifier because they do not
contain the most important information, their
category. Thus we must assign the class to each
document in order to use supervised learning
approaches. Since text categorization is a task
based on pre-defined categories, we know the
categories for classifying documents. Knowing the
categories means that we can choose at least a
representative title word of each category. This is
the starting point of our proposed method. As we
carry out a bootstrapping task from these title
words, we can finally get labeled training data.
Suppose, for example, that we are interested in
classifying newsgroup postings about specially
‘Autos’ category. Above all, we can select
‘automobile’ as a title word, and automatically
extract keywords (‘car’, ‘gear’, ‘transmission’,
‘sedan’, and so on) using co-occurrence
information. In our method, we use context (a
sequence of 60 words) as a unit of meaning for
bootstrapping from title words; it is generally
constructed as a middle size of a sentence and a
document. We then extract core contexts that
include at least one of the title words and the
keywords. We call them centroid-contexts because
they are regarded as contexts with the core
meaning of each category. From the centroid-
contexts, we can gain many words contextually co-
occurred with the title words and keywords:
‘driver’, ‘clutch’, ‘trunk’, and so on. They are
words in first-order co-occurrence with the title
words and the keywords. To gather more
vocabulary, we extract contexts that are similar to
centroid-contexts by a similarity measure; they
contain words in second-order co-occurrence with
the title words and the keywords. We finally
construct context-cluster of each category as the
combination of centroid-contexts and contexts
selected by the similarity measure. Using the
context-clusters as labeled training data, a Naive
Bayes classifier can be built. Since the Naive
Bayes classifier can label all unlabeled documents
for their category, we can finally obtain labeled
training data (machine-labeled data).
When the machine-labeled data is used to learn a
text classifier, there is another difficult in that they
have more incorrectly labeled documents than
manually labeled data. Thus we develop and
employ the TCFP classifiers with robustness from
noisy data.
The rest of this paper is organized as follows.
Section 2 reviews previous works. In section 3 and
4, we explain the proposed method in detail.
Section 5 is devoted to the analysis of the
empirical results. The final section describes
conclusions and future works.
2 Related Works
In general, related approaches for using unlabeled
data in text categorization have two directions;
One builds classifiers from a combination of
labeled and unlabeled data (Nigam, 2001; Bennett
and Demiriz, 1999), and the other employs
clustering algorithms for text categorization
(Slonim et al., 2002).
Nigam studied an Expected Maximization (EM)
technique for combining labeled and unlabeled
data for text categorization in his dissertation. He
showed that the accuracy of learned text classifiers
can be improved by augmenting a small number of
labeled training data with a large pool of unlabeled
data.
Bennet and Demiriz achieved small
improvements on some UCI data sets using SVM.
It seems that SVMs assume that decision
boundaries lie between classes in low-density
regions of instance space, and the unlabeled
examples help find these areas.
Slonim suggested clustering techniques for
unsupervised document classification. Given a
collection of unlabeled data, he attempted to find
clusters that are highly correlated with the true
topics of documents by unsupervised clustering
methods. In his paper, Slonim proposed a new
clustering method, the sequential Information
Bottleneck (sIB) algorithm.
3 The Bootstrapping Algorithm for Creating
Machine-labeled Data
The bootstrapping framework described in this
paper consists of the following steps. Each module
is described in the following sections in detail.
1. Preprocessing: Contexts are separated from
unlabeled documents and content words are
extracted from them.
2. Constructing context-clusters for training:
- Keywords of each category are created
- Centroid-contexts are extracted and verified
- Context-clusters are created by a similarity
measure
3. Learning Classifier: Naive Bayes classifier are
learned by using the context-clusters
3.1 Preprocessing
The preprocessing module has two main roles:
extracting content words and reconstructing the
collected documents into contexts. We use the Brill
POS tagger to extract content words (Brill, 1995).
Generally, the supervised learning approach with
labeled data regards a document as a unit of
meaning. But since we can use only the title words
and unlabeled data, we define context as a unit of
meaning and we employ it as the meaning unit to
bootstrap the meaning of each category. In our
system, we regard a sequence of 60 content words
within a document as a context. To extract contexts
from a document, we use sliding window
techniques (Maarek et al., 1991). The window is a
slide from the first word of the document to the last
in the size of the window (60 words) and the
interval of each window (30 words). Therefore, the
final output of preprocessing is a set of context
vectors that are represented as content words of
each context.
3.2 Constructing Context-Clusters for
Training
At first, we automatically create keywords from a
title word for each category using co-occurrence
information. Then centroid-contexts are extracted
using the title word and keywords. They contain at
least one of the title and keywords. Finally, we can
gain more information of each category by
assigning remaining contexts to each context-
cluster using a similarity measure technique; the
remaining contexts do not contain any keywords or
title words.
3.2.1 Creating Keyword Lists
The starting point of our method is that we have
title words and collected documents. A title word
can present the main meaning of each category but
it could be insufficient in representing any
category for text categorization. Thus we need to
find words that are semantically related to a title
word, and we define them as keywords of each
category.
The score of semantic similarity between a title
word, T, and a word, W, is calculated by the cosine
metric as follows:
∑∑
∑
==
=
×
×
=
n
i
i
n
i
i
n
i
ii
wt
wt
WTsim
1
2
1
2
1
),(
(1)
where t
i
and w
i
represent the occurrence (binary
value: 0 or 1) of words T and W in i-th document
respectively, and n is the total number of
documents in the collected documents. This
method calculates the similarity score between
words based on the degree of their co-occurrence
in the same document.
Since the keywords for text categorization must
have the power to discriminate categories as well
as similarity with the title words, we assign a word
to the keyword list of a category with the
maximum similarity score and recalculate the score
of the word in the category using the following
formula:
)),(),((),(),(
maxsecmaxmaxmax
WTsimWTsimWTsimcWScore
ond
−+=
(2)
where T
max
is the title word with the maximum
similarity score with a word W, c
max
is the category
of the title word T
max
, and T
secondmax
is other title
word with the second high similarity score with the
word W.
This formula means that a word with high
ranking in a category has a high similarity score
with the title word of the category and a high
similarity score difference with other title words.
We sort out words assigned to each category
according to the calculated score in descending
order. We then choose top m words as keywords in
the category. Table 1 shows the list of keywords
(top 5) for each category in the WebKB data set.
Table 1. The list of keywords in the WebKB data set
Category Title Word Keywords
course course
assignments, hours, instructor,
class, fall
faculty professor
associate, ph.d, fax, interests,
publications
project project
system, systems, research,
software, information
student student
graduate, computer, science,
page, university
3.2.2 Extracting and Verifying Centroid-Contexts
We choose contexts with a keyword or a title word
of a category as centroid-contexts. Among
centroid-contexts, some contexts could not have
good features of a category even though they
include the keywords of the category. To rank the
importance of centroid-contexts, we compute the
importance score of each centroid-context. First of
all, weights (W
ij
) of word w
i
in j-th category are
calculated using Term Frequency (TF) within a
category and Inverse Category Frequency (ICF)
(Cho and Kim, 1997) as follows:
))log()(log(
iijiijij
CFMTFICFTFW −×
=
×
=
(3)
where CF
i
is the number of categories that contain
w
i
and M is the total number of categories.
Using word weights (W
ij
) calculated by formula
3, the score of a centroid-context (S
k
) in j-th
category (c
j
) is computed as follows:
N
WWW
cSScore
Njjj
jk
+++
=
),(
21
(4)
where N is the number of words in the centroid-
context.
As a result, we obtain a set of words in first-
order co-occurrence from centroid-contexts of each
category.
3.2.3 Creating Context-Clusters
We gather the second-order co-occurrence
information by assigning remaining contexts to the
context-cluster of each category. For the assigning
criterion, we calculate similarity between
remaining contexts and centroid-contexts of each
category. Thus we employ the similarity measure
technique by Karov and Edelman (1998). In our
method, a part of this technique is reformed for our
purpose and remaining contexts are assigned to
each context-cluster by that revised technique.
1) Measurement of word and context similarities
As similar words tend to appear in similar contexts,
we can compute the similarity by using contextual
information. Words and contexts play
complementary roles. Contexts are similar to the
extent that they contain similar words, and words
are similar to the extent that they appear in similar
contexts (Karov and Edelman, 1998). This
definition is circular. Thus it is applied iteratively
using two matrices, WSM and CSM.
Each category has a word similarity matrix
WSM
n
and a context similarity matrix CSM
n
. In
each iteration n, we update WSM
n
, whose rows and
columns are labeled by all content words
encountered in the centroid-contexts of each
category and input remaining contexts. In that
matrix, the cell (i,j) holds a value between 0 and 1,
indicating the extent to which the i-th word is
contextually similar to the j-th word. Also, we keep
and update a CSM
n
, which holds similarities
among contexts. The rows of CSM
n
correspond to
the remaining contexts and the columns to the
centroid-contexts. In this paper, the number of
input contexts of row and column in CSM is
limited to 200, considering execution time and
memory allocation, and the number of iterations is
set as 3.
To compute the similarities, we initialize WSM
n
to the identity matrix. The following steps are
iterated until the changes in the similarity values
are small enough.
1. Update the context similarity matrix CSM
n
,
using the word similarity matrix WSM
n
.
2. Update the word similarity matrix WSM
n
, using the
context similarity matrix CSM
n
.
2) Affinity formulae
To simplify the symmetric iterative treatment of
similarity between words and contexts, we define
an auxiliary relation between words and contexts
as affinity.
Affinity formulae are defined as follows (Karov
and Edelman, 1998):
),(max),(
inXWn
WWsimXWaff
i
∈
=
(5)
(6)
),(max),(
jnXWn
XXsimWXaff
j
∈
=
In the above formulae, n denotes the iteration
number, and the similarity values are defined by
WSM
n
and CSM
n
. Every word has some affinity to
the context, and the context can be represented by
a vector indicating the affinity of each word to it.
3) Similarity formulae
The similarity of W
1
to W
2
is the average affinity of
the contexts that include W
1
to W
2
, and the
similarity of a context X
1
to X
2
is a weighted
average of the affinity of the words in X
1
to X
2
.
Similarity formulae are defined as follows:
),(),(),(
21211
1
XWaffXWweightXXsim
n
XW
n
⋅=
∑
∈
+
(7)
(8)
),(),(),(
1),(
21211
211
21
1
WXaffWXweightWWsim
else
WWsim
WWif
n
XW
n
n
⋅=
=
=
∑
∈
+
+
The weights in formula 7 are computed as
reflecting global frequency, log-likelihood factors,
and part of speech as used in (Karov and Edelman,
1998). The sum of weights in formula 8, which is a
reciprocal number of contexts that contain W
1
, is 1.
4) Assigning remaining contexts to a category
We decided a similarity value of each remaining
context for each category using the following
method:
),(),(
=
∈∈
j
CCS
i
Cc
SXsimavercXsim
i
cji
(9)
In formula 9, i) X is a remaining context, ii)
{
}
m
cccC , ,,
21
= is a category set, and iii)
{
}
nc
SS
i
, ,
1
=CC
is
a controid-contexts set of category c
i
.
Each remaining context is assigned to a category
which has a maximum similarity value. But there
may exist noisy remaining contexts which do not
belong to any category. To remove these noisy
remaining contexts, we set up a dropping threshold
using normal distribution of similarity values as
follows (Ko and Seo, 2000):
} ),( max{
Cc
i
θσµ
+≥
∈
i
cXsim
(10)
where i) X is a remaining context, ii)
µ
is an
average of similarity values
, iii)
σ
is a
standard deviation of similarity values, and iv)
θ
is
a numerical value corresponding to the threshold
(%) in normal distribution table.
),(
i
Cc
cXsim
i
∈
Finally, a remaining context is assigned to the
context-cluster of any category when the category
has a maximum similarity above the dropping
threshold value. In this paper, we empirically use a
15% threshold value from an experiment using a
validation set.
3.3 Learning the Naive Bayes Classifier Using
Context-Clusters
In above section, we obtained labeled training data:
context-clusters. Since training data are labeled as
the context unit, we employ a Naive Bayes
classifier because it can be built by estimating the
word probability in a category, but not in a
document. That is, the Naive Bayes classifier does
not require labeled data with the unit of documents
unlike other classifiers.
We use the Naive Bayes classifier with minor
modifications based on Kullback-Leibler
Divergence (Craven et al., 2000). We classify a
document d
i
according to the following formula:
∑
∏
=
=
+∝
≈=
||
1
||
1
),(
)
ˆ
;|(
)
ˆ
;|(
log)
ˆ
;|(
)
ˆ
;(log
)
ˆ
;|()
ˆ
|(
)
ˆ
|(
)
ˆ
;|()
ˆ
|(
)
ˆ
;|(
V
t
it
jt
it
j
V
t
dwN
jtj
i
jij
ij
dwP
cwP
dwP
n
cP
cwPcP
dP
cdPcP
dcP
i
θ
θ
θ
θ
θθ
θ
θθ
θ
(11)
where i) n is the number of words in document d
i
,
ii) w
t
is the t-th word in the vocabulary, iii) N(w
t
,d
i
)
is the frequency of word w
t
in document d
i
.
Here, the Laplace smoothing is used to estimate
the probability of word w
t
in class c
j
and the
probability of class c
j
as follows:
∑
=
+
+
=
||
1
),(||
),(1
)
ˆ
;|(
V
t
ct
ct
jt
j
j
GwNV
GwN
cwP
θ
(12)
∑
+
+
=
i
i
j
c
c
c
j
GC
G
cP
||||
||1
)
ˆ
|(
θ
(13)
where
is the count of the number of times
word w
),(
j
ct
GwN
t
occurs in the context-cluster ( ) of
category c
j
c
G
j
.
4 Using a Feature Projection Technique for
Handling Noisy Data of Machine-labeled
Data
We finally obtained labeled data of a documents
unit, machine-labeled data. Now we can learn text
classifiers using them. But since the machine-
labeled data are created by our method, they
generally include far more incorrectly labeled
documents than the human-labeled data. Thus we
employ a feature projection technique for our
method. By the property of the feature projection
technique, a classifier (the TCFP classifier) can
have robustness from noisy data (Ko and Seo,
2004). As seen in our experiment results, TCFP
showed the highest performance among
conventional classifiers in using machine-labeled
data.
The TCFP classifier with robustness from noisy
data
Here, we simply describe the TCFP classifier using
the feature projection technique (Ko and Seo,
2002; 2004). In this approach, the classification
knowledge is represented as sets of projections of
training data on each feature dimension. The
classification of a test document is based on the
voting of each feature of that test document. That
is, the final prediction score is calculated by
accumulating the voting scores of all features.
First of all, we must calculate the voting ratio of
each category for all features. Since elements with
a high TF-IDF value in projections of a feature
must become more useful classification criteria for
the feature, we use only elements with TF-IDF
values above the average TF-IDF value for voting.
And the selected elements participate in
proportional voting with the same importance as
the TF-IDF value of each element. The voting ratio
of each category c
j
in a feature t
m
is calculated by
the following formula:
∑∑
∈∈
⋅=
mmmm
jj
Ilt
lm
Ilt
mlmm
dtwltcydtwtcr
)()(
),())(,(),(),(
rr
(14)
In formula 14,
w ),( dt
m
r
is the weight of term t
m
in
document d
, I
m
denotes a set of elements selected
for voting and
is a function; if the
category for an element
t is equal to c , the
output value is 1. Otherwise, the output value is 0.
{}
1.0∈
)(l
m
))(,( ltcy
mj
j
Next, since each feature separately votes on
feature projections, contextual information is
missing. Thus we calculate co-occurrence
frequency of features in the training data and
modify TF-IDF values of two terms t
i
and t
j
in a
test document by co-occurrence frequency between
them; terms with a high co-occurrence frequency
value have higher term weights.
Finally, the voting score of each category
c in
the m-th feature t
j
m
of a test document d is
calculated by the following formula:
))(1log(),(),(),(
2
mmmm
ttcrdttwtcvs
jj
χ
+⋅⋅=
r
(15)
where tw(t
m
,d) denotes a modified term weight by
the co-occurrence frequency and
denotes
the calculated
χ
)(
2
m
t
χ
m
2
statistics value of . t
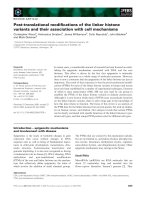
Table 2. The top micro-avg F1 scores and precision-recall breakeven points of each method.
OurMethod
(basis)
OurMethod
(NB)
OurMethod
(Rocchio)
OurMethod
(kNN)
OurMethod
(SVM)
OurMethod
(TCFP)
Newsgroups
79.36
83.46 83 79.95 82.49
86.19
WebKB
73.63
73.22 75.28 68.04 73.74
75.47
Reuters
88.62
88.23 86.26 85.65 87.41
89.09
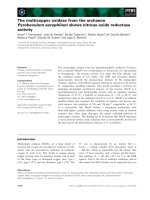
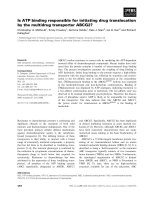
The outline of the TCFP classifier is as follow:
5 Empirical Evaluation
5.1 Data Sets and Experimental Settings
To test our method, we used three different kinds
of data sets: UseNet newsgroups (20 Newsgroups),
web pages (WebKB), and newswire articles
(Reuters 21578). For fair evaluation in
Newsgroups and WebKB, we employed the five-
fold cross-validation method.
The
Newsgroups data set, collected by Ken
Lang, contains about 20,000 articles evenly
divided among 20 UseNet discussion groups
(McCallum and Nigam, 1998). In this paper, we
used only 16 categories after removing 4
categories: three miscellaneous categories
(talk.politics.misc, talk.religion.misc, and
comp.os.ms-windows.misc) and one duplicate
meaning
category (comp.sys. ibm.pc.hardware).
The second data set comes from the
WebKB
project at CMU (Craven et al., 2000). This data set
contains web pages gathered from university
computer science departments.
The
Reuters 21578 Distribution 1.0 data set
consists of 12,902 articles and 90 topic categories
from the Reuters newswire. Like other study in
(Nigam, 2001), we used the ten most populous
categories to identify the news topic.
About 25% documents from training data of
each data set are selected for a validation set. We
applied a statistical feature selection method (
χ
2
statistics) to a preprocessing stage for each
classifier (Yang and Pedersen, 1997).
As performance measures, we followed the
standard definition of recall, precision, and F
1
measure. For evaluation performance average
across categories, we used the micro-averaging
method (Yang et al., 2002). Results on Reuters are
reported as precision-recall breakeven points,
which is a standard information retrieval measure
for binary classification (Joachims, 1998).
1. input : test document: d
r
=<t
1
,t
2
,…,t
n
>
2. main process
For each feature t
i
tw(t
i
,d) is calculated
For each feature t
i
For each category c
j
vote[c
j
]=vote[c
j
]+vs(c
j
,t
i
) by Formula 15
prediction =
][maxarg
j
c
cvote
j
Title words in our experiment are selected
according to category names of each data set (see
Table 1 as an example).
5.2 Experimental Results
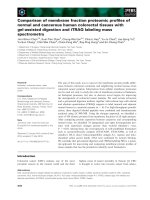
5.2.1 Observing the Performance According to
the Number of Keywords
First of all, we determine the number of keywords
in our method using the validation set. The
number of keywords is limited by the top m-th
keyword from the ordered list of each category.
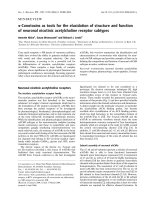
Figure 1 displays the performance at different
number of keywords (from 0 to 20) in each data set.
40
45
50
55
60
65
70
75
80
85
01234581013151820
The number of keywords
Micro-avg. F1
Newsgroups WebKB Reuters
Figure 1. The comparison of performance according to
the number of keywords
We set the number of keywords to 2 in
Newsgroups, 5 in WebKB, and 3 in Reuters
empirically. Generally, we recommend that the
number of keywords be between 2 and 5.
5.2.2 Comparing our Method Using TCFP with
those Using other Classifiers
In this section, we prove the superiority of TCFP
over the other classifiers (SVM, kNN, Naive Bayes
(NB), Roccio) in training data with much noisy
data such as machine-labeled data. As shown in
Table 2, we obtained the best performance in using
TCFP at all three data sets.
Let us define the notations. OurMethod(basis)
denotes the Naive Bayes classifier using labeled
contexts and OurMethod(NB) denotes the Naive
Bayes classifier using machine-labeled data as
training data. The same manner is applied for other
classifiers.
OurMethod(TCFP) achieved more advanced
scores than OurMethod(basis): 6.83 in
Newsgroups, 1.84 in WebKB, and 0.47 in Reuters.
5.2.3 Comparing with the Supervised Naive
Bayes Classifier
For this experiment, we consider two possible
cases for labeling task. The first task is to label a
part of collected documents and the second is to
label all of them. As the first task, we built up a
new training data set; it consists of 500 different
documents randomly chosen from appropriate
categories like the experiment in (Slonim et al.,
2002). As a result, we report performances from
two kinds of Naive Bayes classifiers which are
learned from 500 training documents and the
whole training documents respectively.
Table 3. The comparison of our method and the
supervised NB classifier
OurMethod
(TCFP)
NB
(500)
NB
(All)
Newsgroups 86.19 72.68 91.72
WebKB 75.47 74.1 85.29
Reuters 89.09 82.1 91.64
In Table 3, the results of our method are higher
than those of NB(500) and are comparable to those
of NB(All) in all data sets. Especially, the result in
Reuters reached 2.55 close to that of NB(All)
though it used the whole labeled training data.
5.2.4 Enhancing our Method from Choosing
Keywords by Human
The main problem of our method is that the
performance depends on the quality of the
keywords and title words. As we have seen in
Table 3, we obtained the worst performance in the
WebKB data set. In fact, title words and keywords
of each category in the WebKB data set also have
high frequency in other categories. We think these
factors contribute to a comparatively poor
performance of our method. If keywords as well as
title words are supplied by humans, our method
may achieve higher performance. However,
choosing the proper keywords for each category is
a much difficult task. Moreover, keywords from
developers, who have insufficient knowledge about
an application domain, do not guarantee high
performance. In order to overcome this problem,
we propose a hybrid method for choosing
keywords. That is, a developer obtains 10
candidate keywords from our keyword extraction
method and then they can choose proper keywords
from them. Table 4 shows the results from three
data sets.
Table 4. The comparison of our method and enhancing
method
OurMethod
(TCFP)
Enhancing
(TCFP))
Improvement
Newsgroups 86.19 86.23
+0.04
WebKB 75.47 77.59
+2.12
Reuters 89.09 89.52
+0.43
As shown in Table 4, especially we could achieve
significant improvement in the WebKb data set.
Thus we find that the new method for choosing
keywords is more useful in a domain with
confused keywords between categories such as the
WebKB data set.
5.2.5 Comparing with a Clustering Technique
In related works, we presented two approaches
using unlabeled data in text categorization; one
approach combines unlabeled data and labeled data,
and the other approach uses the clustering
technique for text categorization. Since our method
does not use any labeled data, it cannot be fairly
compared with the former approaches. Therefore,
we compare our method with a clustering
technique. Slonim et al. (2002) proposed a new
clustering algorithm (
sIB) for unsupervised
document classification and verified the superiority
of his algorithm. In his experiments, the
sIB
algorithm was superior to other clustering
algorithms. As we set the same experimental
settings as in Slonim’s experiments and conduct
experiments, we verify that our method
outperforms ths
sIB algorithm. In our experiments,
we used the micro-averaging precision as
performance measure and two revised data sets:
revised_NG, revised_Reuters. These data sets were
revised in the same way according to Slonim’s
paper as follows:
In revised_NG, the categories of Newsgroups were
united with respect to 10 meta-categories: five comp
categories, three politics categories, two sports
categories, three religions categories, and two
transportation categories into five big meta-
categories.
The revised_Reuters used the 10 most frequent
categories in the Reuters 21578 corpus under the
ModApte split.
As shown in Table 5, our method shows 6.65
advanced score in revised_NG and 3.2 advanced
score in revised_Reuters.
Table 5. The comparison of our method and sIB
sIB
OurMethod
(TCFP)
Improvement
revised_NG 79.5 86.15
+6.65
revised_Reuters 85.8 89
+3.2
6 Conclusions and Future Works
This paper has addressed a new unsupervised or
semi-unsupervised text categorization method.
Though our method uses only title words and
unlabeled data, it shows reasonably comparable
performance in comparison with that of the
supervised Naive Bayes classifier. Moreover, it
outperforms a clustering method,
sIB. Labeled data
are expensive while unlabeled data are inexpensive
and plentiful. Therefore, our method is useful for
low-cost text categorization. Furthermore, if some
text categorization tasks require high accuracy, our
method can be used as an assistant tool for easily
creating labeled training data.
Since our method depends on title words and
keywords, we need additional studies about the
characteristics of candidate words for title words
and keywords according to each data set.
Acknowledgement
This work was supported by grant No. R01-2003-
000-11588-0 from the basic Research Program of
the KOSEF
References
K. Bennett and A. Demiriz, 1999, Semi-supervised
Support Vector Machines, Advances in Neural
Information Processing Systems 11, pp. 368-374.
E. Brill, 1995, Transformation-Based Error-driven
Learning and Natural Language Processing: A Case
Study in Part of Speech Tagging, Computational
Linguistics, Vol.21, No. 4.
K. Cho and J. Kim, 1997, Automatic Text
Categorization on Hierarchical Category Structure by
using ICF (Inverse Category Frequency) Weighting,
In Proc. of KISS conference, pp. 507-510.
M. Craven, D. DiPasquo, D. Freitag, A. McCallum, T.
Mitchell, K. Nigam, and S. Slattery, 2000, Learning
to construct knowledge bases from the World Wide
Web, Artificial Intelligence, 118(1-2), pp. 69-113.
T. Joachims, 1998, Text Categorization with Support
Vector Machines: Learning with Many Relevant
Features. In Proc. of ECML, pp. 137-142.
Y. Karov and S. Edelman, 1998, Similarity-based Word
Sense Disambiguation, Computational Linguistics,
Vol. 24, No. 1, pp. 41-60.
Y. Ko and J. Seo, 2000, Automatic Text Categorization
by Unsupervised Learning, In Proc. of
COLING’2000, pp. 453-459.
Y. Ko and J. Seo, 2002, Text Categorization using
Feature Projections, In Proc. of COLING’2002, pp.
467-473.
Y. Ko and J. Seo, 2004, Using the Feature Projection
Technique based on the Normalized Voting Method
for Text Classification, Information Processing and
Management, Vol. 40, No. 2, pp. 191-208.
D.D. Lewis, R.E. Schapire, J.P. Callan, and R. Papka,
1996, Training Algorithms for Linear Text
Classifiers. In Proc. of SIGIR’96, pp.289-297.
Y. Maarek, D. Berry, and G. Kaiser, 1991, An
Information Retrieval Approach for Automatically
Construction Software Libraries, IEEE Transaction
on Software Engineering, Vol. 17, No. 8, pp. 800-
813.
A. McCallum and K. Nigam, 1998, A Comparison of
Event Models for Naive Bayes Text Classification.
AAAI ’98 workshop on Learning for Text
Categorization, pp. 41-48.
K. P. Nigam, A. McCallum, S. Thrun, and T. Mitchell,
1998, Learning to Classify Text from Labeled and
Unlabeled Documents, In Proc. of AAAI-98.
K. P. Nigam, 2001, Using Unlabeled Data to Improve
Text Classification, The dissertation for the degree of
Doctor of Philosophy.
N. Slonim, N. Friedman, and N. Tishby, 2002,
Unsupervised Document Classification using
Sequential Information Maximization, In Proc. of
SIGIR’02, pp. 129-136.
Y. Yang and J. P. Pedersen. 1997, Feature selection in
statistical leaning of text categorization. In Proc. of
ICML’97, pp. 412-420.
Y. Yang, S. Slattery, and R. Ghani. 2002, A study of
approaches to hypertext categorization, Journal of
Intelligent Information Systems, Vol. 18, No. 2.