Tài liệu Báo cáo khoa học: "Evaluation challenges in large-scale document summarization" doc
Bạn đang xem bản rút gọn của tài liệu. Xem và tải ngay bản đầy đủ của tài liệu tại đây (89.69 KB, 8 trang )
Evaluation challenges in large-scale document summarization
Dragomir R. Radev
U. of Michigan
Wai Lam
Chinese U. of Hong Kong
Arda C¸ elebi
USC/ISI
Simone Teufel
U. of Cambridge
John Blitzer
U. of Pennsylvania
Danyu Liu
U. of Alabama
Horacio Saggion
U. of Sheffield
Hong Qi
U. of Michigan
Elliott Drabek
Johns Hopkins U.
Abstract
We present a large-scale meta evaluation
of eight evaluation measures for both
single-document and multi-document
summarizers. To this end we built a
corpus consisting of (a) 100 Million auto-
matic summaries using six summarizers
and baselines at ten summary lengths in
both English and Chinese, (b) more than
10,000 manual abstracts and extracts, and
(c) 200 Million automatic document and
summary retrievals using 20 queries. We
present both qualitative and quantitative
results showing the strengths and draw-
backs of all evaluation methods and how
they rank the different summarizers.
1 Introduction
Automatic document summarization is a field that
has seen increasing attention from the NLP commu-
nity in recent years. In part, this is because sum-
marization incorporates many important aspects of
both natural language understanding and natural lan-
guage generation. In part it is because effective auto-
matic summarization would be useful in a variety of
areas. Unfortunately, evaluating automatic summa-
rization in a standard and inexpensive way is a diffi-
cult task (Mani et al., 2001). Traditional large-scale
evaluations are either too simplistic (using measures
like precision, recall, and percent agreement which
(1) don’t take chance agreement into account and (2)
don’t account for the fact that human judges don’t
agree which sentences should be in a summary) or
too expensive (an approach using manual judge-
ments can scale up to a few hundred summaries but
not to tens or hundreds of thousands).
In this paper, we present a comparison of six
summarizers as well as a meta-evaluation including
eight measures: Precision/Recall, Percent Agree-
ment, Kappa, Relative Utility, Relevance Correla-
tion, and three types of Content-Based measures
(cosine, longest common subsequence, and word
overlap). We found that while all measures tend
to rank summarizers in different orders, measures
like Kappa, Relative Utility, Relevance Correlation
and Content-Based each offer significant advantages
over the more simplistic methods.
2 Data, Annotation, and Experimental
Design
We performed our experiments on the Hong Kong
News corpus provided by the Hong Kong SAR of
the People’s Republic of China (LDC catalog num-
ber LDC2000T46). It contains 18,146 pairs of par-
allel documents in English and Chinese. The texts
are not typical news articles. The Hong Kong News-
paper mainly publishes announcements of the local
administration and descriptions of municipal events,
such as an anniversary of the fire department, or sea-
sonal festivals. We tokenized the corpus to iden-
tify headlines and sentence boundaries. For the En-
glish text, we used a lemmatizer for nouns and verbs.
We also segmented the Chinese documents using the
tool provided at .
Several steps of the meta evaluation that we per-
formed involved human annotator support. First, we
Cluster 2 Meetings with foreign leaders
Cluster 46 Improving Employment Opportunities
Cluster 54 Illegal immigrants
Cluster 60 Customs staff doing good job.
Cluster 61 Permits for charitable fund raising
Cluster 62 Y2K readiness
Cluster 112 Autumn and sports carnivals
Cluster 125 Narcotics Rehabilitation
Cluster 199 Intellectual Property Rights
Cluster 241 Fire safety, building management concerns
Cluster 323 Battle against disc piracy
Cluster 398 Flu results in Health Controls
Cluster 447 Housing (Amendment) Bill Brings Assorted Improvements
Cluster 551 Natural disaster victims aided
Cluster 827 Health education for youngsters
Cluster 885 Customs combats contraband/dutiable cigarette operations
Cluster 883 Public health concerns cause food-business closings
Cluster 1014 Traffic Safety Enforcement
Cluster 1018 Flower shows
Cluster 1197 Museums: exhibits/hours
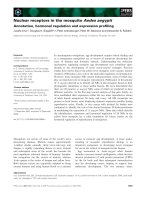
Figure 1: Twenty queries created by the LDC for
this experiment.
asked LDC to build a set of queries (Figure 1). Each
of these queries produced a cluster of relevant doc-
uments. Twenty of these clusters were used in the
experiments in this paper.
Additionally, we needed manual summariesor ex-
tracts for reference. The LDC annotators produced
summaries for each document in all clusters. In or-
der to produce human extracts, our judges also la-
beled sentences with “relevance judgements”, which
indicate the relevance of sentence to the topic of the
document. The relevance judgements for sentences
range from 0 (irrelevant) to 10 (essential). As in
(Radev et al., 2000), in order to create an extract of
a certain length, we simply extract the top scoring
sentences that add up to that length.
For each target summary length, we produce an
extract using a summarizer or baseline. Then we
compare the output of the summarizer or baseline
with the extract produced from the human relevance
judgements. Both the summarizers and the evalua-
tion measures are described in greater detail in the
next two sections.
2.1 Summarizers and baselines
This section briefly describes the summarizers we
used inthe evaluation. All summarizers take asinput
a target length (n%) and a document (or cluster) split
into sentences. Their output is an n% extract of the
document (or cluster).
• MEAD (Radev et al., 2000): MEAD is
a centroid-based extractive summarizer that
scores sentences based on sentence-level and
inter-sentence features which indicate the qual-
ity of the sentence as a summary sentence. It
then chooses the top-ranked sentences for in-
clusion in the output summary. MEAD runs on
both English documents and on BIG5-encoded
Chinese. We tested the summarizer in both lan-
guages.
• WEBS (Websumm (Mani and Bloedorn,
2000)): can be used to produce generic and
query-based summaries. Websumm uses a
graph-connectivity model and operates under
the assumption that nodes which are connected
to many other nodes are likely to carry salient
information.
• SUMM (Summarist (Hovy and Lin, 1999)):
an extractive summarizer based on topic signa-
tures.
• ALGN (alignment-based): We ran a sentence
alignment algorithm (Gale and Church, 1993)
for each pair of English and Chinese stories.
We used it to automatically generate Chinese
“manual” extracts from the English manual ex-
tracts we received from LDC.
• LEAD (lead-based): n% sentences are chosen
from the beginning of the text.
• RAND (random): n% sentences are chosen at
random.
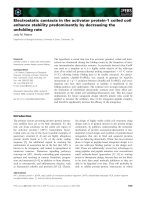
The six summarizers were run at ten different tar-
get lengths to produce more than 100 million sum-
maries (Figure 2). For the purpose of this paper, we
only focus on a small portion of the possible experi-
ments that our corpus can facilitate.
3 Summary Evaluation Techniques
We used three general types of evaluation measures:
co-selection, content-based similarity, and relevance
correlation. Co-selection measures include preci-
sion and recall of co-selected sentences, relative util-
ity (Radev et al., 2000), and Kappa (Siegel and
Castellan, 1988; Carletta, 1996). Co-selection meth-
ods have some restrictions: they only work for ex-
tractive summarizers. Two manual summaries of the
same input do not in general share many identical
sentences. We address this weakness of co-selection
Lengths #dj
05W 05S 10W 10S 20W 20S 30W 30S 40W 40S FD
E-FD - - - - - - - - - - x 40
E-LD X X X X x x X X X X - 440
E-RA X X X X x x X X X X - 440
E-MO x x X x x x X x X x - 540
E-M2 - - - - - X - - - - - 20
E-M3 - - - - - X - - - - - 8
E-S2 - - - - - X - - - - - 8
E-WS - X - X x x - X - X - 160
E-WQ - - - - - X - - - - - 10
E-LC - - - - - - x - - - - 40
E-CY - X - X - x - X - X - 120
E-AL X X X X X X X X X X - 200
E-AR X X X X X X X X X X - 200
E-AM X X X X X X X X X X - 200
C-FD - - - - - - - - - - x 40
C-LD X X X X x x X X X X - 240
C-RA X X X X x x X X X X - 240
C-MO X x X x x x X x X x - 320
C-M2 - - - - - X - - - - - 20
C-CY - X - X - x - X - X - 120
C-AL X X X X X X X X X X - 180
C-AR X X X X X X X X X X - 200
C-AM - X X X X X X X X - 120
X-FD - - - - - - - - - - x 40
X-LD X X X X x x X X X X - 240
X-RA X X X X x x X X X X - 240
X-MO X x X x x x X x X x - 320
X-M2 - - - - - X - - - - - 20
X-CY - X - X - x - X - X - 120
X-AL X X X X X X X X X X - 140
X-AR X X X X X X X X X X - 160
X-AM - X X X X X X X - X - 120
Figure 2: All runs performed (X = 20 clusters, x = 10 clusters). Language: E = English, C = Chinese,
X = cross-lingual; Summarizer: LD=LEAD, RA=RAND, WS=WEBS, WQ=WEBS-query based, etc.; S =
sentence-based, W = word-based; #dj = number of “docjudges” (ranked lists of documents and summaries).
Target lengths above 50% are not shown in this table for lack of space. Each run is available using two
different retrieval schemes. We report results using the cross-lingual retrievals in a separate paper.
measures with several content-based similarity mea-
sures. The similarity measures we use are word
overlap, longest common subsequence, and cosine.
One advantage of similarity measures is that they
can compare manual and automatic extracts with
manual abstracts. To our knowledge, no system-
atic experiments about agreement on the task of
summary writing have been performed before. We
use similarity measures to measure interjudge agree-
ment among three judges per topic. We also ap-
ply the measures between human extracts and sum-
maries, which answers the question if human ex-
tracts are more similar to automatic extracts or to
human summaries.
The third group of evaluation measures includes
relevance correlation. It shows the relative perfor-
mance of a summary: how much the performance
of document retrieval decreases when indexing sum-
maries rather than full texts.
Task-based evaluations (e.g., SUMMAC (Mani
et al., 2001), DUC (Harman and Marcu, 2001), or
(Tombros et al., 1998) measure human performance
using the summaries for a certain task (after the
summaries are created). Although they can be a
very effective way of measuring summary quality,
task-based evaluations are prohibitively expensive at
large scales. In this project, we didn’t perform any
task-based evaluations as they would not be appro-
priate at the scale of millions of summaries.
3.1 Evaluation by sentence co-selection
For each document and target length we produce
three extracts from the three different judges, which
we label throughout as J1, J2, and J3.
We used the rates 5%, 10%, 20%, 30%, 40% for
most experiments. For some experiments, we also
consider summaries of 50%, 60%, 70%, 80% and
90% of the original length of the documents. Figure
3 shows some abbreviations for co-selection that we
will use throughout this section.
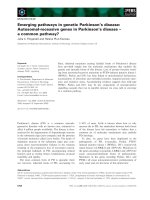
3.1.1 Precision and Recall
Precision and recall are defined as:
P
J
2
(J
1
) =
A
A + C
, R
J
2
(J
1
) =
A
A + B
J
2
Sentence in
Extract
Sentence not
in Extract
Sentence in
Extract
A B A + B
J
1
Sentence not
in Extract
C D C + D
A + C B + D N = A +
B + C + D
Figure 3: Contingency table comparing sentences
extracted by the system and the judges.
In our case, each set of documents which is com-
pared has the same number of sentences and also
the same number of sentences are extracted; thus
P = R.
The average precision P
avg
(SY ST EM ) and re-
call R
avg
(SY ST EM ) are calculated by summing
over individual judges and normalizing. The aver-
age interjudge precision and recall is computed by
averaging over all judge pairs.
However, precision and recall do not take chance
agreement into account. The amount of agreement
one would expect two judges to reach by chance de-
pends on the number and relative proportions of the
categories used by the coders. The next section on
Kappa shows that chance agreement is very high in
extractive summarization.
3.1.2 Kappa
Kappa (Siegel and Castellan, 1988) is an evalua-
tion measure which is increasingly used in NLP an-
notation work (Krippendorff, 1980; Carletta, 1996).
Kappa has the following advantages over P and R:
• It factors out random agreement. Random
agreement is defined as the level of agreement
which would be reached by random annotation
using the same distribution of categories as the
real annotators.
• It allows for comparisons between arbitrary
numbers of annotators and items.
• It treats less frequent categories as more im-
portant (in our case: selected sentences), simi-
larly to precision and recall but it also consid-
ers (with a smaller weight) more frequent cate-
gories as well.
The Kappa coefficient controls agreement P (A)
by taking into account agreement by chance P (E) :
K =
P (A) − P (E)
1 − P (E)
No matter how many items or annotators, or how
the categories are distributed, K = 0 when there is
no agreement other than what would be expected by
chance, and K = 1 when agreement is perfect. If
two annotators agree less than expected by chance,
Kappa can also be negative.
We report Kappa between three annotators in the
case of human agreement, and between three hu-
mans and a system (i.e. four judges) in the next sec-
tion.
3.1.3 Relative Utility
Relative Utility (RU) (Radev et al., 2000) is tested
on a large corpus for the first time in this project.
RU takes into account chance agreement as a lower
bound and interjudge agreement as an upper bound
of performance. RU allows judges and summarizers
to pick different sentences with similar content in
their summaries without penalizing them for doing
so. Each judge is asked to indicate the importance
of each sentence in a cluster on a scale from 0 to
10. Judges also specify which sentences subsume or
paraphrase each other. In relative utility, the score
of an automatic summary increases with the impor-
tance of the sentences that it includes but goes down
with the inclusion of redundant sentences.
3.2 Content-based Similarity measures
Content-based similarity measures compute the sim-
ilarity between two summaries at a more fine-
grained level than just sentences. For each automatic
extract S and similarity measure M we compute the
following number:
sim(M, S, {J1, J2, J3}) =
M(S, J1) + M(S, J2) + M (S, J3)
3
We used several content-based similarity mea-
sures that take into account different properties of
the text:
Cosine similarity is computed using the follow-
ing formula (Salton, 1988):
cos(X, Y ) =
x
i
∗ y
i
(x
i
)
2
∗
(y
i
)
2
where X and Y are text representations based on
the vector space model.
Longest Common Subsequence is computed as
follows:
lcs(X, Y ) = (length(X) + length(Y ) − d(X, Y ))/2
where X and Y are representations based on
sequences and where lcs(X, Y ) is the length of
the longest common subsequence between X and
Y , length(X) is the length of the string X, and
d(X, Y ) is the minimum number of deletion and in-
sertions needed to transform X into Y (Crochemore
and Rytter, 1994).
3.3 Relevance Correlation
Relevance correlation (RC) is a new measure for as-
sessing therelative decrease in retrieval performance
when indexing summaries instead of full documents.
The idea behind it is similar to (Sparck-Jones and
Sakai, 2001). In that experiment, Sparck-Jones and
Sakai determine that short summaries are good sub-
stitutes for full documents at the high precision end.
With RC we attempt to rank all documents given a
query.
Suppose that given a query Q and a corpus of doc-
uments D
i
, a search engine ranks all documents in
D
i
according to their relevance to the query Q. If
instead of the corpus D
i
, the respective summaries
of all documents are substituted for the full docu-
ments and the resulting corpus of summaries S
i
is
ranked by the same retrieval engine for relevance to
the query, a different ranking will be obtained. If
the summaries are good surrogates for the full docu-
ments, then it can be expected that rankings will be
similar.
There exist several methods for measuring the
similarity ofrankings. One such method is Kendall’s
tau and another is Spearman’s rank correlation. Both
methods are quite appropriate for the task that we
want to perform; however, since search engines pro-
duce relevance scores in addition to rankings, we
can use a stronger similarity test, linear correlation
between retrieval scores. When two identical rank-
ings are compared, their correlation is 1. Two com-
pletely independent rankings result in a score of 0
while two rankings that are reverse versions of one
another have a score of -1. Although rank correla-
tion seems to be another valid measure, given the
large number of irrelevant documents per query re-
sulting in a large number of tied ranks, we opted for
linear correlation. Interestingly enough, linear cor-
relation and rank correlation agreed with each other.
Relevance correlation r is defined as the linear
correlation of the relevance scores (x and y) as-
signed by two different IR algorithms on the same
set of documents or by the same IR algorithm on
different data sets:
r =
i
(x
i
− x)(y
i
− y)
i
(x
i
− x)
2
i
(y
i
− y)
2
Here x and y are the means of the relevance scores
for the document sequence.
We preprocess the documents and use Smart to
index and retrieve them. After the retrieval process,
each summary is associated with a score indicating
the relevance of the summary to the query. The
relevance score is actually calculated as the inner
product of the summary vector and the query vec-
tor. Based on the relevance score, we can produce a
full ranking of all the summaries in the corpus.
In contrast to (Brandow et al., 1995) who run 12
Boolean queries on a corpus of 21,000 documents
and compare three types of documents (full docu-
ments, lead extracts, and ANES extracts), we mea-
sure retrieval performance under more than 300 con-
ditions (by language, summary length, retrieval pol-
icy for 8 summarizers or baselines).
4 Results
This section reports results for the summarizers and
baselines described above. We relied directly on the
relevance judgements to create “manual extracts” to
use as gold standards for evaluating the English sys-
tems. To evaluate Chinese, we made use of a ta-
ble of automatically produced alignments. While
the accuracy of the alignments is quite high, we
have not thoroughly measured the errors produced
when mapping target English summaries into Chi-
nese. This will be done in future work.
4.1 Co-selection results
Co-selection agreement (Section 3.1) is reported in
Figures 4, and 5). The tables assume human perfor-
mance is the upper bound, the next rows compare
the different summarizers.
Figure 4 shows results for precision and recall.
We observe the effect of a dependence of the nu-
merical results on the length of the summary, which
is a well-known fact from information retrieval eval-
uations.
Websumm has an advantage over MEAD for
longer summaries but not for 20% or less. Lead
summaries perform better than all the automatic
summarizers, and better than the human judges.
This result usually occurs when the judges choose
different, but early sentences. Human judgements
overtake the lead baseline for summaries of length
50% or more.
5% 10% 20% 30% 40%
Humans .187 .246 .379 .467 .579
MEAD .160 .231 .351 .420 .519
WEBS .310 .305 .358 .439 .543
LEAD .354 .387 .447 .483 .583
RAND .094 .113 .224 .357 .432
Figure 4: Results in precision=recall (averaged over
20 clusters).
Figure 5 shows results using Kappa. Random
agreement is 0 by definition between a random pro-
cess and a non-random process.
While the results are overall rather low, the num-
bers still show the following trends:
• MEAD outperforms Websumm for all but the
5% target length.
• Lead summaries perform best below 20%,
whereas human agreement is higher after that.
• There is a rather large difference between the
two summarizers and the humans (except for
the 5% case for Websumm). This numerical
difference is relatively higher than for any other
co-selection measure treated here.
• Random is overall the worst performer.
• Agreement improves with summary length.
Figures 6 and 7 summarize the results obtained
through Relative Utility. As the figures indicate,
random performance is quite high although all non-
random methods outperform it significantly. Fur-
ther, and in contrast with other co-selection evalua-
tion criteria, in both the single- and multi-document
5% 10% 20% 30% 40%
Humans .127 .157 .194 .225 .274
MEAD .109 .136 .168 .192 .230
WEBS .138 .128 .146 .159 .192
LEAD .180 .198 .213 .220 .261
RAND .064 .081 .097 .116 .137
Figure 5: Results in kappa, averaged over 20 clus-
ters.
case MEAD outperforms LEAD for shorter sum-
maries (5-30%). The lower bound (R) represents the
average performance of all extracts at the given sum-
mary length while the upper bound (J) is the inter-
judge agreement among the three judges.
5% 10% 20% 30% 40%
R 0.66 0.68 0.71 0.74 0.76
RAND 0.67 0.67 0.71 0.75 0.77
WEBS 0.72 0.73 0.76 0.79 0.82
LEAD 0.72 0.73 0.77 0.80 0.83
MEAD 0.78 0.79 0.79 0.81 0.83
J 0.80 0.81 0.83 0.85 0.87
Figure 6: RU per summarizer and summary length
(Single-document).
5% 10% 20% 30% 40%
R 0.64 0.66 0.69 0.72 0.74
RAND 0.63 0.65 0.71 0.72 0.74
LEAD 0.71 0.71 0.76 0.79 0.82
MEAD 0.73 0.75 0.78 0.79 0.81
J 0.76 0.78 0.81 0.83 0.85
Figure 7: RU per summarizer and summary length
(Multi-document).
4.2 Content-based results
The results obtained for a subset of target lengths
using content-based evaluation can be seen in Fig-
ures 8 and 9. In all our experiments with tf ∗ idf-
weighted cosine, the lead-based summarizer ob-
tained results close to the judges in most of the target
lengths while MEAD is ranked in second position.
In all our experiments using longest common sub-
sequence, no system obtained better results in the
majority of the cases.
10% 20% 30% 40%
LEAD 0.55 0.65 0.70 0.79
MEAD 0.46 0.61 0.70 0.78
RAND 0.31 0.47 0.60 0.69
WEBS 0.52 0.60 0.68 0.77
Figure 8: Cosine (tf ∗idf). Average over 10 clusters.
10% 20% 30% 40%
LEAD 0.47 0.55 0.60 0.70
MEAD 0.37 0.52 0.61 0.70
RAND 0.25 0.38 0.50 0.58
WEBS 0.39 0.45 0.53 0.64
Figure 9: Longest Common Subsequence. Average
over 10 clusters.
The numbers obtained in the evaluation of Chi-
nese summaries for cosine and longest common sub-
sequence can be seen in Figures 10 and 11. Both
measures identify MEAD as the summarizer that
produced results closer to the ideal summaries (these
results also were observed across measures and text
representations).
10% 20% 30% 40%
SUMM 0.44 0.65 0.71 0.78
LEAD 0.54 0.63 0.68 0.77
MEAD 0.49 0.65 0.74 0.82
RAND 0.31 0.50 0.65 0.71
Figure 10: Chinese Summaries. Cosine (tf ∗ idf).
Average over 10 clusters. Vector space of Words as
Text Representation.
10% 20% 30% 40%
SUMM 0.32 0.53 0.57 0.65
LEAD 0.42 0.49 0.54 0.64
MEAD 0.35 0.50 0.60 0.70
RAND 0.21 0.35 0.49 0.54
Figure 11: Chinese Summaries. Longest Common
Subsequence. Average over 10 clusters. Chinese
Words as Text Representation.
We have based this evaluation on target sum-
maries produced by LDC assessors, although other
alternatives exist. Content-based similarity mea-
sures do not require the target summary to be a sub-
set of sentences from the source document, thus,
content evaluation based on similarity measures
can be done using summaries published with the
source documents which are in many cases available
(Teufel and Moens, 1997; Saggion, 2000).
4.3 Relevance Correlation results
We present several results using Relevance Correla-
tion. Figures 12 and 13 show how RC changes de-
pending on the summarizer and the language used.
RC is as high as 1.0 when full documents (FD) are
compared to themselves. One can notice that even
random extracts get a relatively high RC score. It is
also worth observing that Chinese summaries score
lower than their corresponding English summaries.
Figure 14 shows the effects of summary length and
summarizers on RC. As one might expect, longer
summaries carry more of the content of the full doc-
ument than shorter ones. At the same time, the rel-
ative performance of the different summarizers re-
mains the same across compression rates.
C112 C125 C241 C323 C551 AVG10
FD 1.00 1.00 1.00 1.00 1.00 1.000
MEAD 0.91 0.92 0.93 0.92 0.90 0.903
WEBS 0.88 0.82 0.89 0.91 0.88 0.843
LEAD 0.80 0.80 0.84 0.85 0.81 0.802
RAND 0.80 0.78 0.87 0.85 0.79 0.800
SUMM 0.77 0.79 0.85 0.88 0.81 0.775
Figure 12: RC per summarizer (English 20%).
C112 C125 C241 C323 C551 AVG10
FD 1.00 1.00 1.00 1.00 1.00 1.000
MEAD 0.78 0.87 0.93 0.66 0.91 0.850
SUMM 0.76 0.75 0.85 0.84 0.75 0.755
RAND 0.71 0.75 0.85 0.60 0.74 0.744
ALGN 0.74 0.72 0.83 0.95 0.72 0.738
LEAD 0.72 0.71 0.83 0.58 0.75 0.733
Figure 13: RC per summarizer (Chinese, 20%).
5% 10% 20% 30% 40%
FD 1.000 1.000 1.000 1.000 1.000
MEAD 0.724 0.834 0.916 0.946 0.962
WEBS 0.730 0.804 0.876 0.912 0.936
LEAD 0.660 0.730 0.820 0.880 0.906
SUMM 0.622 0.710 0.820 0.848 0.862
RAND 0.554 0.708 0.818 0.884 0.922
Figure 14: RC per summary length and summarizer.
5 Conclusion
This paper describes several contributions to text
summarization:
First, we observed that different measures rank
summaries differently, although most of them
showed that “intelligent” summarizers outperform
lead-based summaries which is encouraging given
that previous results had cast doubt on the ability of
summarizers to do better than simple baselines.
Second, we found that measures like Kappa, Rel-
ative Utility, Relevance Correlation and Content-
Based, each offer significant advantages over more
simplistic methods like Precision, Recall, and Per-
cent Agreement with respect to scalability, applica-
bility to multidocument summaries, and ability to
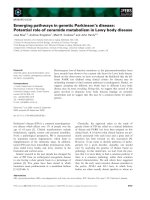
include human and chance agreement. Figure 15
Property Prec, recall Kappa Normalized RU Word overlap, cosine, LCS Relevance Correlation
Intrinsic (I)/extrinsic (E) I I I I E
Agreement between human extracts X X X X X
Agreement human extracts and automatic extracts X X X X X
Agreement human abstracts and human extracts X
Non-binary decisions X X
Takes random agreement into account by design X X
Full documents vs. extracts X X
Systems with different sentence segmentation X X
Multidocument extracts X X X X
Full corpus coverage X X
Figure 15: Properties of evaluation measures used in this project.
presents a short comparison of all these evaluation
measures.
Third, we performed extensive experiments using
a new evaluation measure, Relevance Correlation,
which measures how well a summary can be used
to replace a document for retrieval purposes.
Finally, we have packaged the code used for this
project into a summarization evaluation toolkit and
produced what we believe is the largest and most
complete annotated corpus for further research in
text summarization. The corpusand related software
is slated for release by the LDC in mid 2003.
References
Ron Brandow, Karl Mitze, and Lisa F. Rau. 1995. Auto-
matic Condensation of Electronic Publicationsby Sen-
tence Selection. Information Processing and Manage-
ment, 31(5):675–685.
Jean Carletta. 1996. Assessing Agreement on Classifica-
tion Tasks: The Kappa Statistic. CL, 22(2):249–254.
Maxime Crochemore and Wojciech Rytter. 1994. Text
Algorithms. Oxford University Press.
William A. Gale and Kenneth W. Church. 1993. A
program for aligning sentences in bilingual corpora.
Computational Linguistics, 19(1):75–102.
Donna Harman and Daniel Marcu, editors. 2001. Pro-
ceedings of the 1st Document Understanding Confer-
ence. New Orleans, LA, September.
Eduard Hovy and Chin Yew Lin. 1999. Automated Text
Summarization in SUMMARIST. In Inderjeet Mani
and Mark T. Maybury, editors, Advances in Automatic
Text Summarization, pages 81–94. The MIT Press.
Klaus Krippendorff. 1980. Content Analysis: An Intro-
duction to its Methodology. Sage Publications, Bev-
erly Hills, CA.
Inderjeet Mani and Eric Bloedorn. 2000. Summariz-
ing Similarities and Differences Among Related Doc-
uments. Information Retrieval, 1(1).
Inderjeet Mani, Th
´
er
`
ese Firmin, David House, Gary
Klein, Beth Sundheim, and Lynette Hirschman. 2001.
The TIPSTER SUMMAC Text Summarization Evalu-
ation. In Natural Language Engineering.
Dragomir R. Radev, Hongyan Jing, and Malgorzata
Budzikowska. 2000. Centroid-Based Summarization
of Multiple Documents: Sentence Extraction, Utility-
Based Evaluation, and User Studies. In Proceedings
of the Workshop on Automatic Summarization at the
6th Applied Natural Language Processing Conference
and the 1st Conference of the North American Chap-
ter of the Association for Computational Linguistics,
Seattle, WA, April.
Horacio Saggion. 2000. G
´
en
´
eration automatique
de r
´
esum
´
es par analyse s
´
elective. Ph.D. the-
sis, D
´
epartement d’informatique et de recherche
op
´
erationnelle. Facult
´
e des arts et des sciences. Uni-
versit
´
e de Montr
´
eal, August.
Gerard Salton. 1988. Automatic Text Processing.
Addison-Wesley Publishing Company.
Sidney Siegel and N. John Jr. Castellan. 1988. Non-
parametric Statistics for the Behavioral Sciences.
McGraw-Hill, Berkeley, CA, 2nd edition.
Karen Sparck-Jones and Tetsuya Sakai. 2001. Generic
Summaries for Indexing in IR. In Proceedings of the
24th Annual International ACM SIGIR Conference on
Research and Development in Information Retrieval,
pages 190–198, New Orleans, LA, September.
Simone Teufel and Marc Moens. 1997. Sentence Ex-
traction as a Classification Task. In Proceedings of the
Workshop on Intelligent Scalable Text Summarization
at the 35th Meeting of the Association for Computa-
tional Linguistics, and the 8th Conference of the Eu-
ropean Chapter of the Assocation for Computational
Linguistics, Madrid, Spain.
Anastasios Tombros, Mark Sanderson, and Phil Gray.
1998. Advantages of Query Biased Summaries in In-
formation Retrieval. In Eduard Hovy and Dragomir R.
Radev, editors, Proceedings of the AAAI Symposium
on Intelligent Text Summarization, pages 34–43, Stan-
ford, California, USA, March 23–25,. The AAAI
Press.