Tài liệu Báo cáo khoa học: "Interactive Multi-Document Summarization" docx
Bạn đang xem bản rút gọn của tài liệu. Xem và tải ngay bản đầy đủ của tài liệu tại đây (263.49 KB, 4 trang )
iNeATS: Interactive Multi-Document Summarization
Anton Leuski, Chin-Yew Lin, Eduard Hovy
University of Southern California
Information Sciences Institute
4676 Admiralty Way, Suite 1001
Marina Del Rey, CA 90292-6695
{leuski,cyl,hovy}@isi.edu
Abstract
We describe iNeATS – an interactive
multi-document summarization system
that integrates a state-of-the-art summa-
rization engine with an advanced user in-
terface. Three main goals of the sys-
tem are: (1) provide a user with control
over the summarization process, (2) sup-
port exploration of the document set with
the summary as the staring point, and (3)
combine text summaries with alternative
presentations such as a map-based visual-
ization of documents.
1 Introduction
The goal of a good document summary is to provide
a user with a presentation of the substance of a body
of material in a coherent and concise form. Ideally, a
summary would contain only the “right” amount of
the interesting information and it would omit all the
redundant and “uninteresting” material. The quality
of the summary depends strongly on users’ present
need – a summary that focuses on one of several top-
ics contained in the material may prove to be either
very useful or completely useless depending on what
users’ interests are.
An automatic multi-document summarization
system generally works by extracting relevant sen-
tences from the documents and arranging them in a
coherent order (McKeown et al., 2001; Over, 2001).
The system has to make decisions on the summary’s
size, redundancy, and focus. Any of these deci-
sions may have a significant impact on the quality
of the output. We believe a system that directly in-
volves the user in the summary generation process
and adapts to her input will produce better sum-
maries. Additionally, it has been shown that users
are more satisfied with systems that visualize their
decisions and give the user a sense of control over
the process (Koenemann and Belkin, 1996).
We see three ways in which interactivity and
visualization can be incorporated into the multi-
document summarization process:
1. give the user direct control over the summariza-
tion parameters such as size, redundancy, and
focus of the summaries.
2. support rapid browsing of the document set us-
ing the summary as the starting point and com-
bining the multi-document summary with sum-
maries for individual documents.
3. incorporate alternative formats for organizing
and displaying the summary, e.g., a set of news
stories can be summarized by placing the sto-
ries on a world map based on the locations of
the events described in the stories.
In this paper we describe iNeATS (Interactive
NExt generation Text Summarization) which ad-
dresses these three directions. The iNeATS system
is built on top of the NeATS multi-document sum-
marization system. In the following section we give
a brief overview of the NeATS system and in Sec-
tion 3 describe the interactive version.
2 NeATS
NeATS (Lin and Hovy, 2002) is an extraction-
based multi-document summarization system. It is
among the top two performers in DUC 2001 and
2002 (Over, 2001). It consists of three main com-
ponents:
Content Selection The goal of content selection is
to identify important concepts mentioned in
a document collection. NeATS computes the
likelihood ratio (Dunning, 1993) to identify key
concepts in unigrams, bigrams, and trigrams
and clusters these concepts in order to identify
major subtopics within the main topic. Each
sentence in the document set is then ranked, us-
ing the key concept structures. These n-gram
key concepts are called topic signatures.
Content Filtering NeATS uses three different fil-
ters: sentence position, stigma words, and re-
dundancy filter. Sentence position has been
used as a good important content filter since
the late 60s (Edmundson, 1969). NeATS ap-
plies a simple sentence filter that only retains
the N lead sentences. Some sentences start
with conjunctions, quotation marks, pronouns,
and the verb “say” and its derivatives. These
stigma words usually cause discontinuities in
summaries. The system reduces the scores of
these sentences to demote their ranks and avoid
including them in summaries of small sizes. To
address the redundancy problem, NeATS uses a
simplified version of CMU’s MMR (Goldstein
et al., 1999) algorithm. A sentence is added to
the summary if and only if its content has less
than X percent overlap with the summary.
Content Presentation To ensure coherence of the
summary, NeATS pairs each sentence with an
introduction sentence. It then outputs the final
sentences in their chronological order.
3 Interactive Summarization
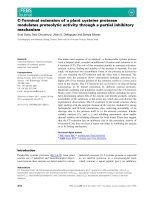
Figure 1 shows a screenshot of the iNeATS system.
We divide the screen into three parts corresponding
to the three directions outlined in Section 1. The
control panel displays the summarization parame-
ters on the left side of the screen. The document
panel shows the document text on the right side. The
summary panel presents the summaries in the mid-
dle of the screen.
3.1 Controlling Summarization Process
The top of the control panel provides the user with
control over the summarization process. The first set
of widgets contains controls for the summary size,
sentence position, and redundancy filters. The sec-
ond row of parameters displays the set of topic sig-
natures identified by the iNeATS engine. The se-
lected subset of the topic signatures defines the con-
tent focus for the summary. If the user enters a new
value for one of the parameters or selects a different
subset of the topic signatures, iNeATS immediately
regenerates and redisplays the summary text in the
top portion of the summary panel.
3.2 Browsing Document Set
iNeATS facilitates browsing of the document set by
providing (1) an overview of the documents, (2)
linking the sentences in the summary to the original
documents, and (3) using sentence zooming to high-
light the most relevant sentences in the documents.
The bottom part of the control panel is occupied
by the document thumbnails. The documents are ar-
ranged in chronological order and each document is
assigned a unique color to paint the text background
for the document. The same color is used to draw
the document thumbnail in the control panel, to fill
up the text background in the document panel, and to
paint the background of those sentences in the sum-
mary that were collected from the document. For
example, the screenshot shows that a user selected
the second document which was assigned the or-
ange color. The document panel displays the doc-
ument text on orange background. iNeATS selected
the first two summary sentences from this document,
so both sentences are shown in the summary panel
with orange background.
The sentences in the summary are linked to the
original documents in two ways. First, the docu-
ment can be identified by the color of the sentence.
Second, each sentence is a hyperlink to the docu-
ment – if the user moves the mouse over a sentence,
the sentence is underlined in the summary and high-
lighted in the document text. For example, the first
sentence of the summary is the document sentence
Figure 1: Screenshot of the iNeATS system.
highlighted in the document panel. If the user clicks
on the sentence, iNeATS brings the source document
into the document panel and scrolls the window to
make the sentence visible.
The relevant parts of the documents are illumi-
nated using the technique that we call sentence
zooming. We make the text color intensity of each
sentence proportional to the relevance score com-
puted by the iNeATS engine and a zooming parame-
ter which can be controlled by the user with a slider
widget at the top of the document panel. The higher
the sentence score, the darker the text is. Conversely,
sentences that blend into the background have a very
low sentence score. The zooming parameter con-
trols the proportion of the top ranked sentences vis-
ible on the screen at each moment. This zooming
affects both the full-text and the thumbnail docu-
ment presentations. Combining the sentence zoom-
ing with the document set overview, the user can
quickly see which document contains most of the
relevant material and where approximately in the
document this material is placed.
The document panel in Figure 1 shows sentences
that achieve 50% on the sentence score scale. We see
that the first half of the document contains two black
sentences: the first sentence that starts with “US In-
surers ”, the other starts with “President George ”.
Both sentences have a very high score and they were
selected for the summary. Note, that the very first
sentence in the document is the headline and it is not
used for summarization. Note also that the sentence
that starts with “However, ” scored much lower
than the selected two – its color is approximately
half diluted into the background.
There are quite a few sentences in the second part
of the document that scored relatively high. How-
ever, these sentences are below the sentence position
cutoff so they do not appear in the summary. We il-
lustrate this by rendering such sentences in slanted
style.
3.3 Alternative Summaries
The bottom part of the summary panel is occupied
by the map-based visualization. We use BBN’s
IdentiFinder (Bikel et al., 1997) to detect the names
of geographic locations in the document set. We
then select the most frequently used location names
and place them on world map. Each location is iden-
tified by a black dot followed by a frequency chart
and the location name. The frequency chart is a bar
chart where each bar corresponds to a document.
The bar is painted using the document color and the
length of the bar is proportional to the number of
times the location name is used in the document.
The document set we used in our example de-
scribes the progress of the hurricane Andrew and its
effect on Florida, Louisiana, and Texas. Note that
the source documents and therefore the bars in the
chart are arranged in the chronological order. The
name “Miami” appears first in the second document,
“New Orleans” in the third document, and “Texas” is
prominent in the last two documents. We can make
some conclusions on the hurricane’s path through
the region – it traveled from south-east and made its
landing somewhere in Louisiana and Texas.
4 Discussion
The iNeATS system is implemented in Java. It uses
the NeATS engine implemented in Perl and C. It
runs on any platform that supports these environ-
ments. We are currently working on making the sys-
tem available on our web site.
We plan to extend the system by adding temporal
visualization that places the documents on a timeline
based on the date and time values extracted from the
text.
We plan to conduct a user-based evaluation of the
system to compare users’ satisfaction with both the
automatically generated summaries and summaries
produced by iNeATS.
References
Daniel M. Bikel, Scott Miller, Richard Schwartz, and
Ralph Weischedel. 1997. Nymble: a high-
performance learning name-finder. In Proceedings of
ANLP-97, pages 194–201.
Ted E. Dunning. 1993. Accurate methods for the statis-
tics of surprise and coincidence. Computational Lin-
guistics, 19(1):61–74.
H. P. Edmundson. 1969. New methods in automatic ex-
traction. Journal of the ACM, 16(2):264–285.
Jade Goldstein, Mark Kantrowitz, Vibhu O. Mittal, and
Jaime G. Carbonell. 1999. Summarizing text docu-
ments: Sentence selection and evaluation metrics. In
Research and Development in Information Retrieval,
pages 121–128.
Jurgen Koenemann and Nicholas J. Belkin. 1996. A case
for interaction: A study of interactive information re-
trieval behavior and effectivness. In Proceedings of
ACM SIGCHI Conference on Human Factors in Com-
puting Systems, pages 205–212, Vancouver, British
Columbia, Canada.
Chin-Yew Lin and Eduard Hovy. 2002. From single
to multi-document summarization: a prototype sys-
tem and it evaluation. In Proceedings of the 40th
Anniversary Meeting of the Association for Computa-
tional Linguistics (ACL-02), Philadelphia, PA, USA.
Kathleen R. McKeown, Regina Barzilay, David Evans,
Vasileios Hatzivassiloglou, Barry Schiffman, and Si-
mone Teufel. 2001. Columbia multi-document sum-
marization: Approach and evaluation. In Proceed-
ings of the Workshop on Text Summarization, ACM SI-
GIR Conference 2001. DARPA/NIST, Document Un-
derstanding Conference.
Paul Over. 2001. Introduction to duc-2001: an intrin-
sic evaluation of generic news text summarization sys-
tems. In Proceedings of the Workshop on Text Summa-
rization, ACM SIGIR Conference 2001. DARPA/NIST,
Document Understanding Conference.