Tài liệu Báo cáo khoa học: "Using Confidence Bands for Parallel Texts Alignment" pptx
Bạn đang xem bản rút gọn của tài liệu. Xem và tải ngay bản đầy đủ của tài liệu tại đây (259.62 KB, 8 trang )
Using Confidence Bands for Parallel Texts Alignment
António RIBEIRO
Departamento de Informática
Faculdade de Ciências e Tecnologia
Universidade Nova de Lisboa
Quinta da Torre
P-2825-114 Monte da Caparica
Portugal
Gabriel LOPES
Departamento de Informática
Faculdade de Ciências e Tecnologia
Universidade Nova de Lisboa
Quinta da Torre
P-2825-114 Monte da Caparica
Portugal
João MEXIA
Departamento de Matemática
Faculdade de Ciências e Tecnologia
Universidade Nova de Lisboa
Quinta da Torre
P-2825-114 Monte da Caparica
Portugal
Abstract
This paper describes a language independent
method for alignment of parallel texts that
makes use of homograph tokens for each
pair of languages. In order to filter out
tokens that may cause misalignment, we use
confidence bands of linear regression lines
instead of heuristics which are not theoreti-
cally supported. This method was originally
inspired on work done by Pascale Fung and
Kathleen McKeown, and Melamed, provid-
ing the statistical support those authors
could not claim.
Introduction
Human compiled bilingual dictionaries do not
cover every term translation, especially when it
comes to technical domains. Moreover, we can
no longer afford to waste human time and effort
building manually these ever changing and in-
complete databases or design language specific
applications to solve this problem. The need for
an automatic language independent task for
equivalents extraction becomes clear in multi-
lingual regions like Hong Kong, Macao,
Quebec, the European Union, where texts must
be translated daily into eleven languages, or
even in the U.S.A. where Spanish and English
speaking communities are intermingled.
Parallel texts
(texts that are mutual transla-
tions) are valuable sources of information for
bilingual lexicography. However, they are not of
much use unless a computational system may
find which piece of text in one language corre-
sponds to which piece of text in the other lan-
guage. In order to achieve this, they must be
aligned
first, i.e. the various pieces of text must
be put into correspondence. This makes the
translations extraction task easier and more reli-
able. Alignment is usually done by finding
correspondence points
– sequences of characters
with the same form in both texts (
homographs
,
e.g. numbers, proper names, punctuation marks),
similar forms (
cognates
, like
Region
and
Região
in English and Portuguese, respectively) or even
previously known translations.
Pascale Fung and Kathleen McKeown (1997)
present an alignment algorithm that uses term
translations as correspondence points between
English and Chinese. Melamed (1999) aligns
texts using correspondence points taken either
from orthographic cognates (Michel Simard
et
al.
, 1992) or from a seed translation lexicon.
However, although the heuristics both ap-
proaches use to filter noisy points may be intui-
tively quite acceptable, they are not theoretically
supported by Statistics.
The former approach considers a candidate
correspondence point reliable as long as, among
some other constraints, “[ ] it is not too far
away from the diagonal [ ]” (Pascale Fung and
Kathleen McKeown, 1997, p.72) of a rectangle
whose sides sizes are proportional to the lengths
of the texts in each language (henceforth, ‘the
golden
translation diagonal’). The latter ap-
proach uses other filtering parameters: maxi-
mum point ambiguity level, point dispersion and
angle deviation (Melamed, 1999, pp. 115–116).
António Ribeiro
et al.
(2000a) propose a
method to filter candidate correspondence points
generated from homograph words which occur
only once in parallel texts (
hapaxes
) using linear
regressions and statistically supported noise
filtering methodologies. The method avoids
heuristic filters and they claim high precision
alignments.
In this paper, we will extend this work by de-
fining a linear regression line with all points
generated from homographs with equal frequen-
cies in parallel texts. We will filter out those
points which lie outside statistically defined
confidence bands (Thomas Wonnacott and
Ronald Wonnacott, 1990). Our method will
repeatedly use a standard linear regression line
adjustment technique to filter unreliable points
until there is no misalignment. Points resulting
from this filtration are chosen as correspondence
points.
The following section will discuss related
work. The method is described in section 2 and
we will evaluate and compare the results in sec-
tion 3. Finally, we present conclusions and fu-
ture work.
1 Background
There have been two mainstreams for parallel
text alignment. One assumes that translated texts
have proportional sizes; the other tries to use
lexical information in parallel texts to generate
candidate correspondence points. Both use some
notion of correspondence points.
Early work by Peter Brown et al. (1991) and
William Gale and Kenneth Church (1991)
aligned sentences which had a proportional
number of words and characters, respectively.
Pairs of sentence delimiters (full stops) were
used as candidate correspondence points and
they ended up being selected while aligning.
However, these algorithms tended to break down
when sentence boundaries were not clearly
marked. Full stops do not always mark sentence
boundaries, they may not even exist due to OCR
noise and languages may not share the same
punctuation policies.
Using lexical information, Kenneth Church
(1993) showed that cheap alignment of text
segments was still possible exploiting ortho-
graphic cognates (Michel Simard et al., 1992),
instead of sentence delimiters. They became the
new candidate correspondence points. During
the alignment, some were discarded because
they lied outside an empirically estimated
bounded search space, required for time and
space reasons.
Martin Kay and Martin Röscheisen (1993)
also needed clearly delimited sentences. Words
with similar distributions became the candidate
correspondence points. Two sentences were
aligned if the number of correspondence points
associating them was greater than an empirically
defined threshold: “[ ] more than some mini-
mum number of times [ ]” (Martin Kay and
Martin Röscheisen, 1993, p.128). In Ido Dagan
et al. (1993) noisy points were filtered out by
deleting frequent words.
Pascale Fung and Kathleen McKeown (1994)
dropped the requirement for sentence boundaries
on a case-study for English-Chinese. Instead,
they used vectors that stored distances between
consecutive occurrences of a word (DK-vec’s).
Candidate correspondence points were identified
from words with similar distance vectors and
noisy points were filtered using some heuristics.
Later, in Pascale Fung and Kathleen McKeown
(1997), the algorithm used extracted terms to
compile a list of reliable pairs of translations.
Those pairs whose distribution similarity was
above a threshold became candidate correspon-
dence points (called potential anchor points).
These points were further constrained not to be
“too far away” from the ‘translation diagonal’.
Michel Simard and Pierre Plamondon (1998)
aligned sentences using isolated cognates as
candidate correspondence points, i.e. cognates
that were not mistaken for others within a text
window. Some were filtered out if they either
lied outside an empirically defined search space,
named a corridor, or were “not in line” with
their neighbours.
Melamed (1999) also filtered candidate corre-
spondence points obtained from orthographic
cognates. A maximum point ambiguity level
filters points outside a search space, a maximum
point dispersion filters points too distant from a
line formed by candidate correspondence points
and a maximum angle deviation filters points
that tend to slope this line too much.
Whether the filtering of candidate correspon-
dence points is done prior to alignment or during
it, we all want to find reliable correspondence
points. They provide the basic means for ex-
tracting reliable information from parallel texts.
However, as far as we learned from the above
papers, current methods have repeatedly used
statistically unsupported heuristics to filter out
noisy points. For instance, the ‘golden transla-
tion diagonal’ is mentioned in all of them but
none attempts filtering noisy points using statis-
tically defined confidence bands.
2 Correspondence Points Filters
2.1 Overview
The basic insight is that not all candidate corre-
spondence points are reliable. Whatever heuris-
tics are taken (similar word distributions, search
corridors, point dispersion, angle deviation, ),
we want to filter the most reliable points. We
assume that reliable points have similar charac-
teristics. For instance, they tend to gather some-
where near the ‘golden translation diagonal’.
Homographs with equal frequencies may be
good alignment points.
2.2 Source Parallel Texts
We worked with a mixed parallel corpus con-
sisting of texts selected at random from the Offi-
cial Journal of the European Communities
1
(ELRA, 1997) and from The Court of Justice of
the European Communities
2
in eleven lan-
guages
3
.
Lan
g
ua
g
e Written Questions Debates Jud
g
ements Total
da 259k (52k) 2,0M (395k) 16k (3k) 2250k
de 234k (47k) 1,8M (368k) 15k (3k) 2088k
el 272k (54k) 1,9M (387k) 16k (3k) 2222k
en 263k (53k) 2,1M (417k) 16k (3k) 2364k
es 292k (58k) 2,2M (439k) 18k (4k) 2507k
fi 13k (3k) 13k
fr 310k (62k) 2,2M (447k) 19k (4k) 2564k
it 279k (56k) 1,9M (375k) 17k (3k) 2171k
nl 275k (55k) 2,1M (428k) 16k (3k) 2431k
p
t 284k (57k) 2,1M (416k) 17k (3k) 2381k
sv 15k (3k) 15k
Total 2468k (55k) 18,4M (408k) 177k (3k) 21005k
Sub-cor
p
us
Table 1:
Words per sub-corpus (average per text
inside brackets; markups discarded)
4
.
For each language, we included:
• five texts with Written Questions asked by
members of the European Parliament to the
European Commission and their corre-
sponding answers (average: about 60k words
or 100 pages / text);
1
Danish (da), Dutch (nl), English (en), French (fr),
German (de), Greek (el), Italian (it), Portuguese (pt) and
Spanish (es).
2
Webpage address: curia.eu.int
3
The same languages as those in footnote 1 plus
Finnish (fi) and Swedish (sv).
4
No Written Questions and Debates texts for Finnish
and Swedish are available in ELRA (1997) since the
texts provided are from the 1992-4 period and it was
not until 1995 that the respective countries became
part of the European Union.
• five texts with records of Debates in the
European Parliament (average: about 400k
words or more than 600 pages / text). These
are written transcripts of oral discussions;
• five texts with judgements of The Court of
Justice of the European Communities (aver-
age: about 3k words or 5 pages / text).
In order to reduce the number of possible pairs
of parallel texts from 110 sets (11 lan-
guages×10) to a more manageable size of 10
sets, we decided to take Portuguese as the kernel
language of all pairs.
2.3 Generating Candidate Correspon-
dence Points
We generate candidate correspondence points
from homographs with equal frequencies in two
parallel texts. Homographs, as a naive and par-
ticular form of cognate words, are likely transla-
tions (e.g. Hong Kong in various European lan-
guages). Here is a table with the percentages of
occurrences of these words in the used texts:
Pair Written Questions Debates Jud
g
ements Avera
g
e
p
t-da 2,8k (4,9%) 2,5k (0,6%) 0,3k (8,1%) 2,5k (1,1%)
p
t-de 2,7k (5,1%) 4,2k (1,0%) 0,4k (7,9%) 4,0k (1,5%)
p
t-el 2,3k (4,0%) 1,9k (0,5%) 0,3k (6,9%) 1,9k (0,8%)
p
t-en 2,7k (4,8%) 2,8k (0,7%) 0,3k (6,2%) 2,7k (1,1%)
p
t-es 4,1k (7,1%) 7,8k (1,9%) 0,7k (15,2%) 7,4k (2,5%)
p
t-fi 0,2k (5,2%) 0,2k (5,2%)
p
t-fr 2,9k (5,0%) 5,1k (1,2%) 0,4k (9,4%) 4,8k (1,6%)
p
t-it 3,1k (5,5%) 5,4k (1,3%) 0,4k (9,6%) 5,2k (1,8%)
p
t-nl 2,6k (4,5%) 4,9k (1,2%) 0,3k (8,3%) 4,7k (1,6%)
p
t-sv 0,3k (6,9%) 0,3k (6,9%)
Avera
g
e 2,9k (5,1%) 4,4k (1,1%) 0,4k (8,4%) 4,2k (1,5%)
Sub-cor
p
us
Table 2:
Average number of homographs with
equal frequencies per pair of parallel texts (aver-
age percentage of homographs inside brackets).
For average size texts (e.g. the Written Ques-
tions), these words account for about 5% of the
total (about 3k words / text). This number varies
according to language similarity. For instance,
on average, it is higher for Portuguese–Spanish
than for Portuguese–English.
These words end up being mainly numbers
and names. Here are a few examples from a
parallel Portuguese–English text: 2002 (num-
bers, dates), ASEAN (acronyms), Patten (proper
names), China (countries), Manila (cities),
apartheid (foreign words), Ltd (abbreviations),
habitats (Latin words), ferry (common names),
global (common vocabulary).
In order to avoid pairing homographs that are
not equivalent (e.g. ‘a’, a definite article in Por-
tuguese and an indefinite article in English), we
restricted ourselves to homographs with the
same frequencies in both parallel texts. In this
way, we are selecting words with similar distri-
butions. Actually, equal frequency words helped
Jean-François Champollion to decipher the Ro-
setta Stone for there was a name of a King
(Ptolemy V) which occurred the same number of
times in the ‘parallel texts’ of the stone.
Each pair of texts provides a set of candidate
correspondence points from which we draw a
line based on linear regression. Points are de-
fined using the co-ordinates of the word posi-
tions in each parallel text. For example, if the
first occurrence of the homograph word Patten
occurs at word position 125545 in the
Portuguese text and at 135787 in the English
parallel text, then the point co-ordinates are
(125545,135787). The generated points may
adjust themselves well to a linear regression line
or may be dispersed around it. So, firstly, we use
a simple filter based on the histogram of the
distances between the expected and real posi-
tions. After that, we apply a finer-grained filter
based on statistically defined confidence bands
for linear regression lines.
We will now elaborate on these filters.
2.4 Eliminating Extreme Points
The points obtained from the positions of homo-
graphs with equal frequencies are still prone to
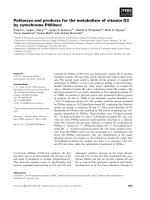
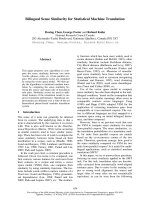
be noisy. Here is an example:
Nois
y
Candidate Corres
p
ondence Points
y = 0,9165x + 141,65
0
10000
20000
30000
40000
50000
0 10000 20000 30000 40000 50000
pt Word Positions
en Word Positions
Figure 1:
Noisy versus ‘well-behaved’ (‘in
line’) candidate correspondence points. The
linear regression line equation is shown on the
top right corner.
The figure above shows noisy points because
their respective homographs appear in positions
quite apart. We should feel reluctant to accept
distant pairings and that is what the first filter
does. It filters out those points which are clearly
too far apart from their expected positions to be
considered as reliable correspondence points.
We find expected positions building a linear
regression line with all points, and then deter-
mining the distances between the real and the
expected word positions:
pt en Positions
Position Word Real Expected Distance
3877 I 24998 3695 21303
9009 etc 22897 8399 14499
11791 I 25060 10948 14112
15248 As 3398 14117 10719
16965 As 3591 15690 12099
22819 volume 32337 21056 11281
Table 3:
A sample of the distances between
expected and real positions of noisy points in
Figure 1.
Expected positions are computed from the lin-
ear regression line equation y = ax + b, where a
is the line slope and b is the Y-axis intercept (the
value of y when x is 0), substituting x for the
Portuguese word position. For Table 3, the ex-
pected word position for the word I at pt word
position 3877 is 0.9165 × 3877 + 141.65 = 3695
(see the regression line equation in Figure 1)
and, thus, the distance between its expected and
real positions is | 3695 – 24998 | = 21303.
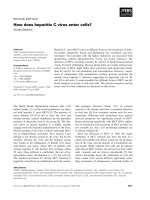
If we draw a histogram ranging from the
smallest to the largest distance, we get:
Histogram of Distances
0
2
4
6
8
10
0
2769
5538
8307
11076
13845
16614
19383
22152
24921
27690
30459
33228
35997
Distances between Real and Ex
p
ected Word Positions
Number of Points
filtered
p
oints
3297
Figure 2:
Histogram of the distances between
expected and real word positions.
In order to build this histogram, we use the
Sturges rule (see ‘Histograms’ in Samuel Kotz et
al. 1982). The number of classes (bars or bins) is
given by 1 + log
2
n, where n is the total number
of points. The size of the classes is given by
(maximum distance – minimum distance) /
number of classes. For example, for Figure 1, we
have 3338 points and the distances between
expected and real positions range from 0 to
35997. Thus, the number of classes is
1 + log
2
3338 ≅ 12.7 → 13 and the size of the
classes is (35997 – 0) / 13 ≅ 2769. In this way,
the first class ranges from 0 to 2769, the second
class from 2769 to 5538 and so forth.
With this histogram, we are able to identify
those words which are too far apart from their
expected positions. In Figure 2, the gap in the
histogram makes clear that there is a discontinu-
ity in the distances between expected and real
positions. So, we are confident that all points
above 22152 are extreme points. We filter them
out of the candidate correspondence points set
and proceed to the next filter.
2.5 Confidence Bands of Linear Regres-
sion Lines
Confidence bands of linear regression lines
(Thomas Wonnacott and Ronald Wonnacott,
1990, p. 384) help us to identify reliable points,
i.e. points which belong to a regression line with
a great confidence level (99.9%). The band is
typically wider in the extremes and narrower in
the middle of the regression line.
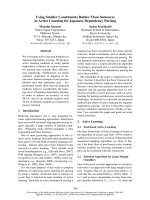
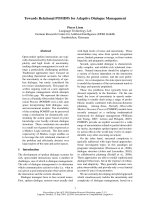
The figure below shows an example of filter-
ing using confidence bands:
Linear Re
g
ression Line Confidence Bands
8700
8800
8900
9000
9100
9400 9450 9500 9550 9600 9650 9700 9750 9800
p
t Word Position
en Word Position
Expected y
Real y
Confidence band
Figure 3:
Detail of the filter based on confi-
dence bands. Point A lies outside the confidence
band. It will be filtered out.
We start from the regression line defined by
the points filtered with the Histogram technique,
described in the previous section, and then we
calculate the confidence band. Points which lie
outside this band are filtered out since they are
credited as too unreliable for alignment (e.g.
Point A in Figure 3). We repeat this step until no
pieces of text belong to different translations, i.e.
until there is no misalignment.
The confidence band is the error admitted at
an x co-ordinate of a linear regression line. A
point (x,y) is considered outside a linear regres-
sion line with a confidence level of 99.9% if its y
co-ordinate does not lie within the confidence
interval [ ax + b – error(x); ax + b + error(x)],
where ax + b is the linear regression line equa-
tion and error(x) is the error admitted at the x
co-ordinate. The upper and lower limits of the
confidence interval are given by the following
equation (see Thomas Wonnacott & Ronald
Wonnacott, 1990, p. 385):
∑
=
−
−
+±+=
n
i
i
Xx
Xx
n
stbaxy
1
2
2
005.0
)(
)(1
)(
where:
• t
0.005
is the t-statistics value for a 99.9% con-
fidence interval. We will use the z-statistics
instead since t
0
.005
= z
0
.005
= 3.27 for large
samples of points (above 120);
• n is the number of points;
• s is the standard deviation from the expected
value
y
ˆ
at co-ordinate x (see Thomas Won-
nacott & Ronald Wonnacott, 1990, p. 379):
baxy
n
yy
s
n
i
i
+=
−
−
=
∑
=
ˆ
where,
2
)
ˆ
(
1
•
X
is the average value of the various x
i
:
∑
=
=
n
i
i
x
n
X
1
1
3 Evaluation
We ran our alignment algorithm on the parallel
texts of 10 language pairs as described in section
2.2. The table below summarises the results:
Pair Written Questions Debates Judgements Average
pt-da 128 (5%) 56 (2%) 114 (35%) 63 (2%)
pt-de 124 (5%) 99 (2%) 53 (15%) 102 (3%)
pt-el 118 (5%) 115 (6%) 60 (20%) 115 (6%)
pt-en 88 (3%) 102 (4%) 50 (19%) 101 (4%)
pt-es 59 (1%) 55 (1%) 143 (21%) 56 (1%)
pt-fi 60 (26%) 60 (26%)
pt-fr 148 (5%) 113 (2%) 212 (49%) 117 (2%)
pt-it 117 (4%) 104 (2%) 25 (6%) 105 (2%)
pt-nl 120 (5%) 73 (1%) 53 (15%) 77 (2%)
pt-sv 74 (23%) 74 (23%)
Average 113 (4%) 90 (2%) 84 (23%) 92 (2%)
Sub-cor
p
us
Table 4:
Average number of correspondence
points in the first non-misalignment (average
ratio of filtered and initial candidate correspon-
dence points inside brackets).
On average, we end up with about 2% of the
initial correspondence points which means that
we are able to break a text in about 90 segments
(ranging from 70 words to 12 pages per segment
A
for the Debates). An average of just three filtra-
tions are needed: the Histogram filter plus two
filtrations with the Confidence Bands.
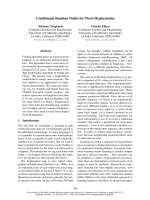
The figure below shows an example of a mis-
aligning correspondence point.
Misalignments
(Crossed segments)
300
400
500
600
700
800
900
1000
300 400 500 600 700 800
p
t Word Position
en Word Position
Figure 4: Bad correspondence points (× – mis-
aligning points;
Had we restricted ourselves to using homo-
graphs which occur only once (hapaxes), we
would get about one third of the final points
(António Ribeiro et al. 2000a). Hapaxes turn out
to be good candidate correspondence points
because they work like cognates that are not
mistaken for others within the full text scope
(Michel Simard and Pierre Plamondon, 1998).
When they are in similar positions, they turn out
to be reliable correspondence points.
To compare our results, we aligned the BAF
Corpus (Michel Simard and Pierre Plamondon,
1998) which consists of a collection of parallel
texts (Canadian Parliament Hansards, United
Nations, literary, etc.).
Filename # Tokens # Se
g
ments Chars / Se
g
ment # Se
g
ments Chars / Se
g
ment Ratio
citi1.fr 17556 49 1860 742 120 6,6%
citi2.fr 33539 48 3360 1393 104 3,4%
cour.fr 49616 101 2217 1377 140 7,3%
hans.fr 82834 45 8932 3059 117 1,5%
ilo.fr 210342 68 15654 7129 137 1,0%
onu.fr 74402 27 14101 2559 132 1,1%
tao1.fr 10506 52 1019 365 95 14,2%
tao2.fr 9825 51 972 305 97 16,7%
tao3.fr 4673 44 531 176 62 25,0%
verne.fr 79858 29 12736 2521 127 1,2%
xerox.fr 66605 114 2917 3454 85 3,3%
Avera
g
e 111883 60 10271 3924 123 1,5%
E
q
ual Fre
q
uenc
y
Homo
g
ra
p
hs BAF Anal
y
sis
Table 5: Comparison with the Jacal alignment
(Michel Simard and Pierre Plamondon, 1998).
The table above shows that, on average, we
got about 1.5% of the total segments, resulting
in about 10k characters per segment. This num-
ber ranges from 25% (average: 500 characters
per segment) for a small text (tao3.fr-en) to 1%
(average: 15k characters per segment) for a large
text (ilo.fr-en). Although these are small num-
bers, we should notice that, in contrast with Mi-
chel Simard and Pierre Plamondon (1998), we
are not including:
• words defined as cognate “if their four first
characters are identical”;
• an ‘isolation window’ heuristics to reduce the
search space;
• heuristics to define a search corridor to find
candidate correspondence points;
We should stress again that the algorithm re-
ported in this paper is purely statistical and re-
curs to no heuristics. Moreover, we did not re-
apply the algorithm to each aligned parallel
segment which would result in finding more
correspondence points and, consequently, fur-
ther segmentation of the parallel texts. Besides,
if we use the methodology presented in Joaquim
da Silva et al. (1999) for extracting relevant
string patterns, we are able to identify more sta-
tistically reliable cognates.
António Ribeiro and Gabriel Lopes (1999) re-
port a higher number of segments using clusters
of points. However, the algorithm does not as-
sure 100% alignment precision and discards
some good correspondence points which end up
in bad clusters.
Our main critique to the use of heuristics is
that though they may be intuitively quite accept-
able and may significantly improve the results as
seen with Jacal alignment for the BAF Corpus,
they are just heuristics and cannot be theoreti-
cally explained by Statistics.
Conclusions
Confidence bands of linear regression lines help
us to identify reliable correspondence points
without using empirically found or statistically
unsupported heuristics. This paper presents a
purely statistical approach to the selection of
candidate correspondence points for parallel
texts alignment without recurring to heuristics as
in previous work. The alignment is not restricted
to sentence or paragraph level for which clearly
delimited boundaries markers would be needed.
It is made at whatever segment size as long as
reliable correspondence points are found. This
means that alignment can result at paragraph,
sentence, phrase, term or word level.
Moreover, the methodology does not depend
on the way candidate correspondence points are
generated, i.e. although we used homographs
with equal frequencies, we could have also boot-
strapped the process using cognates (Michel
Simard et al. 1992) or a small bilingual lexicon
to identify equivalents of words or expressions
(Dekai Wu 1994; Pascale Fung and Kathleen
McKeown 1997; Melamed 1999). This is a par-
ticularly good strategy when it comes to distant
languages like English and Chinese where the
number of homographs is reduced. As António
Ribeiro et al. (2000b) showed, these tokens ac-
count for about 5% for small texts. Aligning
languages with such different alphabets requires
automatic methods to identify equivalents as
Pascale Fung and Kathleen McKeown (1997)
presented, increasing the number of candidate
correspondence points at the beginning.
Selecting correspondence points improves the
quality and reliability of parallel texts alignment.
As this alignment algorithm is not restricted to
paragraphs or sentences, 100% alignment preci-
sion may be degraded by language specific term
order policies in small segments. On average,
three filtrations proved enough to avoid crossed
segments which are a result of misalignments.
The method is language and character-set inde-
pendent and does not assume any a priori lan-
guage knowledge (namely, small bilingual lexi-
cons), text tagging, well defined sentence or
paragraph boundaries nor one-to-one translation
of sentences.
Future Work
At the moment, we are working on alignment of
sub-segments of parallel texts in order to find
more correspondence points within each aligned
segment in a recursive way. We are also plan-
ning to apply the method to large parallel Portu-
guese–Chinese texts. We believe we may sig-
nificantly increase the number of segments we
get in the end by using a more dynamic ap-
proach to the filtering using linear regression
lines, by selecting candidate correspondence
points at the same time that parallel texts tokens
are input. This approach is similar to Melamed
(1999) but, in contrast, it is statistically sup-
ported and uses no heuristics.
Another area for future experiments will use
relevant strings of characters in parallel texts
instead of using just homographs. For this pur-
pose, we will apply a methodology described in
Joaquim da Silva et al. (1999). This method was
used to extract string patterns and it will help us
to automatically extract ‘real’ cognates.
Acknowledgements
Our thanks go to the anonymous referees for
their valuable comments on the paper. We
would also like to thank Michel Simard for pro-
viding us the aligned BAF Corpus. This research
was partially supported by a grant from Funda-
ção para a Ciência e Tecnologia / Praxis XXI.
References
Peter Brown, Jennifer Lai and Robert Mercer (1991)
Aligning Sentences in Parallel Corpora
. In “Pro-
ceedings of the 29th Annual Meeting of the Asso-
ciation for Computational Linguistics”, Berkeley,
California, U.S.A., pp. 169–176.
Kenneth Church (1993)
Char_align: A Program for
Aligning Parallel Texts at the Character Level
. In
“Proceedings of the 31st Annual Meeting of the
Association for Computational Linguistics”,
Columbus, Ohio, U.S.A., pp. 1–8.
Ido Dagan, Kenneth Church and William Gale (1993)
Robust Word Alignment for Machine Aided
Translation.
In “Proceedings of the Workshop on
Very Large Corpora: Academic and Industrial
Perspectives”, Columbus, Ohio, U.S.A., pp. 1–8.
ELRA (European Language Resources Association)
(1997) Multilingual Corpora for Co-operation,
Disk 2 of 2. Paris, France.
Pascale Fung and Kathleen McKeown (1994)
Aligning Noisy Parallel Corpora across Language
Groups: Word Pair Feature Matching by Dynamic
Time Warping
. In “Technology Partnerships for
Crossing the Language Barrier: Proceedings of the
First Conference of the Association for Machine
Translation in the Americas”, Columbia, Maryland,
U.S.A., pp. 81–88.
Pascale Fung and Kathleen McKeown (1997)
A
Technical Word- and Term-Translation Aid Using
Noisy Parallel Corpora across Language Groups
.
Machine Translation, 12/1–2 (Special issue),
pp. 53–87.
William Gale and Kenneth Church (1991)
A Pro-
gram for Aligning Sentences in Bilingual Corpora
.
In “Proceedings of the 29th Annual Meeting of the
Association for Computational Linguistics”,
Berkeley, California, U.S.A., pp. 177–184 (short
version). Also (1993) Computational Linguistics,
19/1, pp. 75–102 (long version).
Martin Kay and Martin Röscheisen (1993)
Text-
Translation Alignment
. Computational Linguistics,
19/1, pp. 121–142.
Samuel Kotz, Norman Johnson and Campbell Read
(1982)
Encyclopaedia of Statistical Sciences
. John
Wiley & Sons, New York Chichester Brisbane
Toronto Singapore.
I. Dan Melamed (1999) Bitext Maps and Alignment
via Pattern Recognition. Computational Linguis-
tics, 25/1, pp. 107–130.
António Ribeiro, Gabriel Lopes and João Mexia
(2000a) Using Confidence Bands for Alignment
with Hapaxes. In “Proceedings of the International
Conference on Artificial Intelligence (IC’AI
2000)”, Computer Science Research, Education
and Applications Press, U.S.A., volume II,
pp. 1089–1095.
António Ribeiro, Gabriel Lopes and João Mexia
(2000b, in press) Aligning Portuguese and Chi-
nese Parallel Texts Using Confidence Bands. In
“Proceedings of the Sixth Pacific Rim International
Conference on Artificial Intelligence (PRICAI
2000) – Lecture Notes in Artificial Intelligence”,
Springer-Verlag.
Joaquim da Silva, Gaël Dias, Sylvie Guilloré, José
Lopes (1999) Using Localmaxs Algorithms for the
Extraction of Contiguous and Non-contiguous
Multiword Lexical Units. In Pedro Barahona and
José Alferes, eds., “Progress in Artificial Intelli-
gence – Lecture Notes in Artificial Intelligence”,
number 1695, Springer-Verlag, Berlin, Germany,
pp. 113–132.
Michel Simard, George Foster and Pierre Isabelle
(1992) Using Cognates to Align Sentences in Bi-
lingual Corpora. In “Proceedings of the Fourth
International Conference on Theoretical and
Methodological Issues in Machine Translation
TMI-92”, Montreal, Canada, pp. 67–81.
Michel Simard and Pierre Plamondon (1998)
Bilingual Sentence Alignment: Balancing Robust-
ness and Accuracy. Machine Translation, 13/1,
pp. 59–80.
Dekai Wu (1994) Aligning a Parallel English–Chi-
nese Corpus Statistically with Lexical Criteria. In
“Proceedings of the 32nd Annual Conference of
the Association for Computational Linguistics”,
Las Cruces, New Mexico, U.S.A., pp. 80–87.
Thomas Wonnacott and Ronald Wonnacott (1990)
Introductory Statistics. 5th edition, John Wiley &
Sons, New York Chichester Brisbane Toronto
Singapore, 711 p