Tài liệu What is a high school worth?: A model of Australian private secondary school fees docx
Bạn đang xem bản rút gọn của tài liệu. Xem và tải ngay bản đầy đủ của tài liệu tại đây (491.18 KB, 24 trang )
Department of Economics
Working Paper Series
What is a high school worth?: A model of
Australian private secondary school fees
J. N. Lye and J. G. Hirschberg
Sept 2012
Research Paper Number 1161
ISSN: 0819 2642
ISBN: 978 0 7340 4512 6
Department of Economics
The University of Melbourne
Parkville VIC 3010
www.economics.unimelb.edu.au
What is a high school worth?: A model of
Australian private secondary school fees
J. N. Lye and J. G. Hirschberg1
Abstract
Over the last few decades there have been significant increases in student enrolments in
Australian non-government schools. It has been suggested that this growth has been the
outcome of government subsidies to non-government schools. Despite this significant funding
school fees have also been increasing. In this paper we examine these changes for Victoria and
look at a number of comparisons between government and non-government schools. In
addition, rather than examining the determinants of school selection we examine the
determinants of fees at non-government schools by estimating a hedonic price model.
We conclude that the characteristics of the schools such as university entrance
performance do have a positive impact on the fees. In addition, we determine that the
socioeconomic status of the other students has a positive impact as well as the scale of the
school as measured by the number of staff, the variety of the offerings and the age of the
school all have a positive impact.
1
Department of Economics, University of Melbourne, Melbourne, Vic, 3010.
1. Introduction
In most of Australa parents have three options for their children’s secondary school:
government, Catholic and independent. In this paper we examine the characteristics of the
non-government schools in the Australian state of Victoria to establish to what extent the
characteristics of the school are important to the parents and how they are valued. In order to
do this we estimate an hedonic price model for the fees paid for senior school (usually the last
3 years of high school).
Government schools, also known as state or public schools are administered by the
state or territory government and are free for all Australian citizens and permanent residents,
although many ask parents to pay a quasi voluntary contribution fee and some schools are
selective in their intake. Catholic and independent schools usually charge tuition fees in
addition to receiving some level of support from the government. A portion of the Catholic
schools are Systemic schools that make up a part of regional network that is operated by the
Catholic Education Offices. The fees these schools charge tend to be modest. Their mission is
to provide Catholic education to all Catholic students regardless of their means.
Independent schools are non-government institutions founded by religious or other
groups in the community and are registered with the state. Traditionally, schools in the
independent sector charged higher fees, but the recent growth in this sector has been of low-fee
schools. Whereas some independent schools belong to small systems that share educational
and/or religious philosophies, 80% of them are administered as individual schools and 84%
have a religious affiliation (Wilkinson et al. 2004). There are a few independent Catholic
schools that were established in the past by various religious orders such as for example the
Christian Brothers and fees at these schools can vary from low to high. In 1986 the Hawke
Government introduced the New Schools Policy with the purpose being to constrain the
creation of new private schools in locations where demographic need could not be established.
However, it was abolished by the Howard Government in 1996 to give parents more options.
2
Since then, a number of new, often small and not necessarily traditional schools have been
formed.
Australia has one of the largest non-government school sectors (OECD 2011). The
share of students attending Catholic schools has been steadily increasing. In the 1950s, 17% of
people who turned 15 were educated in a Catholic school while in 2009 around 22% of
students were educated in Catholic secondary schools. However, over time, the share of
students attending independent schools has fluctuated. Of those turning 15 in the 1940s and
1950s about 13% attended independent schools but this share fell in the 1970s to 8%. Since
then the share has been constantly increasing and in 2009, 18% of students were attending
secondary independent schools. It has been suggested that this growth has been the outcome of
government subsidies to non-government schools over the last 3 decades. Ryan and Watson
(2010) conclude that these subsidies have been used by schools to increase the quality of their
services, such as reducing staff to student ratios, rather than reducing fees as was the intention
of the policy.
Socio-economic factors including parental higher occupational status and education and
higher household income have all been shown to be important determinants of school-sector
selection (Le and Miller 2003). Education is a complex good and numerous factors have been
shown to influence parental choice of school. An Independent Schools Council of Australia
survey (ISCA 2008) identified a number of common factors that affect parental school choice.
The most advantageous aspects of independent schools were that they employed good teachers,
offered a disciplined environment and had good facilities. Other reasons included factors such
as academic excellence, moral values and smaller class sizes. Beavis (2004) reports on a
survey of 609 households and identifies the strongest effect of selection of a non-government
school was the perception of the school having traditional values. For parents of students
attending a Catholic school, discipline and religious values were also considered to be
important.
3
Despite significant Government funding to non-government schools, school fees have
been increasing. Ryan and Watson (2010) show that since the 1980s there has been a growth
in real fees in both the Catholic and independent sectors. In this paper, we examine these
changes for Victoria and look at a number of comparisons between government and nongovernment schools. In addition, rather than examining the determinants of school selection,
we examine the determinants of fees at non-government schools. The approach taken is
similar to Hartford and Marcus (1986) who investigated the effects of various features of US
colleges on their tuition. They found that private school tuitions correspond to the quantity and
quality of the faculties, facilities and student bodies. Dimkpah, Eseonu and Akpom (2004) and
Schwatz and Scafidi (2004) also examine the relationship between US college tuition rates and
college quality.
In Victoria the school education system consists of primary schools from prep year to
year 6 (5-12) and secondary schools from year 7 to year 12 (age 12-18). Most students
complete 13 years of school and attain a year 12 certificate. The proportion of secondary
school children enrolled in Catholic systemic and independent schools in 2009 was reported as
over 40% of the 385,667 secondary students in the state. Using data for a cross-section of 171
non-government schools from Victoria, we estimate a hedonic price model for secondary
education. We explore the relationships between school fees and the observable characteristics
of private schools considered to be important. These factors include student-staff ratios, cocurricular activities, affiliations, boarding facilities, age of school, gender composition,
academic merit and measures of socio-economic status of students enrolled. The hedonic
approach allows the estimation of the marginal values that are implied for these types of
characteristics and reveal what parents are willing to pay for.
The rest of the paper proceeds as follows. In Section 2 we present a background of
important features of the school system in Victoria including the amount per student federal
government funding to non-government schools and also per-student tuition fees and how they
4
compare with other States. We also present a number of comparisons across the school
sectors. In Section 3 we estimate a hedonic price model of tuition fees for secondary education
and in Section 4 we present conclusions.
2.
Schools in Victoria
Over the last 20 years, there has been a notable shift in enrolments towards non-
government schools away from government schools. A number of reasons have been
suggested including changes in federal policies towards funding and in parental expectations
on taking responsibility for their child's education (Buckingham 2010). In this section, we
present a history of government funding to non-government schools. School fees at nongovernment schools are the most significant parental expense. We show how they have
changed over time and compare those in Victoria with the other States. We also present
comparsions across the school sectors. On the basis of school numbers, student enrolments,
standard Year 12 statistics, socioeconomic status, net recurrent income per student and studentstaff ratios.
2.1
Government Funding
By the 1860s various religious denominations were typically responsible for providing
schooling. It was subsidized by the state and there were a few state-run schools. However, the
Education Act (1872) introduced free, compulsory and secular education in a centralised
system of state-run schools. It was argued that secular education would help avoid religious
conflict. At this time, state aid to those schools that chose to remain independent to the staterun school system was abolished. This led to a dual structure of school system with
government and non-government schools operating in parallel. To keep costs down, Catholic
schools relied on religious orders to staff their schools. The non-Catholic non-government
5
schools did not have the same capacity to do this and consequently were forced to charge
higher fees (Cahill and Gray 2010).
In 1967, Victoria was the first State Government to provide uniform recurrent grants
for both primary and secondary students attending non-government schools. Funds from the
Commonwealth Government first began flowing into non-Government schools during the
1970s. Prior to this, Catholic schools in particular were struggling to survive. High-fee
schools were out of the reach of most Australian families. Those children who did attend lowfee schools did so primarily due to religious or philosophical reasons (Cahill and Gray 2010).
Today the Commonwealth Government is the main public funding source for nongovernment schools. To receive funding, non-government schools must be not-for-profit
organisations. That is, while they are allowed to generate a surplus and retain excess funds, the
surplus is not allowed to be distributed to owners or members. In 1973 the Commonwealth
Government introduced a needs-based program to provide financial aid to schools. Since this
time successive Commonwealth and State Governments have steadily increased the amount of
funding they have provided to these schools. In 2000, the Socio-economic status (SES)
funding scheme was introduced. Under this scheme, non-government schools are allocated a
proportion of Average Government School recurrent Costs (AGSRC) to each student they
enrol depending on their SES status. An SES score is derived for each non-Government school
which places it on a sliding scale of funding entitlement. However, not all non-Government
schools are funded in this way. There are two other categories, funding maintained and
funding guaranteed as the Commonwealth Government promised that schools would not be
disadvantaged by the new funding system, known as the “no loser” policy. Non-government
schools also receive funding from the State which in Victoria is allocated to schools based on
the Financial Assistance Model (FAM) which includes a mix of core per capita funding and a
needs-based funding.
6
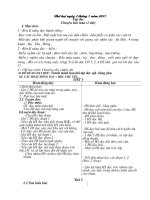
Figure 1 plots the average per student grants in $2008 from 1990 for Catholic and
independent schools. It illustrates that the average per student grants have been increasing with
the Commonwealth grants being higher than the State grants and Catholic schools on average
receiving more per student than independent schools.
Figure 1: Per Student Grants to Non-Government Schools ($2008)
Com onwealth G
m
overnm G
ent rants
State G
overnm G
ent rants
6,000
Catholic
Catholic
1,600
5,000
Independent
1,400
4,000
1,200
3,000
Independent
2,000
1,000
1,000
92
2.2
94
96
98
00
02
04
06
08
92
94
96
98
00
02
04
06
08
School Fees
The Commonwealth Education Minister David Kemp introduced the Socio-economic
status (SES) funding scheme to “make independent schools more accessible, keep fees
lower…” (Feb 17 2008). Tuition fees are the most significant expenditure for parents of
children attending non-government schools. In most, school fees vary depending on the year
level of the student and typically the last two years of school (Years 11 and 12) are the most
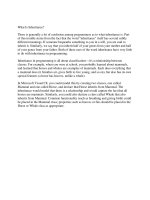
expensive. Figure 2 plots the average per student tuition fee in $2008 for Catholic and
independent schools for all States and despite increases in Government funding there has been
a growth in real fees for both school types. However, per student Catholic fees are lower on
average than those for independent schools. In Victoria, the per student fees for Catholic
schools are similar to those in other States. However, for independent schools Victoria has the
highest average per student fee across Australia.
7
Figure 2: Changes in Fees ($2008)
Catholic
3,200
SA
$2008 per student
2,800
2,400
Vic
WA
2,000
QLD
1,600
1,200
NSW
800
91 92 93 94 95 96 97 98 99 00 01 02 03 04 05 06 07 08
Independent
10,000
$2008 per student
9,000
8,000
7,000
6,000
Vic
NSW
5,000
WA
4,000
SA
QLD
3,000
91 92 93 94 95 96 97 98 99 00 01 02 03 04 05 06 07 08
Source: National Report on Schooling in Australia www.nceecdya.edu.au
2.3
Comparisons across Schools by Sector
Table 1 shows how the proportion of students attending different types of schools in
Victoria has changed over time. There has been a decline in the share of students attending
Government schools. In the secondary sector, there has been a rise in the proportion of
students attending both Catholic and independent schools whereas in the primary sector the
increase has predominantly occurred in the independent sector. Table 2 concentrates on this
distribution of students across school types for the final year of school – Year 12. While the
proportion of students in Year 12 attending Catholic schools has been steady over the last
8
decade we see that the fall in the proportion of students attending Government schools is offset
by the increase in the proportion attending independent schools.
Table 1: % of students attending different types of schools in Victoria2
1970
1980
Sector
Government
Catholic
Independent
76.3
21.0
2.7
76.2
19.8
4.0
Government
Catholic
Independent
73.9
16.8
9.3
70.1
19.2
10.7
1990
Primary
69.8
23.8
6.5
Secondary
63.9
21.3
14.7
2000
2010
69.4
22.6
8.0
67.7
22.1
10.2
61.4
22.1
16.5
58.1
22.9
19.0
Table 2: % of Year 12 Victorian students attending different types of schools.
year
1996
2000
2004
2008
2010
Government
59.7
58.2
57.4
55.0
55.7
Catholic
22.3
22.6
22.1
22.8
22.6
Independent
18.0
19.1
20.6
22.2
21.7
There has also been a change in the composition of the types of schools as is illustrated
in Table 3. Corresponding to a fall in the percentage of schools that are Government run, there
has been an increase in the percentage of schools that are both Catholic and independent.
Table 3: % of Types of Schools in Victoria3
year
1970
1980
1990
2000
2010
Government
79.2
77.3
74.0
70.1
68.8
Catholic
17.4
17.6
18.4
21.1
21.7
Independent
3.4
5.1
7.6
8.8
9.5
Victoria is the second largest state in Australia with a population of over 5.5 million
and over 80% live in metropolitan Melbourne. Table 4 shows that the majority of student
2
There is no distinction between those attending systemic and independent Catholic schools in this Table.
Source ABS 4221.0
3
There is no distinction between those attending systemic and independent Catholic schools in this Table.
Source ABS 4221.0
9
enrolments in non-government schools and the number of non-government schools are in
metropolitan Melbourne rather than regional Victoria.
Table 4: % of Student Enrolments in non-government schools by location in 20074
Melbourne
Regional
Independent
(%) of Students
(%) of Schools
78.6
67.3
21.4
32.7
Catholic
(%) of Students (%) of Schools
75.3
67.1
24.7
32.9
The Victorian Curriculum and assessment Authority (VCAA) manages and awards
school qualifications. It administers and awards two senior school secondary qualifications
known as the Victorian Certificate of education (VCE) and the Victorian Certificate of Applied
Learning (VCAL). The majority of students complete a VCE program which includes a
number of different VCE subjects, the majority of which have 4 units available over a 2 year
period (Year 11 and Year 12). To complete, students must complete a minimum
total of 16 units over the two years plus 3 units from the English field. A study score is
awarded to each student for every unit 3 and 4 completed. The top mark is 50 and the mean
across the state is 30. Scores above 40 represent high achievement in specific subjects. The
VCAL is essentially a work and employment orientated program. An alternative to either of
these is the International Baccalaureate (IB) and a small number of schools, mainly private,
offer the IB diploma.
Table 5 reports some standard VCE statistics across the different school types for 482
secondary schools from which complete data is available. These statistics are often reported to
indicate a typical level of achievement within a school. Schools are allocated a median study
score which is the middle score of all eligible students. This is highest on average for
independent schools and lowest for Government schools. Also reported in Table 5 is the
average for each school type for the percentage of students with study scores of 40 or more.
4
Source: www.independentschools.vic.edu.au; Catholic Schools Enrolment trends 2007 Report from the
Australian Catholic Education Statistics Working Group 2008.
10
For this statistic, a big difference across the school types is observed with again the
independent schools outperforming the other types.
Studies have shown that schools that have a higher mean socioeconomic status (SES)
differ in multiple ways from those schools that have a lower mean SES. For example, schools
with a lower mean SES often have fewer material and financial resources, may have more
discipline problems, less qualified teachers, lower teacher expectations and offer a less
academic rigorous curriculum. On the other hand, in higher mean SES schools there may be
more of a culture of achievement because students attending these schools may have higher
expectations of academic success (Perry and McConney 2010). One measure of SES is the
Index of Community Socio-Educational Advantage (ICSEA) which takes into account factors
including parental education and occupation, remoteness of the school, proportions of
indigenous students and students with a language background other than English. The average
ICSEA value is 1000 and the lower the value the more disadvantaged is the school.
Table 5: Comparisons across Secondary School Types
Sector
Government
Catholic
Independent
Overall
Median
VCE Score
27.8
30.6
31.8
29.4
% study
scores 40+
4.3
8.0
12.9
7.2
Avg.
ICSEA
998.3
1046.7
1181.4
1054.4
Avg.
NRIPS
12,486.1
11,114.8
14,396.2
12,736.8
Number of
Schools
271
86
125
482
Table 5 indicates that for our sample of secondary schools, independent schools attract
the more affluent families with the highest ICSEA on average followed by Catholic and then
Government schools which have minimal fees consequently family income is not a barrier to
enrol. Average School’s net recurrent income per student (NRIPS) across the school types is
also given in Table 5. This includes income from the Australian Government, State
Government, fees, charges and parent contributions and other private sources. On average, per
student this is highest for independent Schools followed by Government School students and
then Catholic school students.
11
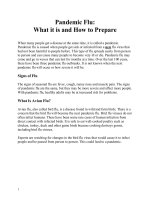
Figure 3: Student-Staff Ratios
Full-time equivalent student to teaching staff ratios are calculated by dividing the
number of full-time students by the number of full-time teaching staff. They are used as an
indication of the level of resources available in schools (ie not a measure of class size). Ryan
and Watson (2010) conclude that increases in Government funding to non-government schools
has primarily been used to improve the quality of the learning experiences of students as
measured by improvements in student-staff ratios. Figure 3 plots student-staff ratios for all
school types for both the primary and secondary sectors. The student-staff ratios are lowest for
the independent school sector. However, while Catholic schools still on average have higher
student-ratios than the Government sector we see that there has been a significant fall in their
ratios over time.
3.
Hedonic Price Model
In our analysis we use data from the Australian state of Victoria for 2010 for a cross-
section of 171 non-government schools from Victoria. We explore the relationships between
school fees and the observable characteristics of private schools considered to be important.
The data used comes from a range of sources which is outlined in Appendix 1.
12
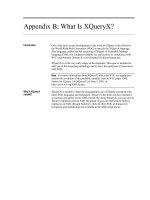
Figure 4 illustrates the range of tuition fees within our data set and also highlights the
comparison with university tuition fees. Except for a small number of professional institutions
almost all tertiary education in Australia is government funded. Unlike the US where
university tuition education has a wide range of price levels in Australia the current annual
domestic undergraduate university tuition range from $6,000 for Arts to $11,000 for Medicine.
These fees are set by the Australian Commonwealth and are charged at all non-private tertiary
institutions.
Figure 4: Fees for Systemic and Independent Schools in Victoria 2010
y
30,000
25,000
20,000
15,000
10,000
Univers ity
F ees
5,000
0
In general, hedonic price models provide an indication of the impact of various
characteristics for goods and services on their market clearing price without regard for the
market power exerted by the buyers or sellers. In the models estimated below we assume that
the fees paid for year 12 high school are indicative of the value placed on the high school
education provided by the school. This market is subject to a number of characteristics that
restrict entry for suppliers due to limited places and restrictions on new schools. Buyers in this
market have a limited time for choice given that a child will only require this service for a
period and most school choice decisions are made prior to entry to year 10. Entrance after year
10 is quite uncommon in the schools in our sample.
13
3.1
Simple Hedonic Model
As a preliminary analysis we fit a descriptive model in which we demonstrate the
degree to which the fees can be explained by the VCE performance. Here we assume that log
fees are only related to VCE performance as measured by the percent of study scores of 40 and
over for each school in the sample. Figure 5 shows the estimated relationship as well as the
sample points distinguished between systemic and independent schools. Except for a small
number of outliers the relationship for systemic schools is lower than for independent schools.
In addition, for independent schools there appears to be a nonlinear relationship.
Figure 5: A bivariate Relationship between fees and VCE performance (red for Systemic and
blue for Independent).
10.4
10.0
LOG(FEES)
9.6
9.2
8.8
8.4
8.0
7.6
7.2
0
4
8
12 16 20 24 28 32 36
TOP40
.
3.2
Multivariate Regression
The difficulty with the simple analysis shown above is that it does not account for a
number of other features of the schools that may also influence the fees. Note that the model
presented above does not fit perfectly and that in a number of cases the predicted fees are much
14
higher or lower than the actual fees. In order to account for these we perform a general
multivariate regression:
YT 1 = XT k β k1 + uT 1
where Y is the vector of T observations on the fees for the non-government schools in Victoria,
the k columns of matrix X are the characteristics and the vector u represents the errors in the
specification are the observations.
The log of the fees defines the dependent variable. The regressors are characteristics
determined by various aspects of the school and are defined as the percentage VCE scores of
40+ ; the number of music, sport and language offing; the religious affiliation; the membership
of the school in sporting competitions (as described in Appendix 2); the socio-economic
indicator of the parents (ICSEA); the proportion of students from non-English speaking
families (LBOTE); if the school is a single sex school; the age of the school; and the level of
commonwealth (federal) funding the school receives per student.5 Figure 6 presents a
histogram for the dependent variable and each of the regressors and illustrates the variation in
each of these variables.
Figure 6: Distribution of regressors used in this analysis.
FEES
LOG_FEES
28
MUSIC
25
SPORT
50
20
24
40
40
30
12
15
10
Frequency
16
Frequency
Frequency
Frequency
20
30
20
8
5
0
0
5,000
10,000
15,000
20,000
25,000
0
30,000
7.0
7.5
8.0
8.5
OTHER
9.0
9.5
10.0
10.5
0
0
4
8
TOP40
12
16
20
24
0
12
8
8
4
0
0
4
8
12
16
20
24
28
32
36
0
4
8
12
LANG_OPTIONS
16
20
24
28
32
36
16
35
40
45
10
1,000
1,040
1,080
1,120
1,160
1,200
0
10
20
30
SEC_PER_CAPITA
40
50
60
70
80
90 100 110
FULL10+SUPPORT10
60
30
50
50
30
0
960
AGE
60
25
5
4
0
20
15
12
4
0
15
20
Frequency
Frequency
16
8
10
LBOTE
20
16
Frequency
20
16
12
5
ICSEA
20
Frequency
10
10
0
4
20
25
40
20
20
8
Frequency
30
Frequency
40
Frequency
Frequency
12
30
20
15
10
4
10
10
0
0
0
1
2
3
4
5
6
7
0
20
40
60
80
100
120
140
160
5
0
1,000
5
0
2,000
3,000
4,000
5,000
6,000
7,000
8,000
0
50
100
150
200
250
300
350
400
450
The systemic schools receive between $5,856 and $6,920 per student from the federal and state governments
while the other independent school’s payments are between $1,882 and $7,453 per student per year.
15
The model was estimated using two different strategies. In the first approach the model
was estimated using standard least squares. However, a potential specification issue concerns
the socioeconomic status as measured by ISEA may be endogenous to the amount that can be
paid for the school fees. That is, higher socioeconomic households can afford to pay higher
fees and thus there is a possibility that ICSEA is related to the error in the equation. In the
second approach we use an instrumental variable for ICSEA to allow for the possible
simultaneity bias and the generalized method of moments for the estimation. The instrument
we used is the average ICSEA of the five schools that are in closest proximity to the school
under consideration. The correlation between this value and the actual ICSEA is .78.
Regression results for both approaches are reported in Table 6.
Table 6: Regression results
Variable
Intercept
girls_only
boys_only
Music
Sport
other excurricular
boarding
Regional non-metro
top40
Systemic
Jewish
VCAL
APSV
AGSV
ACC
ICSEA
LBOTE
lang_options
Age
Age2
sec_per_capita
Number Staff
Number Staff2
OLS
Coef.
t_stat
6.21512
6.54
-0.03760 -0.47
-0.18466 -1.85
0.01970
2.02
0.00462
0.97
0.00287
0.01
0.20134
2.83
-0.22661 -3.25
0.01006
1.85
-0.63913 -7.24
-0.39885 -2.24
-0.12907 -1.83
0.29399
2.54
0.14811
1.35
0.30503
2.49
0.00222
2.77
-0.00369 -3.03
0.06238
2.13
0.00697
2.44
-0.00004 -2.17
-0.00007 -2.28
0.00348
2.88
-0.00001 -3.66
R2
.90
16
P>t
0.000
0.637
0.066
0.046
0.334
0.640
0.005
0.002
0.067
0.000
0.027
0.069
0.012
0.178
0.014
0.006
0.003
0.035
0.016
0.032
0.024
0.005
0.000
GMM
Coef.
t_stat
4.37383
2.91
-0.02952 -0.36
-0.21698 -2.56
0.02546
2.07
0.00648
1.58
0.00316
0.46
0.20045
3.62
-0.27551 -4.39
0.00551
1.06
-0.63573 -6.85
-0.40748 -1.81
-0.08484 -1.10
0.27354
2.71
0.14628
2.10
0.26962
2.58
0.00377
2.93
-0.00299 -1.99
0.04300
1.48
0.00518
1.61
-0.00003 -1.45
-0.00004 -0.85
0.00342
2.78
-0.00001 -3.97
R2
.89
P>t
0.004
0.717
0.012
0.041
0.116
0.645
0.000
0.000
0.290
0.000
0.072
0.273
0.008
0.038
0.001
0.004
0.049
0.142
0.110
0.149
0.397
0.006
0.000
We find that the results of both models are very similar. Common results indicate that
single sex girl’s schools do not attract a premium while single sex boy’s schools tend to be
cheaper. Catholic systemic, Jewish schools and regional schools also attract lower fees while
schools that have boarding facilities have higher fees in general. The higher the proportion of
non-English backgrounds within a school and lower socio-economic households also seem to
be associated with lower fees. However, more music offerings approximately double the
premium of more sports. The size of the school as measured by the total number of teaching
and support staff appears to have a non-linear impact on the fees. Fees are higher only until
around 165 full-time equivalent teaching and support staff are employed. There are positively
significant school associations with ACC, APSV and AGSV all being significant in the IV
model. We also have discovered that the impact of the age of the school has a non-linear
impact on fees and that the fees rise for older schools until the school is approximately 100
years old.
4.
Conclusions
The fees charged by non-government schools in Victoria have been increasing at a very
high rate along with the number of students attending these schools. This has lead to more and
more of the expense for secondary school education in Victoria to be borne directly by the
parents of the students. The ratio of the cost of secondary education to the cost of university
education is significantly higher than observed in other OECD nations due to the combination
of higher fees and a higher proportion of private school attendance. Thus the determinants of
these higher fees are an important subject for investigation.
From the hedonic price study we have found that private school fees are a function of
performance as well as the spread of offerings. We find that higher fees are charged for
schools that have higher numbers of staff, with better university entrance scores, more music
17
and language offerings, are older, have other students from a higher socioeconomic
background and fewer students from non-English speaking backgrounds.
Future research planned with this data involves the research into possible implications
of the spatial aspects of the phenomena under study. We already observe that these schools
have a tendency to cluster in certain locations and we are now in a position to determine if their
relative positions can be used to model other aspects of the fee structures.
18
References
Beavis A., 2004, “Why parents choose public or private schools”, Research Developments, 12,
Article 3.
Buckingham, J., 2010, "The rise of religious schools", Center Independent Studies Policy
Monograph 111.
Cahill, R. and J. Gray, 2010, “Funding and Secondary School Choice In Australia: A
Historical Consideration”, Australian Journal of Teacher Education, 35, 121-138.
Dimkpah Y., M. Eseonu and U. Akpom, 2004, “The Impact of College Quality on Tuition: A
Hedonic Analysis”, Journal for Economic Educators, 4, 1-7.
Hartford J. and R. Marcus, 1986, “Tuition and US Private College Characteristics: The
Hedonic Approach”, Economics of Education Review, 5, 415-430.
ISCA , 2008, “Factors Affecting School Choice”, ISCA Research Report.
Le A. and P. Miller, 2003, “Choice of School in Australia: Determinants and Consequences”,
The Australian Economic Review, 36, 55-78.
OECD 2011, "Education at a galance, 2011 OECD Indicators",
www.oecd.org/publishing/corrigenda, 23rd March 2012.
Perry, L. amd A. McConney, 2010, “Does the SES of the School matter? An examination of
Socioeconomic Status and Student Achievement using PISA 2003”, Teachers College
Record, 112, 1137-1162.
Ryan, C. and L. Watson ,2010, “Choosers and losers: The impact of government subsidies on
Australian secondary schools”, Australian Journal of Education 54 86-107.
Schwartz A. and B. Scafidi, 2004, “What’s happened to the price of College? Quality-Adjusted
Net Price Indexes for Four-Year Colleges”, The Journal of Human Resources, 34, 723745.
Wilkinson, D., R. Denniss and A. Macintosh, 2004, "The Accountability of Private Schools to
Public Values", The Australia Institute Discussion Paper 71.
19
Appendix A: Data Descriptions
Mean
Std. Dev.
GIRLS_ONLY
0.2426
0.4299
BOYS_ONLY
0.1361
0.3439
MUSIC
10.9053
3.6827
SPORT
18.2722
7.6405
OTHER
17.4083
5.9356
BOARD
0.1420
0.3501
REGIONAL
0.2663
0.4433
SYSTEMIC
0.3965
0.4906
JEWISH
0.0296
0.1699
VCAL
0.4201
0.4950
APSV
0.0769
0.2673
AGSV
0.0533
0.2252
ACC
0.0651
0.2474
Table A.1 Descriptive statistics for the discrete variables used in the analysis.
Fees – Year 12
VCE-Options based on number of VCE
studies offered at unit 3 and 4 level at
school campus(es) in 2009: 1 up to 28
studies; 2 29-41 studies; 3 42-48 studies
and 4 49 of more VCE studies
Number students
IB available
Boarding available
Boys only
Girls only
Catholic
Islamic
Jewish
Creek
Catholic
Sport options
Music options
Other options
Destinations: Uni, Tafe, Work (%)
Year 7-12
Year prep-12
Year past prep – 12
Year 10-12
University offers (2009/10)
Tafe/VET offers (2009/10)
University offers (2008/09)
Tafe/VET offers (2008/09)
Good Schools Guide Victoria 2011
On Track data (VTAC)
20
Number of Students enrolled in at least
one VCE unit at level 3-4 in 2010
Number of Student enrolled in a VET
certificate in 2010
Percent of study scores of 40 and over
Median VCE study score
Percent Language other than English
Attendance
ICSEA
Number of Teachers
Number of Support Staff
Read7
Write7
Spell7
Grammar7
Math7
School Associations:
ASPV
AGSV
GV
ACC
ACOED
BAS
CAS
Sandhurst
EID
GIS
SIS
Region:
Cental
East
Melbourne
North
North-East
North-West
Regional
South-East
South-West
West
Other data:
Age of School
Post Code
Accredited for Overseas Students
VCAL is offered
www.exfin.com
My School 2
School websites
21
Appendix 2: Membership in School Associations
Associated Public Schools of Victoria (apsv)
The association was established in 1908 so that students of the member schools could compete
against each other on the sporting fields.
Brighton Grammar; Carey Baptist Grammar; Caulfield Grammar; Geelong College; Geelong
Grammar; Haileybury; Melbourne Grammar; St Kevins; Scotch; Wesley; Xavier
Associated Grammar Schools of Victoria (agsv)
Established in 1920 for the purposes of playing sport.
Assumption College; Camberwell Grammar; Ivanhoe Grammar; Marcellin College; Mentone
Grammar School; The Peninsula School; Penleigh and Essendon Grammar School; Trinity
Grammar; Yarra Valley Grammar.
Girls Sport Victoria (gv)
Established in 2001.
Camberwell Girls; Fintona Girls; Firbank Grammar; Genazzano FCJ College; Ivanhoe Girls;
Korowa Anglican Girls; Lauriston Girls; Loreto Mandeville; Lowther Hall; Melbourne Girls
Grammar; Mentone Girls Grammar; MLC; Our Lady of Mercy college; PLC; Ruyton; Sacre
Couer; St Catherines; St Margarets; Shelford Girls; Sienna College; Star of the Sea;
Strathcona; Toorak College
Associated Catholic Colleges (acc)
Established 1948 to provide boys’ colleges inter-College sport competitions.
Christian Brothers college; De La Salle College; Mazenod College; Parade College; Se Bedes
College; St Bernards College; St Josephs College; Emmanuel College; Salesian College;
Simmonds Catholic College; Whitefriars College
Association of Co-education Schools (acoed)
Formed in 1997.
Loyola College; Overnewton Anglican; St Leonards; St Michaels; Thomas Carr; Westbourne
Grammar
Ballarat Associated Schools (bas)
It is a group of schools in Ballarat, that provides the basis for interschool sporting competition
Ballarat and Clarendon College; Ballarat and Queens Anglican Grammar School; Ballarat High
School; Damascus College; Loreto College; St Patricks College
Catholic All Schools Sports Association (CAS)
Formed in 1996 and provides the basis for interschool sporting and other competitions between
a group of Catholic schools.
Academy of Mary Immaculate, Fitzroy; Aquinas College, Ringwood; Catholic Regional
College, Drysdale; Catholic Regional College, Melton; Catholic Regional College, North
Keilor; Catholic Regional College, St. Albans; Catholic Regional College, Sydenham;
Emmanuel College, Warrnambool; FCJ College Benalla; Galen College, Wangaratta; Lavalla
College; MacKillop College, Swan Hill; MacKillop College, Werribee; Marcellin College,
Bulleen; Marian College, Ararat; Marian College, Myrtleford; Mater Christi College, Belgrave;
McAuley College, Dooboobetic; Mercy Diocesan College, Coburg; Mercy Regional College,
Camperdown; Mount Lilydale Mercy College, Mount Lilydale; Nagle College, Bairnsdale;
Nazareth College, Noble Park North; Our Lady of Mercy College, Heidelberg; Penola Catholic
22
College, Broadmeadows;Sacred Heart College, Geelong; Sacred Heart College, Kyneton;
Sacred Heart College, Yarrawonga; Santa Maria College, Northcote; St Augustine's College,
Kyabram; St Brigid's College, Horsham St Joseph's College, Ferntree Gully; St Joseph's
College, Mildura; St Joseph's College, Geelong; St Mary's College (Seymour); St Monica's
College, Epping; St Patrick's College, Ballarat; St Peter's College, Cranbourne; Thomas Carr
College, Tarneit; Trinity College, Colac
Sandhurst Secondary Schools Sports Association (part of CAS)
Catholic College Bendigo; Catholic College, Wodonga; Notre Dame College, Shepparton; St
Joseph's College, Echuca; St Mary of the Angels College, Nathalia; Monivae college
Eastern Independent Schools of Melbourne (eisd)
Independent schools' sporting competition in the eastern region of Melbourne
Alphington Grammar School; Aquinas College; Bialik College; Billanook College; Donvale
Christian College; Eltham College; Emmaus College; Huntingtower School; Kilvington
Grammar; The King David School; />College; Knox School; Luther College; Mt. Lilydale Mercy
College; Mt. Scopus Memorial College; Nunawading Christian College; Oakleigh Greek
Orthodox College; Oxley College; Plenty Valley Christian College; Rudolf Steiner School; St.
Joseph's College; Tintern Schools
Gippsland independent Schools (gis)
Gippsland Independent Schools is an association of schools in Gippsland, Victoria, Australia.
The association organises many inter-school extracurricular competitions.
Beaconhills College; Chairo Christian School; Gippsland Grammar; Marist-Sion College;
Mary Mackillop College; Regional College; Newhaven; Presentation; St Pauls Anglican
Grammar School
23