Tài liệu ECONOMIC DEVELOPMENT & POVERTY REDUCTION STRATEGY 2008 - 2012 pdf
Bạn đang xem bản rút gọn của tài liệu. Xem và tải ngay bản đầy đủ của tài liệu tại đây (2.79 MB, 166 trang )
U
B
U
M
W
E
-
U
M
U
R
I
M
O
-
G
A
K
U
N
D
A
I
G
I
H
U
G
U
R
E
P
U
B
U
L
I
K
A
Y
’
U
R
W
A
N
D
A
THE REPUBLIC OF RWANDA
ECONOMIC DEVELOPMENT &
POVERTY REDUCTION STRATEGY
2008 - 2012
September 2007
CONTENTS
CONTENTS
ACRONYMS
GLOSSARY
EXECUTIVE SUMMARY i
1 INTRODUCTION 1
2 WHERE IS RWANDA NOW? 5
2.1 Economic growth has slowed, population growth continues to be rapid and the environment is under stress 5
2.2 Poverty has fallen, but needs to fall faster to meet the MDG and Vision 2020 targets 12
2.3 Key indicators show that health has improved substantially, but inequalities in health outcomes persist. 18
2.4 Access to secondary education lags behind primary, but tackling quality aspects of primary education are
also a high priority 21
2.5 Governance reforms are well advanced, but much remains to be done 25
2.6 Implications for the EDPRS 28
3 WHERE DOES RWANDA WANT TO BE IN 2012? 29
3.1 Implicit targets for the Millennium Development Goals in 2012 29
3.2 Targets for Rwanda Vision 2020 33
3.3 Targets for the EDPRS in 2012 33
4 WHAT DOES RWANDA DO TO GET THERE? 46
4.1 The Growth for Jobs and Exports agship programme 48
4.2 The Vision 2020 Umurenge Flagship Programme 71
4.3 The Governance agship programme 77
4.4 Complementary sectoral interventions to achieve the EDPRS targets 91
5 HOW DOES RWANDA GET IT DONE ? 102
5.1 Implementation framework for the EDPRS 102
5.2 Align individual incentives to planning priorities 103
5.3 Extend and consolidate the process of decentralisation 104
5.4 Flagship programmes will strengthen inter-sectoral coordination 105
5.5 Improve public nancial management 108
5.6 Promote greater harmonisation and alignment of donors with the EDPRS priorities 109
5.7 Assign a greater role in policy implementation to markets and the Private Sector 111
5.8 Implementation issues at sectoral level 112
5.9 Effective implementation requires good communication 118
6 HOW MUCH WILL IT COST AND WHAT ARE THE MACROECONOMIC IMPLICATIONS? 119
6.1 EDPRS costs 119
6.2 Sector allocation of EDPRS costs 122
6.3 EDPRS nancing requirements 124
6.4 Summary of costs and nancing ows 126
6.5 Possible nancing methods 127
6.6 Macroeconomic implications 129
7 HOW WILL RWANDA KNOW IT IS GETTING THERE? 133
7.1 The institutional framework of monitoring 133
7.2 The EDPRS indicator system 133
7.3 Implications for the statistical system 143
7.4 Evaluation of EDPRS interventions 144
APPENDIX 1: APPENDIX TO CHAPTER 1 146
APPENDIX 2: APPENDIX TO CHAPTER 2 148
REFERENCES 154
FIGURES
Figure 1.1 EDPRS Coordination Mechanism 3
Figure 2.1 Poverty and population density 9
Figure 2.2 holdings in 2000/01 (EICV1) and 2005/06 (EICV2) 10
Figure 2.3 Increase in Cultivated Area (ha) and Yield (kg/ha), 2000-2005 (Average Percent change) 11
Figure 2.4 Changes in poverty at regional and national level (poor people as a % of the population) 15
Figure 2.5 Gini coefcient of inequality in the African context 16
Figure 2.6 Food insecurity (% of food insecure households by food economy zone 18
Figure 2.7 Framework for decentralised accountability 26
Figure 4.1 Pro-poor growth anchored in good governance 47
Figure 5.1 EDPRS and planning linkages 103
Figure 5.2 Planning and reporting tools for implementing the EDPRS 104
Figure 5.3 Coffee Washing Stations – a critical path analysis 107
Figure 5.4 Central Government Imihigo 108
Figure 6.1 Public spending to induce private investment 121
Figure 6.2 Public and private investment to achieve EDPRS targets 122
Figure 6.3 Summary debt sustainability 129
Figure 7.1 Indicators form a causal chain 135
Figure 7.2 EDPRS indicators and sector logframes 141
Figure 7.3 Trafc light reports to monitor progress towards sectoral EDPRS objectives 142
TABLES
Table 2.1 Trend real growth rate by activities (5-year averages in percent) 6
Table 2.2 Poverty headcount (share of population and number) 13
Table 2.3 Own distribution of poor by categories 13
Table 2.4 Major causes of poverty identied 14
Table 2.5 Childhood mortality (per 1,000 live births) and MMR (per 100,000 births) 18
Table 3.1 Progress against Rwanda Vision 2020 targets and Millennium Development Goals 30
Table 3.2 Targets for the EDPRS in 2012) 45
Table 4.1 The growth diagnostic approach applied to Rwanda 49
Table 4.2 Investment climate: Key factors for foreign investors 50
Table 4.3 Infrastructure costs in Rwanda compared to neighbouring countries 51
Table 4.4 Priority Export Actions 55
Table 4.5 Summary growth agship 71
Table 4.6 Summary of the VUP agship 76
Table 4.7 Summary of governance agship 89
Table 6.1 EDPRS costs, in billion RWF 120
Table 6.2 EDPRS costs, in USD per capita 120
Table 6.3 Proposed shares of public expenditure by sector for the EDPRS period 2008-2012
(in billion Rwandan francs, unless otherwise indicated) 123
Table 6.4 Public nancing of EDPRS 125
Table 6.5 EDPRS costs and nancing, in percent of GDP 126
Table 6.6 EDPRS costs and nancing, in USD per capita 127
Table 6.7 Possible nancing methods 128
Table 6.8 Selected economic and nancial indicators, 2007-2012 130
Table 7.1 EDPRS Strategic Outcome Indicators 136
Table 7.2 EDPRS Intermediate Indicators 137
Table 7.3 EDPRS Summary Policy Matrix 138
Table 7.4 EDPRS Second Generation Indicators 140
AfDB African Development Bank
AIDS Acquired Immune Deciency Syndrome
ART Antiretroviral Therapy
ARV Antiretroviral
BCC Behaviour Change Communication
BNR Banque Nationale du Rwanda
CDF Community Development Fund
CDLS District AIDS Committee
CEM Country Economic Memorandum (World Bank)
CSO Civil Society Organisation
DAC Development Assistance Committee
DDP District Development Plan
DfID Department for International Development
DHS Demographic and Health Survey
EDPRS Economic Development and Poverty Reduction Strategy
EICV Enquête Intégrale sur les Conditions de Vie des Ménages (Households Living
Conditions Survey)
EMS Expenditure Management System
GoR Government of Rwanda
HIDA Human Resources and Institutional Capacity Development Agency
HIMO Haute Intensité de Main-d’Oeuvre (Labour-Intensive Public Works)
HIV Human Immunodeciency Virus
HLI Higher Learning Institution/s
ICT Information and Communication Technology
IMNCI Integrated Management of Neonatal and Childhood Illnesses
IMR Infant Mortality Rate
JESPOC Youth, Sports and Culture
JSR Joint Sector Reviews
KIST Kigali Institute of Science and Technology
M&E Monitoring and Evaluation
MDG Millennium Development Goal
MFIs Micronance institutions
MIFOTRA Ministry of Public Service, Skills Development, Vocational Training and Labour
MINAFFET Ministry of Foreign Affairs and Cooperation
MIJESPOC Ministry for Youth, Sport and Culture
MINAGRI Ministry of Agriculture
MINALOC Ministry of Local Government, Community Development and Social Affairs
MINECOFIN Ministry of Finance and Economic Planning
ACRONYMS
MINEDUC Ministry of Education
MINICOM Ministry of Commerce, Industry, Investment Promotion, Tourism and Cooperatives
MINIJUST Ministry of Justice
MININTER Ministry of Internal Affairs
MINITERE Ministry of Lands, Human Resettlement and Environmental Protection
MININFRA Ministry of Infrastructure
MINISTR Ministry of Science, Technology and Scientic Research
MINSANTE Ministry of Health
MIS Management Information System
MMR Maternal Mortality Rate
MTEF Medium Term Expenditure Framework
NAPPYE National Action Plan Promoting Youth Employment
NGO Non-Governmental Organisation
NICI National Information and Communications Infrastructure
NISR National Institute of Statistics, Rwanda
NPV Net present value
NSS National Security Service
NYC National Youth Council
OBL Organic Budget Law
OCIR Cafe Rwandan Coffee Authority
OECD Organisation for Economic Cooperation and Development
OGMR Ofce de Géologie et des Mines du Rwanda
ORTPN Ofce Rwandais du Tourisme et des Parcs Nationaux
OTC Over The Counter
OVC Orphaned and Vulnerable Children
PEFA Public Expenditure and Financial Accountabilit y
PFM Public Financial Management
PLHIV People Living With HIV (including AIDS)
PMTCT Prevention of mother to child transmission of HIV
PNV Parc National des Volcans
PRSP Poverty Reduction Strategy Paper
PTA Parent Teacher Association
RDSF Rwanda Decentralisation Strategic Framework
REMA Rwanda Environment Management Agency
RIAM Rwanda Institute of Administration and Management
RIEPA Rwanda Investment and Export Promotion Agency
RIPA Rwanda Investment Promotion Agency
RRA Rwanda Revenue Authority
RWF Rwandan Francs
SFAR Student Financing Agency of Rwanda
SFB School of Finance and Banking
SME Small and Medium Enterprises
STI Science, Technology and Innovation
STIR Science, Technology and Innovation for Results
SWAp Sector-Wide Approach
TB Tuberculosis
TIG Travaux d’Interêt Général
TNA Training Needs Assessment
TSC Teacher Service Commission
TSC Technical Steering Committee
TVET Technical and Vocational Education and Training
U5MR Under-ve Mortality Rate
UBPR Union des Banques Populaires du Rwanda
UN United Nations
UNCTAD United Nations Conference on Trade and Development
UNDP United Nations Development Programme
USD US Dollar
VAT Value Added Tax
VCT Voluntary Counselling and Testing
WATSAN Water and Sanitation Sector
YFC Youth Friendly Centres
GLOSSARY
Abunzi Mediators
Akagari Cell
Biragenda neza On track
Bikeneye gukurikiranwa Too early to tell/needs follow-up
Gacaca Community courts
Girinka One cow per poor household programme
Imihigo Performance contracts
Ingando Solidarity camps
Jumelage Twinning with other institutions
Ntibigenda neza Off track
Tronc commun Lower secondary school level
Ubudehe Community-based participatory approach
Umudugudu/imidugudu Village/s
Umuganda Community work
Umurenge/imirenge Sector/s
FOREWORD
I
t is my great pleasure to present the Economic Development and Poverty Reduction
Strategy (EDPRS), the Government of Rwanda’s medium-term strategy for economic
growth, poverty reduction and human development, covering the period 2008 to 2012.
EDPRS is our second medium-term strategy towards attainment of the long-term Rwanda
Vision 2020 objectives. The first strategy was elaborated towards the end of the emergency
period, when we were still recovering from the eects of the war and genocide of 1994. Our
main concerns were for securing the nation, rebuilding the economy, growing enough food,
building roads, providing housing, educating our children, providing health care and ensuring
justice was done.
It is now 2007, and Rwanda has come a long way. We are a stable nation, on the path to
achieving better lives for each and every one of our citizens. We have made great achieve-
ments in human development, particularly in the areas of health and education. We are mak-
ing strides towards improving economic governance, through the decentralisation of public
service delivery and the involvement of the private sector in both decision making and policy
implementation.
The Government of Rwanda has been working on the elaboration of the EDPRS for the past
eighteen months. This extensive process of consultation has involved stakeholders from across
Government and our domestic and international partners, including donors, civil society and
the private sector.
Participation at grass-root levels was ensured through various consultations with citizens.
The EDPRS aims to consolidate and extend the strong achievements in human development
while promoting three flagship programmes: Sustainable Growth for Jobs and Exports, Vision
2020 Umurenge (integrated rural development programme to eradicate extreme poverty and
release the productive capacities of the poor), and Good Governance. The flagships are the
means through which we are prioritising public spending and improving coordination across
sectors, to achieve the joint goals of stronger growth, faster poverty reduction and a better
governed Rwanda.
EDPRS is a forward-looking service delivery agreement between the Government and the
people of Rwanda. I am proud to introduce this Strategy as written by and for the Rwandan
people. As we move into the period of implementation, we look forward to achieving our
overarching goal of a happier and more prosperous nation for all of us.
James Musoni
Minister of Finance and Economic Planning
September 2007
EXECUTIVE SUMMARY
Rwanda’s Economic Development and Poverty Reduction Strategy (EDPRS) provides a me-1.
dium term framework for achieving the country’s long term development aspirations as embod-
ied in Rwanda Vision 2020, the seven year Government of Rwanda (GoR) programme, and the
Millennium Development Goals.
The strategy builds on strong achievements in human capital development and promotes three 2.
agship programmes. These agships serve as a means to prioritise actions by the GoR, mobi-
lise resources for development and improve policy implementation through more co-ordinated
interventions across sectors.
The rst agship, Sustainable Growth for Jobs and Exports, will be driven by an ambitious, high 3.
quality public investment programme aimed at systematically reducing the operational costs of
business, increasing the capacity to innovate, and widening and strengthening the Financial Sec-
tor. This means heavy investment in “hard infrastructure” by the GoR to create strong incentives
for the Private Sector to increase its investment rate in subsequent years. The second agship,
Vision 2020 Umurenge, will accelerate the rate of poverty reduction by promoting pro-poor
components of the national growth agenda. This will be achieved by releasing the productive
capacity of the poor in rural areas through a combination of public works, promotion of coopera-
tives, credit packages and direct support. Finally, the third agship, governance provides an an-
chor for pro-poor growth by building on Rwanda’s reputation as a country with a low incidence
of corruption and a regional comparative advantage in “soft infrastructure”.
In order to implement the EDPRS strategy, the sectoral allocation of public expenditure will be 4.
distributed to maintain momentum in the social sectors – education, health and water and sanita-
tion – while also targeting agriculture, transport and Information and Communication Technol-
ogy ICT, energy, housing and urban development, good governance and rule of law, proper land
use management and environmental protection.
In agriculture, the main programmes include the intensication of sustainable production sys-5.
tems in crop cultivation and animal husbandry; building the technical and organisational capaci-
ty of farmers; promoting commodity chains and agribusiness, and strengthening the institutional
framework of the sector at central and local level.
Environmental and land priorities involve ecosystems, the rehabilitation of degraded areas and 6.
strengthening newly established central and decentralised institutions. Special attention will be
paid to sustainable land tenure security through the planning and management of land registra-
tion and rational land use, soil and water conservation, reforestation, preservation of biological
diversity and adaptation and mitigation against the impact of climate change.
In education and skills development, the emphasis is on increasing the coverage and the quality 7.
of nine year basic education, strengthening Technical and Vocational Education and Training
(TVET), and improving the quality of tertiary education.
i
EDPRS 2008 - 2012
EDPRS 2008 - 2012
The concerted effort to build scientic capacity will be based on the objectives of knowledge 8.
acquisition, and deepening, knowledge creation through scientic research, knowledge transfer
and developing a culture of innovation, in particular, protecting intellectual property.
In infrastructure, the objectives are to reduce transport costs within the country and between 9.
Rwanda and the outside world, and to ensure security of energy supplies by increasing domestic
energy production from several sources. Efforts will be made to promote investment in, and the
growth of, the Information and Communications Technology industry. In meteorology, the aim is
to provide a wide range of timely, high quality information to different groups of users.
The habitat sub-sector will develop planning tools for restructuring the country’s settlement 10.
patterns, consistent with the rural and urban land use and environment protection schemes, and
develop and implement master plans for new urban residential zones and imidugudu sites.
In addition to reducing the costs of doing business, the GoR will promote competitiveness and 11.
Private Sector development through capacity building initiatives, credit schemes and Business
Development Services (BDS). In manufacturing, the GoR will promote value addition in existing
product lines in agro-processing, including coffee and tea, handicrafts and mining, and develop-
ment of new products including silk, pyrethrum, hides and skins and owers. The GoR will also
provide incentives for foreign direct investment and create industrial parks and export processing
zones.
The Service Sector is fundamental for the transition towards a knowledge-based society. The 12.
GoR will exploit the country’s potential comparative advantages in nancial services, tourism,
transport and logistics. The Financial Sector will be opened up further to foreign capital, modern
and dynamic management and technologies. The GoR will promote tourism opportunities by
improving tourism infrastructure and services, creating more attractions, including eco-tourism
and cultural sites, encouraging private sector investment, better marketing and forming regional
and international links.
In health, the objectives are to maximise preventative health measures and build the capacity to 13.
have high quality and accessible health care services for the entire population in order to reduce
malnutrition, infant and child mortality, and fertility, as well as control communicable diseases.
This includes strengthening institutional capacity, increasing the quantity and quality of human
resources, ensuring that health care is accessible to all the population, increasing geographical ac-
cessibility increasing the availability and affordability of drugs, improving the quality of services
in the control of diseases and encouraging the demand for such services.
High population growth is a major challenge facing Rwanda. Slowing down population growth 14.
requires innovative measures, including the strengthening of reproductive health services and
family planning and ensuring free access to information, education and contraceptive services.
The Water and Sanitation Sector aims to ensure sustainable and integrated water resources man-15.
agement and development for multipurpose use including increased access for all to safe water
and sanitation services.
ii
EDPRS 2008 - 2012
EDPRS 2008 - 2012
In social protection, the objective is to achieve effective and sustainable social protection for the 16.
poor and vulnerable. The sector will provide social assistance to the most needy while supporting
the able-bodied to progress out of extreme vulnerability and poverty into more sustainable means
of self-support. To achieve this, a single, coherent strategy is being designed, and joint funding
arrangements sought, to replace the current plethora of small programmes in this area.
Special attention is also given, in the EDPRS, to the challenges and opportunities facing young 17.
people, in order to strengthen the youth’s participation in the social, economic and civic develop-
ment of Rwanda.
The objectives in governance include maintaining peace and security through defence against 18.
external threats and participation in peace keeping missions, preserving and strengthening good
relationships with all countries, continuing to promote unity and reconciliation among Rwan-
dans, pursuing reforms to the justice system to uphold human rights and the rule of law, and
empowering citizens to participate and own their social, political and economic development in
respect of rights and civil liberties including freedom of expression.
The governance programme puts emphasis on supporting the development of “soft infrastruc-19.
ture” for the Private Sector through implementing the commercial justice, business and land
registration programmes, improving economic freedom, improving the regulatory and licensing
environment for doing business, andpromoting principles of modern corporate governance. The
programme covers a wide range of public sector reforms which include strengthening decen-
tralisation and enhancing accountability at all levels of government, enhancing Public Sector
capacity, strengthening public nancial management and improving procurement, institutionalis-
ing performance-based budgeting and increasing the transparency and predictability of policy-
making.
The EDPRS incorporates a number of cross-cutting issues (CCIs) which include gender, HIV, the 20.
environment, social inclusion and youth. Wherever possible, issues relating to CCIs have been
integrated into the discussion of sectoral policies and programmes.
Experience from the rst PRSP (2002-2005) showed that progress was achieved in some areas, 21.
but implementation problems held back progress in others. Measures are in place to ensure that
implementation of the EDPRS proceeds more smoothly and consistently. Greater efciency can
be achieved by improving incentives to execute policy and by relaxing the constraints which pre-
vent policies from being carried out. To this end, a variety of measures are being implemented,
including public administration reforms to promote accountability, measures aimed at achieving
a closer alignment between donors and EDPRS priorities, a greater role for markets and the Pri-
vate Sector, and improved monitoring systems at sectoral and district levels.
The implementation of the EDPRS will require 22. RWF 5,151 billion over the ve years 2008-2012.
This amount includes public recurrent expenditure, public capital expenditure and private invest-
ment. The public component amounts to RWF 3,434 billion and represents two-thirds of the total
cost of EDPRS. The extra public nancing requirement is RWF 352 billion, equivalent to USD
700 million over 2008-2012, or an average of USD 140 million per year.
iii
iv
EDPRS 2008 - 2012
EDPRS 2008 - 2012
The EDPRS mainstreams a system of monitoring and evaluation at national, sub-national and 23.
sectoral levels to improve Public Sector performance. This document proposes an indicator sys-
tem of four linked matrices which can be used by domestic stakeholders to monitor national
development (the EDPRS), by external stakeholders to exercise accountability for grants and
loans (Performance Assessment and Policy Matrix), and, to a limited extent, by sector special-
ists to track performance over a rolling three year budget period (the Medium Term Expenditure
Framework).
iii
iv
EDPRS 2008 - 2012
EDPRS 2008 - 2012
INTRODUCTION
1.1 Rwanda’s Economic Development and Poverty Reduction Strategy (EDPRS) is both a docu-
ment and a process. As a document, the EDPRS sets out the country’s objectives, priorities and
major policies for the next ve years (2008-2012). It provides a road map for government, develop-
ment partners, the Private Sector and civil society and indicates where Rwanda wants to go, what it
needs to do to get there, how it is going to do it, what the journey is going to cost and how it will be
nanced. The strategy provides a medium term framework for achieving the country’s long term de-
velopment goals and aspirations as embodied in Rwanda Vision 2020 (Republic of Rwanda, 2000),
the seven year Government of Rwanda programme, and the Millennium Development Goals.
1.2 The EDPRS breaks with the past in two ways. Firstly, the strategy redenes the country’s
priorities. Rwanda’s rst Poverty Reduction Strategy Paper (PRSP) covered the period 2002-2005.
It was elaborated in a post-conict environment where the primary emphasis was on managing a
transitional period of rehabilitation and reconstruction. Having made considerable progress during
this transition, it is time to take stock and reassess the importance of different policy objectives. Sec-
ondly, this strategy document advocates a different way of doing things in Rwanda. In particular, it
makes the case for consolidating and extending the decentralisation of public spending when accom-
panied by robust accountability mechanisms. The EDPRS also recognises the key role of the Private
Sector in accelerating growth in order to reduce poverty.
1.3 The priorities of the strategy are embodied in three agship programmes: sustainable Growth
for Jobs and Exports, Vision 2020 Umurenge and governance. The EDPRS assigns the highest pri-
ority to accelerating growth to create employment and generate exports. It will achieve this through
an ambitious, high quality public investment programme aimed at reducing the operational costs of
business. This big push will create strong incentives for the Private Sector to increase its invest-
ment rate in subsequent years. With two thirds of the population aged less than twenty-ve years,
particular emphasis will be placed on creating jobs for young people. Vision 2020 Umurenge is a
1
EDPRS 2008 - 2012
EDPRS 2008 - 2012
highly decentralised integrated rural development programme designed to accelerate extreme pov-
erty reduction in Rwanda. It is currently being piloted in thirty of the poorest sectors (imirenge) of
the country. Governance seeks to build on Rwanda’s reputation as a country with a low incidence
of, and zero toleration for corruption and that has initiated innovative home-grown mechanisms
for conict resolution, unity and reconciliation. In the next ve years, Rwanda plans to develop a
regional comparative advantage in ‘soft infrastructure’, that is, those aspects of governance, such as
well-dened property rights, efcient public administration, transparency and accountability in s-
cal and regulatory matters.
1.4 Viewed as a process, the EDPRS has involved extensive consultation over a period of 18
months with a wide range of stakeholders at both central and local government levels. A national
coordination structure was put in place to oversee the elaboration process (Figure 1.1). The process
was led by the National Steering Committee (NSC), comprised of Ministers and Governors, which
provided high-level guidance such as on how to prioritise between sectors. The NSC was supported
by a Technical Steering Committee (TSC), made up of Secretaries General, Executive Secretaries
from Provinces, and representatives of donors, civil society and the Private Sector. The TSC played
the principal coordinating role for the EDPRS, pulling together the work of the different Sector
Working Groups and making high level recommendations to the National Steering Committee as
appropriate.
1.5 Nineteen sector working groups (SWGs) and Cross-Cutting Issues (CCIs) teams were in-
volved, comprising stakeholders from central and local government, donors, civil society organisa-
tions and the private sector, and organised around four clusters (Growth, Rural Development, Human
Development and Governance). These clusters are an implementation mechanism to improve cross-
sectoral coordination. Each SWG is chaired by a Lead Government Institution and co-chaired by a
Lead Donor. A multidisciplinary group managed the ve cross-cutting issues. Appendix 1 provides
details on SWG and CCI team membership. Local government engagement with EDPRS occurred
through ve Steering Committees (four Province plus Mairie Ville de Kigali, MVK), comprising
Executive Secretaries, District Staff representatives, local civil society organisations (CSOs) and the
Private Sector, each of which was represented in each SWG. Grass-roots participation in EDPRS oc-
curred through nation-wide consultations at the cell (akagari) level, which were compiled at sector
(umurenge) and district levels, and fed into the work of the SWGs.
2
EDPRS 2008 - 2012
EDPRS 2008 - 2012
Figure 1.1 EDPRS Coordination Mechanism
1.6 The EDPRS was elaborated in three distinct phases. The rst phase involved self-evaluations
of the PRSP1 conducted by each sector working group and each District, together with an inde-
pendent evaluation conducted by external consultations. Emerging priorities from these evaluations
informed the 2007 budget elaboration. In addition, based on these assessments, each sector subse-
quently set higher level objectives and targets for EDPRS as well as the means of achieving them
through a logical framework exercise and a costing exercise.
1
Finally, each sector was required to
produce a summary strategy statement, which was compiled into the
EDPRS document by the Ministry of Finance and Economic Planning, under the direction of the
Steering Committees.
1.7 The EDPRS is set out as follows. Chapter 2 provides a summary of what Rwanda has achieved
to date in terms of recent growth performance, poverty reduction, human development and gover-
nance reform. It identies the major challenges to be faced in the next ve years and draws lessons
from the PRSP for the EDPRS.
1.8 Chapter 3 offers a vision of where Rwanda could be in 2012. This provides a sense of direc-
tion for the EDPRS, while ensuring that the vision is anchored to reality via a set of detailed sectoral
targets which have been carefully costed.
1.9 Chapter 4 explains the role of the agship programmes as a means to prioritise actions by
the GoR, mobilise resources for development and improve policy implementation through more co-
ordinated interventions across sectors. This is followed by a detailed description of the sectoral and
cross-cutting actions required to reach the EDPRS targets.
National Steering Committee
Technical Steering Committee
Themes: Growth Rural development Human development Governance
Sector Agriculture Environment
Working Groups: & &
animal husbandry land use management
Province and District Steering Committees
3
1. The logical frameworks are published in EDPRS Volume II.
EDPRS 2008 - 2012
EDPRS 2008 - 2012
1.10 Chapter 5 addresses the challenges of implementing the strategy. It argues that the risks of
implementation failure can be reduced by providing incentives to execute policy and by relaxing the
constraints which prevent policies from being carried out. Concrete proposals are made for how this
could be done.
1.11 Chapter 6 answers two questions: how much will the EDPRS cost, and how will it be
nanced? The answers are derived from a macroeconomic programming exercise.
1.12 Chapter 7 discusses how the EDPRS might be monitored and evaluated. An indicator system
of four linked matrices is proposed which can be used by domestic stakeholders to monitor nation-
al development (EDPRS), by external stakeholders to exercise accountability for grants and loans
(Performance Assessment and Policy Matrix), and, to a limited extent, by sector specialists to track
performance over a rolling three year budget period (Medium Term Expenditure Framework). This
framework is exible and can be shaped to accommodate reporting requirements to both domestic
and international stakeholders.
4
EDPRS 2008 - 2012
EDPRS 2008 - 2012
2. WHERE IS RWANDA NOW?
2.1 This chapter reviews the main features of Rwanda’s recent socio-economic performance and
the lessons learnt from the PRSP (2002-2005). Its purpose is to provide a context for elaborating de-
velopment policy in the medium term. This chapter draws on the National Population and Housing
Census and a variety of household surveys.
2
These include the rst and second Integrated House-
hold Survey on Living Conditions (Enquête Intégrale sur les Conditions de Vie des Ménages, EICV)
(NISR, 2006, MINECOFIN, 2007b), Demographic and Health Survey (DHS) (NISR, 2005), the
Comprehensive Food Security and Vulnerability Analysis (CFSVA) (NISR and World Food Pro-
gramme, 2006), and Ubudehe survey data (MINECOFIN, 2007a), which records the desires and
preferences of Rwandans.
3
The chapter also draws on the evaluation of PRSP1 (Evans et al., 2006,
MINECOFIN, 2006) and makes international comparisons. This analysis informs the priorities and
strategies of the EDPRS which are formulated in subsequent chapters.
2.1 Economic growth has slowed, population growth continues to be rapid
and the environment is under stress
2.2 In the aftermath of the genocide and associated conicts (1996-2000), real GDP grew at over
10% per year as the economy recovered from a low base. This was followed by a period of stabilisa-
tion (2001-2006) during which real growth fell to an annual rate of 6.4% (Table 2.1). On the demand
side, growth has been driven predominantly by increases in private consumption. This is relevant for
the discussion of poverty trends in section 2.2 because the principal poverty measure is consumption-
based.
4
On the supply side, there was a structural shift in the economy as the Service Sector replaced
agriculture as the major contributor to increases in output. However, agriculture (and food crops in
particular), remains a major component of GDP and provides most employment.
4
5
EDPRS 2008 - 2012
EDPRS 2008 - 2012
2. Household surveys are a way of collecting representative, reliable and independent data. Household surveys help governments by:
providing data for evidence-based policy-making; providing information on users and non-users of services; setting baselines for policies;
monitoring implementation; and evaluating results.
3. Ubudehe is a traditional practice and culture of collective action to solve community problems. It has been adopted by the GoR as an ap-
proach to ght poverty. It is present in 9,000 cells all over the country. The 2006 Ubudehe survey results suggest it should be a core method
of the government’s approach to ghting poverty because it is embedded in Rwandan mind sets and is seen as an approach that benets the
poor, primarily through increasing access to livestock, promoting social capital and unication, increasing participation in planning and
decision-making, and empowering the poor and women (MINECOFIN, 2007a).
4. The poverty measure is calculated from survey data on household consumption expenditure. The consumption aggregate computed in
the National Accounts is broadly consistent with the gure which is generated by ‘inating’ the survey data consumption expenditure to
national level.
Table 2.1 Trend real growth rate by activities (5-year averages in percent)
Share of total GDP Average Annual
growth
1996-2000 2001-2006 1996-2000 2001-2006
Gross Domestic Product (GDP) 100.0 100.0 10.8 6.4
Agriculture 37.7 36.4 9.5 4.8
Food crop 31.9 31.4 9.9 5.1
Export Crop 1.0 1.1 11.7 6.3
Livestock 3.0 2.2 7.8 3.5
Forestry 1.5 1.3 10.7 3.7
Fisheries 0.3 0.4 29.9 3.7
Industry 15.1 14.2 7.5 8.1
Mining and quarrying 0.3 0.6 24.5 41.3
Manufacturing 8.2 6.8 4.1 6.0
Of which: Food 1.5 1.7 8.1 9.1
Beverages, tobacco 4.2 2.5 -4.4 4.6
Others 2.4 2.7 19.5 6.5
Electricity, gas, water 0.6 0.5 11.3 4.2
Construction 6.0 6.3 11.9 9.6
Services 41.9 43.8 11.7 7.4
Wholesale & retail trade 10.7 9.7 2.2 6.0
Hotels and restaurants 0.8 0.9 25.2 6.6
Transport, storage, communication 4.8 6.0 15.5 9.4
Finance, insurance 2.6 3.5 17.7 13.3
Real estate, business services 10.3 9.6 11.2 5.0
Public administration, education, health 12.4 13.2 21.0 7.9
Other personal services 0.3 0.9 141.2 12.1
Adjustments 5.4 5.7 38.5 5.6
Less: Imputed bank service charge -1.6 -1.7 4.7 9.6
Plus: VAT and other taxes on products 7.0 7.4 23.4 6.4
Source: National Institute of Statistics data.
6
EDPRS 2008 - 2012
EDPRS 2008 - 2012
2.3 Gross xed capital formation has risen steadily as a proportion of GDP since 1996 (see Ap-
pendix 1: Figure A2.1). Since GDP growth rates have fallen since 2000, this implies that the pro-
ductivity of gross investment has declined in recent years.
5
The composition of gross investment as
between the public and private sectors has also changed over time. The share of public investment
fell steadily between 1997 and 2003 before rising in 2004 and 2005. The rising share of private in-
vestment from the late 1990s was a result of the government’s policies of extensive privatisation and
economic liberalisation.
2.4 The scal performance has improved over the last ve years, with revenue collection grow-
ing to around 13% of GDP in 2006.
6
The domestic scal decit has widened from around 2% of
GDP in 2001 to 6% in 2006.
7
Priority expenditure, which allocates resources to pro-poor needs,
8
has
increased over the past ve years. Rwanda has also beneted from both the Heavily Indebted Poor
Country (HIPC) and Multilateral Debt Relief (MDR) initiatives resulting in a sustainable debt posi-
tion, in which the net present value of debt to export ratio is less than 60%.
2.5 Rwanda has experienced strong trade performance with exports growing at an average of
12.5 % per year since 2001 (Appendix Figure 2). Rwanda’s exports reached an estimated US$152
million in 2006, more than twice the receipts generated in 2002. Coffee, tourism and tea have fuelled
this growth, accounting for 60% of the 2005 export numbers. Besides private Sector mobilisation, an
important driver of export growth has been the restructuring of front agencies (OCIR-Café, OCIR-
Thé, ORTPN), RIEPA (Rwanda Investment and Export Promotion Agency) and BRD. While this
performance is short of desired targets, it provides evidence that Rwanda can generate growth when
informed choices and timely action are made on specic export industries.
2.6 Due to the high capital requirements for Rwanda’s development, however, import growth
has been out stripping that for exports with an average increase of 15 % over the past ve years.
Therefore, we have seen a widening of the trade decit as a percentage of GDP from 8 % in 2001
to 12 % in 2006. Rwandan economic growth and development depends on the diversication of its
export product base in addition to the continuation of strong growth in exports.
2.7 Although a non-traditional export sector for Rwanda, tourism has the potential to contribute
signicantly to the country’s export base. Tourism receipts have exceeded expectations since the
development of the National Tourism Strategy and subsequent approval by Cabinet in 2002. From a
negligible base of a less than US$5 million in 2002, tourism receipts hit US$33 million in 2006 and
are on track to exceed this gure in 2007. Not only are there more international visitors coming to
Rwanda, but spend per day is also increasing, indicating a positive shift in Rwanda’s base of advan-
tage from basic to advanced factors such as service and a full destination experience.
2.8 The slackening in GDP growth is the result of the expansion of output in agriculture being
constrained by several factors. Land is scarce and the use of it is constrained by the absence of a
well-dened land administration system and poor settlement patterns in rural areas. There is a need
5. Or that the incremental capital-output ratio has risen.
6. National Institute of Statistics Rwanda (NISR) GDP estimates.
7. Revenue excluding grants minus current expenditure, domestically nanced capital expenditure, and net lending, excluding external interest.
Sourced from IMF (2007) MEFP Tables.
8.There have, however, been concerns among the GoR and development partners that the present denition of priority expenditure is too broad
and that a new classication of expenditures thought to be more directly poverty-reducing should be instituted.
7
EDPRS 2008 - 2012
EDPRS 2008 - 2012
to contain the fragmentation and degradation of further arable land as a result of high pressure and
soil erosion. The level of technology is low, infrastructure in rural areas is inadequate and human and
physical capital is in short supply. As a result, agricultural productivity is low which generates poor
returns on private investment.
2.9 Much needs to be done to improve rural roads and energy to support growth, as corroborated
by the Ubudehe survey, in which the roads network was identied as a top infrastructure priority. For
example, the proportion of roads in good condition has only risen from 4.7 to 6.4 and from 1.7 to 5%
respectively, implying that large sections of the population face immense transportation obstacles
to bring produce to markets, and more generally integrate into the national economy. The share of
public expenditure going to infrastructure is lower than neighbouring countries. Moreover, energy
remains very expensive in Rwanda, accounting for 14% of all non-food expenditure, though the pro-
portion is higher for poorer households. The high cost of energy results in almost 80% of the value of
fuel being obtained from biomass sources, such as rewood.
2.10 This situation is aggravated by continued rapid population growth resulting from an increase
in fertility combined with a decline in infant mortality.
9
The ensuing rise in population density has
put pressure on the physical environment and induced labour migration between rural areas as well
as from the countryside to the towns. A recent study found that ‘…the parts of the country that are in-
creasing their share of the population are those that previously had a lower population density. Umu-
tara and Kibungo, now in Eastern Province, had the smallest number of people per square kilometre
at the time of the census (2002), and have experienced the greatest increase in population share;
conversely, Ruhengeri, now largely in Northern Province, and the City of Kigali had high population
density in 2002 and are now seeing a reduction in their share of the overall population’ (NISR, 2006).
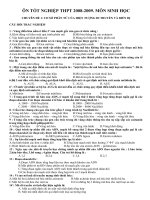
The positive association between population density and poverty incidence in Rwanda is shown in
Figure 2.1.
9. These demographic changes are analysed in section 2.3
8
EDPRS 2008 - 2012
EDPRS 2008 - 2012
Figure 2.1 Poverty and population density
2.11 Natural population growth, together with the increased numbers of returnees from neigh-
bouring countries, has inevitably highlighted land administration and land use management issues as
central areas of concern for the ongoing land tenure and land use management reform process. Land
reform that ensures effective administration, the rights and obligations of land users, the introduction
of legal and institutional mechanisms for land use management and dispute resolution all provide
scope to improve the welfare of the poor and vulnerable groups. The new Organic Law on Land,
in principle, strengthens women’s rights to land. The redistribution of land arising from private and
state lands and pastures will likely have a positive impact on the poor. Furthermore, safeguards that
provide alternative livelihood opportunities for the poor through land tenure regulation and options
that encourage improved land management are being developed.
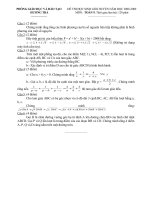
2.12 In general the proportion of households in each land size category has changed relatively little
since 2000/01 (Figure 2.2). Two percent of cultivating households do not own any land, so they rent,
sharecrop or borrow land. Around half of cultivating households (representing 3.6 million people in
2000/01 and 4.5 million in 2005/06) cultivate less than half a hectare. More than 60% of households
cultivate less than 0.7 ha of land, and more than a quarter cultivate less than 0.2 ha. The standard of
living is strongly related to the size of landholding, with those holding the least land generally being
the poorest. There was a reduction in proportion of landowners in the bottom consumption quintile
and an increase in the highest quintile.
9
56%
44%
A l’élechelle Nationale
Part et taille de population
900 000
450 000
90 000
Population pauvre
Population non pauvre
Densité de population
Moyenne nationale:
300 - 350 Hab./KM
Superieure à la moyenne
Nationale
Autour de la moyenne
nationale
inférieure à la moyenne
nationale
Source: MINECOFIN
Indicateurs de pression
Densité de population et Pauvreté
N
S
W E
EDPRS 2008 - 2012
EDPRS 2008 - 2012
Figure 2.2 holdings in 2000/01 (EICV1) and 2005/06 (EICV2)
Source: MINECOFIN (2007b).
2.13 Increasing population density together with policy initiatives to improve access to agricul-
tural technology has increased the use of land-saving input in the last ve years. The EICV surveys
show that the share of cultivating households using organic or chemical fertiliser remains low overall
(19%), but has doubled between 2000/01 and 2005/06. There has also been a substantial increase in
the share of cultivating households that now purchase insecticide (25%) and seeds (71%). This holds
for all quintile groups and all provinces (Appendix 1: Table A2.1).
2.14 By province, the largest increases in the numbers using fertiliser have been in Eastern Prov-
ince (from a very low base) and Northern Province. A slightly higher proportion of households use
insecticides, but again the proportion of households purchasing insecticides and fertiliser has more
than doubled in most quintile groups and in all provinces except the City of Kigali and the Western
region. There has also been a large increase in the number of households in all quintiles and prov-
inces purchasing sacks, packaging and similar items and this reects the growth in the number of
producers selling some of their output over the period. Ubudehe survey results suggest Rwandans
place fertiliser and insecticide as top priorities for improving agriculture, followed by training and
extension, anti-erosion and improved seeds.
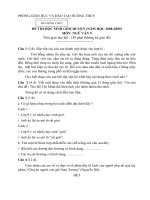
2.15 Production of food and cash crops increased considerably in 2000-2005 (Figure 2.3). For
wheat, rice, soybean and Irish potato, this was largely due to the expansion of the area that is culti-
vated. Production growth for other major crops, such as maize, banana, sweet potato, vegetables and
fruits, is probably due to improved yields. Crop yields have generally increased but remain below
world averages and, except for a few key staples (maize, sorghum and cassava), also remain below
regional averages (Appendix 1: Table 2). There was a signicant increase in the degree of market
100
90
80
70
60
50
40
30
20
10
0
Percentage of peole living in cultivating
Households
less than 0.2ha 0.2to 0.7ha 0.7 to 5.0 ha greater than 5ha
Farm size category
eicv1 eicv2
10
EDPRS 2008 - 2012
EDPRS 2008 - 2012
engagement by producers: the share of farmers reporting selling crops has increased, for all staple
crops and fruit and vegetables and across all quintile groups.
Figure 2.3 Increase in Cultivated Area (ha) and Yield (kg/ha), 2000-2005 (Average Percent change)
Source: World Bank (2006).
2.16 In some areas of agriculture, major progress was made, including strengthening of exports,
most impressively in coffee and horticulture (owers, fruit and vegetables). There was an increase in
fully washed coffee from 48 tons to 3,000 tons per year between 2002 and 2006; exports of horticul-
ture increased some 2,750%; hides and skins exports increased from US$2.6 million to US$4.7 mil-
lion. The challenge is to extend such progress to food security crops such as sweet potatoes, beans,
banana and cassava, through improved usage of agricultural input.
2.17 The other major success story concerns livestock numbers, where the proportion of house-
holds owning animals has increased from 60 to 71% between 2000/01 and 2005/06. This increase
was reported across all income quintiles and provinces, though the middle quintile had the biggest
proportionate increase and Eastern Province had the biggest cattle ownership. Livestock ownership
varies by the gender of the household head, with fewer female-headed households owning livestock
than male-headed households.
2.18 Rising population density in rural areas has placed the physical environment under increas-
ing stress. However, there is evidence of widespread and organised response to this threat of envi-
ronmental degradation. By way of illustration, rural households are becoming increasingly involved
in soil erosion control measures such as building radical terraces, particularly in the Northern and
Western provinces of the country, improving watershed management, and engaging in reforestation
work. In 2005/06, 60% of the rural population lived in communities that were engaged in reforesta-
tion activities, representing a large increase relative to 2000/01 for which the corresponding gure
was 40% (Appendix 1: Table A2.3). For those that replanted, the average area planted also increased
substantially from around four hectares per community in 2000/01 to more than twelve hectares in
2005/06. The proportion of communities that engaged in reforestation was biggest in Eastern Prov-
ince, followed by Southern Province; the increase was smallest in Northern Province. The increases
30
25
20
15
10
5
0
Cultivated area Yield
Sorghum
Maize
Wheat
Rice
Total cereals
Beans
Peas
Groungnuts
Soya
Total Legumes
Banana
Irish potato
Sweet potato
Colocase & igname
Cassava
Vegetables & fruits
Tea
Coffee
11
EDPRS 2008 - 2012
EDPRS 2008 - 2012
10. EICV surveys collected detailed information on household consumption, including the consumption of home produced items. This infor-
mation is used to quantify households’ standard of living in monetary terms and is the basis for measuring consumption poverty. Households
whose real expenditure per equivalent adult is calculated as being below the poverty line are dened as poor. People dened as poor at the
upper poverty line consume less than RWF 250 per adult equivalent per day; those living in extreme poverty under the lower poverty line
consume less than RWF 150. To calculate the poverty incidence for each household, the total expenditure per annum was calculated and
deated by a regional price index for the relevant period to give real expenditure, and subsequently divided by an index of household size to
give real expenditure per equivalent adult.
were of similar magnitudes in all consumption quintiles. The increased involvement of the rural
population in reforestation is consistent with the environmental priorities of the Ubudehe survey
which were ranked as follows: tree planting, anti-erosion measures, preventing the burning of forests,
education on the environment and caring for grazing areas.
2.19 Other initiatives to reduce environmental degradation include the widespread adoption of
improved cooking stoves in the Western region to reduce domestic rewood consumption. Efforts
have been made to rehabilitate critically degraded ecosystems such as the Rugezi wetland and Lake
Kivu by planting land cover to protect wetlands against siltation. Measures have also been taken to
improve the urban environment and Kigali has the reputation of being one of the cleanest cities in the
region.
2.2. Poverty has fallen, but needs to fall faster to meet the MDG and Vision 2020
targets
The incidence of consumption poverty has fallen in both rural and urban areas since 2000/01 (see Ta-
ble 2.2).
10
The extreme poverty line represents the level of expenditure needed to provide minimum
food requirements of 2,100 kcal per adult per day. More than one-third of the population is unable to
achieve this level of consumption and consequently go hungry. The upper poverty line includes non-
food requirements and over half of the population remains unable to provide for these basic needs.
The average poor person’s consumption is at about RWF 150 per day and has only increased by 2% in
the past ve years. Rates of poverty reduction since 2000 have been modest and are not fast enough
to meet either the targets set in Vision 2020 or the MDGs. The total number of poor people has now
increased to ve million. Over 90% of poor people still live in rural areas.
12
EDPRS 2008 - 2012
EDPRS 2008 - 2012
Poverty headcount
(share of population)
Number of poor
(millions)
EICV1 E ICV2 EICV1 EICV2
Upper poverty line
Kigali 16.1% 13.0% 0.11 0.09
Other urban 46.5% 41.5% 0.29 0.36
Rural 66.1% 62.5% 4.43 4.93
National 60.4% 56.9% 4.82 5.38
Extreme poverty line
Kigali 8.4% 6.3% 0.06 0.04
Other urban 28.5% 25.3% 0.18 0.22
Rural 45.7% 40.9% 3.06 3.23
National 41.3% 36.9% 3.30 3.49
Share of respondents (%)
Destitute
Umuhanya
18.0
Poorest
Umutindi nyakujya
52.5
Poorer
Umutindi
9.8
Poor
Umukene
7.1
Vulnerable
Utishoboye
4.8
Surviving
umukene wifashije
1.1
Others
Abandi
6.8
Total 100.0
Table 2.2 Poverty headcount (share of population and number)
Source: NISR (2006).
2.20 It is interesting to compare objective poverty measures at the national level with subjective
measures based on perceptions of poverty. One source of subjective information is the Ubudehe sur-
vey, in which communities identied seven socioeconomic categories, into which households were
asked to position themselves. The distribution of respondents by these categories is presented in
Table 2.3. Most people were in the umuhanya and umutindi categories, indicating they felt they were
among the poorest. Vulnerable people were identied, in order of greatest destitution, as widows,
landless, sick, the elderly and child-headed households.
Table 2.3 Own distribution of poor by categories
Source: MINECOFIN (2007a).
2.21 Major causes of poverty identied by Ubudehe survey respondents were lack of land, poor
soils, unpredictable weather and lack of livestock (Table 2.4). Exit strategies out of poverty were
identied as paid employment, commerce and livestock. Over half of the households sampled felt
that their income or livelihood had not improved in the past three years. Principal activities to be
undertaken in future Ubudehe work were identied in the areas of as livestock rearing, agriculture,
small business, water and roads.
13
EDPRS 2008 - 2012
EDPRS 2008 - 2012
Share of respondents (%)
Lack of land (Kutagira isambu)
49.5
Poor soils (Ubutaka butera)
10.9
Drought/weather (Izuba ryinshi)
8.7
Lack of livestock (Kutagira itungo)
6.5
Ignorance (Ubujiji)
4.3
Inadequate infrastructure (Ibikorwa remezo bidahagije)
3.0
Inadequate technology (Ikoranabuhanga ridahagije)
1.7
Sickness (Uburwayi)
1.7
Polygamy (Ubuharike)
1.2
Lack of access to water (Kubura amazi)
1.1
Population pressure (Ubwiyongere bw’abaturage)
0.7
Others(Izindi)
10.6
Total 100.0
Table 2.4 Major causes of poverty identied
Source: MINECOFIN (2007a).
2.22 At the regional level, changes in poverty varied. The poverty headcount fell signicantly in
Eastern Province and declined by smaller amounts in Northern Province and in the City of Kigali.
However, poverty in Southern Province did not change signicantly, which is a cause for concern
since the South is now the poorest province (Figure 2.4 and Appendix 1: Table A2.4). Calculations
show that 68% of the total reduction of poverty in the country was accounted for by poverty reduc-
tion in Eastern Province.
14
EDPRS 2008 - 2012
EDPRS 2008 - 2012