Tài liệu Báo cáo khoa học: Steady-state and time-resolved fluorescence studies of conformational changes induced by cyclic AMP and DNA binding to cyclic AMP receptor protein from Escherichia coli ppt
Bạn đang xem bản rút gọn của tài liệu. Xem và tải ngay bản đầy đủ của tài liệu tại đây (348.61 KB, 11 trang )
Eur. J. Biochem. 270, 1413–1423 (2003) Ó FEBS 2003
doi:10.1046/j.1432-1033.2003.03497.x
Steady-state and time-resolved fluorescence studies of conformational
changes induced by cyclic AMP and DNA binding to cyclic AMP
receptor protein from Escherichia coli
Agnieszka Polit, Urszula Błaszczyk and Zygmunt Wasylewski
Department of Physical Biochemistry, Faculty of Biotechnology, Jagiellonian University, Krako´w, Poland
cAMP receptor protein (CRP), allosterically activated by
cAMP, regulates the expression of several genes in Escherichia coli. As binding of cAMP leads to undefined conformational changes in CRP, we performed a steady-state and
time-resolved fluorescence study to show how the binding of
the ligand influences the structure and dynamics of the
protein. We used CRP mutants containing a single tryptophan residue at position 85 or 13, and fluorescently labeled
with 1,5-I-AEDANS attached to Cys178. Binding of cAMP
in the CRP–(cAMP)2 complex leads to changes in the Trp13
microenvironment, whereas its binding in the CRP–
(cAMP)4 complex alters the surroundings of Trp85. Timeresolved anisotropy measurements indicated that cAMP
binding in the CRP–(cAMP)2 complex led to a substantial
increase in the rotational mobility of the Trp13 residue.
Measurement of fluorescence energy transfer (FRET)
between labeled Cys178 and Trp85 showed that the binding
of cAMP in the CRP–(cAMP)2 complex caused a substantial increase in FRET efficiency. This indicates a decrease in
the distance between the two domains of the protein from
˚
˚
26.6 A in apo-CRP to 18.7 A in the CRP–(cAMP)2 complex. The binding of cAMP in the CRP–(cAMP)4 complex
resulted in only a very small increase in FRET efficiency. The
average distance between the two domains in CRP–DNA
complexes, possessing lac, gal or ICAP sequences, shows an
increase, as evidenced by the increase in the average distance
˚
between Cys178 and Trp85 to % 20 A. The spectral changes
observed provide new structural information about the
cAMP-induced allosteric activation of the protein.
cAMP receptor protein (CRP), which is allosterically
activated by cAMP, regulates transcription of over 100
genes in Escherichia coli [1,2]. Upon binding the cyclic
nucleotide, CRP undergoes an allosteric conformational
change that allows it to bind specific DNA sequences with
increased affinity [3]. CRP is a dimeric protein, composed of
two identical 209-amino-acid subunits. Each subunit of
CRP has a molecular mass of 23.6 kDa, as deduced from
the amino-acid sequence. Individual subunits fold into two
domains [4]. The larger N-terminal domain (residues 1–133)
is responsible for dimerization of CRP and for interaction
with the allosteric effector, cAMP. The smaller C-terminal
domain (residues 139–209) is responsible for interaction
with DNA through a helix–turn–helix motif. CRP recognizes a 22-bp, symmetric DNA site [5]. Amino-acid residues
134–138 form a flexible hinge which covalently couples two
domains. Recent studies of the crystal structure of the CRP–
DNA complex showed that each protein subunit binds two
cAMP molecules with different affinities [6]. Higher-affinity
sites, where the nucleotide binds in the anti conformation,
are buried within the N-terminal domains, whereas loweraffinity binding sites (where the bound cAMP has a syn
conformation) are located at the interface formed by the
two C-terminal domains of the CRP subunits, interacting
with a helix–turn–helix motif and, indirectly, with the DNA.
Crystallographic observations have been supported by
recent NMR [7] and isothermal titration calorimetry studies
[8]. Therefore, it has been suggested that CRP exists in three
conformational states: free CRP, CRP with two cAMP
molecules bound to N-terminal domains [CRP–(cAMP)2],
and CRP with four cAMP molecules bound to both
N-terminal and C-terminal domains [CRP–(cAMP)4]. An
earlier hypothesis suggested [9] that the three conformational states of CRP consisted of the following species: free
CRP, CRP–(cAMP)1 and CRP–(cAMP)2, which has been
reinterpreted by Passner & Steitz [6]. It is important to note
that the behavior of CRP at different concentrations of
cAMP is essentially biphasic, so two different conformers
exist at lower and higher concentrations of cAMP. In the
presence of % 100 lM cAMP, CRP becomes activated and is
able to recognize and bind specific DNA sequences and
stimulate transcription [10], whereas at millimolar concentrations of cAMP, there is a loss of affinity and sequence
specificity for DNA binding and, consequently, loss of
transcription stimulation [11]. In the crystal phase, the CRP
Correspondence to Z. Wasylewski, Department of Physical
Biochemistry, Faculty of Biotechnology, Jagiellonian University,
´
ul. Gronostajowa 7, 30-387 Krakow, Poland.
Fax: + 48 12 25 26 902, Tel.: + 48 12 25 26 122,
E-mail:
Abbreviations: 1,5-I-AEDANS, N-iodoacetylaminoethyl-1-naphthylamine-5-sulfonate; AEDANS-CRP, CRP covalently labeled with
1,5-I-AEDANS attached to Cys178; apo-CRP, unligated CRP;
CRP, cAMP receptor protein; FRET, fluorescence resonance
energy transfer.
(Received 31 October 2002, revised 19 December 2002,
accepted 3 February 2003)
Keywords: allosteric regulation; cAMP receptor protein;
emission anisotropy; Escherichia coli; fluorescence.
Ó FEBS 2003
1414 A. Polit et al. (Eur. J. Biochem. 270)
cAMP mediates the allosteric activation of CRP remain
obscure, because the crystal structure of apo-CRP has not yet
been elucidated. Therefore, we decided to study the changes
in the apo-CRP structure induced by binding of cAMP and
DNA by measuring fluorescence resonance energy transfer
(FRET) and fluorescence anisotropy decay. Two tryptophan
residues, Trp13 and Trp85, were used as intrinsic donors for
FRET analysis. The fluorescence anisotropy decay was used
to investigate the dynamics of CRP.
Experimental procedures
Materials
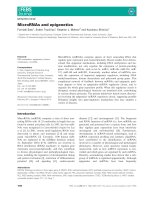
Fig. 1. Structure of the CRP dimer. The locations of tryptophan residues are marked in red, and the location of Cys178 residue is indicated
in yellow. The figure was generated with WEBLAB VIEWERPRO (version
3.7) using atomic coordinates for the CRP–cAMP complex [29]. The
coordinates were obtained from the Brookhaven Protein Data Bank
(accession code 1G6N).
dimer with two molecules of cAMP bound to anti-cAMP
binding sites is asymmetric, i.e. one monomer is in an ÔopenÕ
form, in which the a-helices are swung out away from the
N-terminal domain, and the other monomer is in a ÔclosedÕ
form, in which the a-helices are swung in close to the
N-terminal domain [4]. X-ray crystal structure studies
revealed that the cAMP-ligated CRP dimer complexed to
a 30-bp DNA sequence is exclusively in the ÔclosedÕ form [12].
Each subunit of CRP contains two tryptophan residues at
positions 13 and 85 (Fig. 1). Both residues are located in the
N-terminal domain, Trp85 near the cAMP-binding pocket
and Trp13 on the surface of the protein. Trp13 is much more
accessible to solvent than Trp85. 19F-NMR studies have
revealed that binding of cAMP induces not only changes in
the immediate environment of the cAMP-binding site but
also far-reaching conformational changes (perturbation of
chemical shift of Trp13) [13]. Fluorescence studies have
shown that Trp13 is responsible for % 80% of the tryptophan
fluorescence in CRP with % 20% of the signal originating
from Trp85 [14]. Acrylamide-mediated and iodide-mediated
fluorescence quenching studies indicate that Trp13 is solventexposed and accessible to the quenching agents. On the other
hand, Trp85 is inaccessible to quenching agents. Heyduk &
Lee [9] have shown that, at micromolar cAMP concentrations, there is no detectable change in fluorescence intensity
of protein tryptophan residues. The increase was only
detected in the millimolar range of cAMP concentration.
Biochemical and biophysical studies have demonstrated
that binding of cAMP allosterically induces CRP to assume a
conformation that binds to DNA and interacts with RNA
polymerase. However, the details of the mechanism by which
Acrylamide, KCl, EDTA, phenylmethanesulfonyl fluoride,
Tris and N-iodoacetylaminoethyl-1-naphthylamine-5-sulfonate (1,5-I-AEDANS) were purchased from Sigma. cAMP
and dithiothreitol were from Fluka. The Fractogel EMD
–
SO3 650 (M) was from Merck, and Q-Sepharose Fast Flow,
Sephacryl S-200 HR and Sephadex G-25 were from
Amersham Pharmacia Biotech. DNA sequence containing
´
the CRP-binding sites was from TIB MOLBIOL (Poznan,
Poland). The nutrients for bacterial growth were from Life
Technologies. All other chemicals were analytical-grade
products of POCh-Gliwice (Gliwice, Poland). All measurements were performed in buffers prepared in water purified
with the Millipore system.
The sequences of duplexes used in this study were as
follows:
lac (26 bp), 5¢-ATTAATGTGAGTTAGCTCACTCATT
A-3¢ and 3¢-TAATTACACTCAATCGAGTGAGTAAT-5¢;
gal
(26 bp),
5¢-AAAAGTGTGACATGGAATAAATT
AGT-3¢ and 3¢-TTTTCACACTGTACCTTATTTAATCA-5¢;
ICAP (28 bp), 5¢-AATTAATGTGACATATGTCACAT
TAATT-3¢ and 3¢-TTAATTACACTGTATACAGTGTAAT
TAA-5¢.
The recognition half-sites are shown in bold. An
equimolar amount of complementary strand was added,
and the mixture was heated for 1 min at 96 °C and slowly
cooled to room temperature. The double-stranded DNA
was stored at )20 °C in experimental buffer.
Protein purification
The tryptophans at positions 13 and 85 of CRP were replaced
with phenylalanine and alanine, respectively. The mutagenesis was performed using the overlap extension method with
Pwo DNA polymerase. pHA7 plasmid encoding mutant crp
genes was introduced into E. coli strain M182Dcrp, kindly
provided by Dr S. Busby (The University of Birmingham,
UK). The bacteria were grown on Luria–Bertani medium at
37 °C overnight in a Biostat B fermentor from B. Braun
Biotech International (Melsungen, Germany). Proteins were
purified at 4 °C, essentially as described previously [15] but
with one modification. After ion-exchange chromatography
on Q-Sepharose, the proteins were additionally purified by
gel filtration on Sephacryl S-200 HR. After this procedure,
the proteins were highly pure (> 97%), as judged by SDS/
PAGE and Coomassie Brilliant Blue staining.
For spectrophotometric determination of concentrations,
the following absorption coefficients were used: 14 650
)1
)1
M Ỉcm
at 259 nm for cAMP [16] and 6000 M)1Ỉcm)1 at
Ó FEBS 2003
Conformational changes induced by cAMP and DNA binding to CRP (Eur. J. Biochem. 270) 1415
340 nm for AEDANS [18]. Absorption coefficients of CRP
mutants were determined using the method described
elsewhere [19] as 29 700 M)1Ỉcm)1 and 33 100 M)1Ỉcm)1 at
278 nm for the W13F and W85A dimers, respectively.
Measurements were performed in 50 mM Tris/HCl
buffer, pH 8.0, containing 100 mM KCl and 1 mM
EDTA (buffer A), and 50 mM Tris/HCl buffer, pH 7.8,
supplemented with 100 mM KCl and 1 mM EDTA
(buffer B).
Fluorescence labeling of CRP
Covalent modification of Trp mutants with 1,5-I-AEDANS
was carried out as described elsewhere [20] with several
modifications. The protein and label were mixed at a molar
ratio of 1 : 10 and incubated at room temperature for 2 h,
and then at 4 °C overnight in the dark. The labeled CRP
was purified on a Sephadex G-25 column equilibrated with
buffer A. Fractions displaying a high absorbance at both
280 and 340 nm were combined and dialyzed extensively
against buffer A.
Mapping of modified residues
Mapping of labeled residues was performed as described
previously [21] with several modifications. Peptides were
separated by an HPLC system consisting of (a) a Shimadzu
LC-9A pump equipped with FCV-9AL low-pressure proportioning valve, (b) a Knauer A0263 manual injector
equipped with a 100-lL loop, (c) a Supelcosil LC-318
HPLC (5 lm) cartridge column (250 · 4.6 mm) with
20 · 2.1 mm Supelguard LC-318 precolumn, (d) a MerckHitachi L-4000A detector, (e) a Shimadzu RF-535 fluorescence monitor, and (f) a Shimadzu Class-VP 1-2 hardware/
software system for data acquisition and analysis. Solvent A
was 0.1% trifluoroacetic acid in water, and solvent B was
0.08% trifluoroacetic acid in 80% acetonitrile. A linear
gradient of 10–70% solvent B over 40 min was applied at a
flow rate of 1 mLỈmin)1, with spectrophotometric detection
at 215 nm and fluorescence detection at an excitation
wavelength of 336 nm and an emission wavelength of
490 nm.
Steady-state fluorescence measurements
Steady-state fluorescence was measured with an Hitachi
F-4500 spectrofluorimeter. All studies were carried out at
room temperature and excitation at 295 nm. The experiments were conducted in buffer A or buffer B. The protein
solution had an initial absorbance at the excitation wavelength lower than 0.1.
The effect of cAMP on tryptophan fluorescence was
monitored by a fluorescence titration of CRPW13F and
CRPW85A. Tryptophan emission was scanned from 310 to
480 nm. When energy transfer was measured, the emission
spectra were recorded in the range 310–570 nm. The
fluorescence quantum yield of the donor in the absence of
the acceptor (QD) was calculated from the equation:
QD ẳ QRF
SD ARF
SRF AD
1ị
where SD and SRF are the respective areas under the
emission spectra of the donor and a reference compound,
and ARF and AD are the respective absorbances of the
reference compound and donor at the excitation wavelength. QRF is the quantum yield of the reference compound
L-tryptophan and was taken to be 0.14 in water at 25 °C
[22].
All spectra were corrected for sample dilution and the
inner filter effect, introduced by cAMP and DNA at
the excitation wavelength, according to the following
formula [23]
Fcor ẳ F 10PỵDAị=2
2ị
where F and Fcor are fluorescence intensity before and after
the correction, and P and DA denote the initial sample
absorbance at the excitation wavelength and the change in
absorbance introduced by the ligand, respectively.
Time-resolved fluorescence measurements
Fluorescence decays were measured using a homemade
time-correlated single-photon counting system based on
Ortec electronics (Oak Ridge, USA). It consisted of (a) a
Philips 2020Q photomultiplier with a 1.5-ns response time,
(b) a 1-GHz preamplifier, (c) a quad constant fraction
discriminator model 935, and (d) a time-to-amplitude
converter (TAC) model 457. A nanosecond flash lamp nF
900 from Edinburgh Instruments was used as a light source
(e). In the case of anisotropy measurements, (f) Glan–
Thompson prism polarizers were also used.
All measurements were performed at 20 ± 0.2 °C.
Before measurements, all samples were filtered through a
microporous filter (0.45 lm; Millipore) to remove insoluble
impurities.
FRET measurements. Energy transfer was observed
between the tryptophan residues and the 1,5-I-AEDANS
moiety covalently attached to Cys178. The tryptophans
were excited at 297 nm. Fluorescence decays were observed
at wavelengths between 320 and 400 nm using two cut-off
filters. Measurements were performed in buffer A. Fluorescence decays were recorded at a resolution of 23 ps per
channel, resulting in a total time window of 100 ns.
Intensity decay data were analyzed using the following
multiexponential decay law:
X
It ẳ
ai exp t=si ị
3ị
i
where ai and si are the pre-exponential factor and decay
time of component i, respectively. The fractional fluorescence intensity of each component is defined as ƒi ¼ aisi/
Saisi. The data were analyzed with the software from
Edinburgh Instruments. Best-fit parameters were obtained
by minimization of the reduced v2 value.
The average efficiency of energy transfer Ỉ was calculated from the average donor lifetime in the presence ỈsD
and absence of acceptor ặsDổ
<E> ẳ 1
< sDA >
< sD >
4ị
Ó FEBS 2003
1416 A. Polit et al. (Eur. J. Biochem. 270)
The average lifetime was obtained from the equation:
P 2
ai si
i
<s> ẳ P
5ị
a i si
i
As ặsDAổ and ặsDổ are obtained without the need to know the
absolute protein concentrations, uncertainties associated
with protein concentration determination are eliminated in
the time-resolved fluorescence measurements.
The average distance between the donor–acceptor pair
ỈRỉ was calculated from the equation:
hÀ
Á1=6 i
˚
< R > ẳ R0 E1 1
ẵA
6ị
where R0 is the Forster critical distance (the distance at
ă
which 50% energy transfer occurs). R0 is given by:
1=6
ẵA
7ị
R0 ẳ 9:78 103 j2 n4 QD JðkÞ
where n is the refractive index of the medium, QD is the
quantum yield of the donor, J(k) is a spectral overlap
integral of the donor fluorescence and acceptor absorption,
and j2 is the orientation factor and accounts for relative
orientation of the donor emission and acceptor absorption
transition dipole. Generally, j2 is assumed to be equal to
2/3, which is the value for donors and acceptors that
randomized by rotational diffusion before energy transfer.
Fluorescence anisotropy decay measurements. The W13F
and W85A CRP mutants were used to measure the
rotational correlation time of the protein. The excitation
wavelength for tryptophan residues was 297 nm. Fluorescence anisotropy decays were observed using a cut-off
filter > 320 nm. Experiments were performed at several
concentrations of the proteins (1.0–8.5 lM) for each species.
The sample was excited with vertically polarized light.
Fluorescence anisotropy decays with vertical and horizontal
emission polarization were alternatively recorded. All
measurements were repeated at least twice for each sample.
Fluorescence anisotropy decays were recorded at a resolution of 46 ps per channel, resulting in a total time window
of 200 ns.
Anisotropy decay data were analyzed according to the
impulse reconvolution model decay law:
Rtị ẳ R1 ỵ
n
X
Ai exp t=hi ị
8ị
iẳ1
where Ai are the amplitudes of the components with
rotational correlation time hI, and Rl is limiting anisotropy.
The time-zero anisotropy r(0) was obtained from the
equation:
r0ị ẳ R1 ỵ
n
X
Ai
9ị
iẳ1
In each case, the best-fit parameters were obtained by
minimization of the reduced v2 test value. The v2 and
residuals distribution were utilized to judge the goodness of
the fit. The software used for analysis was from Edinburgh
Instruments.
Results
Fluorescence labeling of CRP
Each subunit of CRP possesses three cysteine residues, two
in the N-terminal domain (Cys19 and Cys92) and one in the
C-terminal domain (Cys178). Only Cys178 can be chemically modified under native conditions; Cys19 and Cys92
seem to be buried [24,25]. To confirm the selectivity of the
labeling, CRP mutants modified with 1,5-IAEDANS were
denaturated and completely digested with trypsin and
chymotrypsin. The peptides liberated were examined by
HPLC. As expected, only one peptide fragment had been
modified with thiol-reactive probe. Thus, we conclude that
CRP was uniformly labeled with 1,5-IAEDANS at the SH
group of Cys178.
The stoichiometry of the labeling was determined from
the absorption spectrum of the labeled CRP. When
CRP was incubated with the fluorescence reagent, 1,5I-AEDANS, at pH 8.0, a mean of 2 mol was bound per
mol protein dimer. The effect of the label on the
secondary structure of CRP was investigated using CD
spectroscopy. No differences were observed between the
modified and unmodified variants of CRP (data not
shown). The insertion of the fluorescent probes also
did not significantly alter the biological activity of CRP
[20].
Steady-state fluorescence data
The effect of cAMP on tryptophan fluorescence was
monitored. Changes in CRP tryptophan fluorescence
were monitored by titrating the CRP solution with 1–2lL aliquots of concentrated cAMP solution. Measurements were performed in the cAMP concentration range
50 lM to 1 mM. The fluorescence emission spectra of
Trp13 and Trp85 in the presence and absence of cAMP
are given in Fig. 2A and Fig. 3A, respectively. When
CRP was titrated with cAMP, the fluorescence intensity
of the Trp13 residue decreased with increasing ligand
concentration. However, this decrease could only by
detected in the micromolar range of cAMP concentrations. In addition, the emission maximum of Trp13
shifted from % 342.5 nm to % 340 nm. The reduction in
fluorescence intensity and the blue shift indicate a
conformational transition of CRPW85A on binding of
cAMP. The effect of different concentrations of cAMP
on the fluorescence intensity of Trp13 is shown in
Fig. 2B. When 200 lM cAMP was added to the solution
of CRPW85A, a % 13% decrease in fluorescence intensity
was observed.
In contrast with the observation made with CRPW85A,
the addition of cAMP to CRPW13F caused an increase in
the fluorescence intensity of Trp85 with no change in the
emission maximum. The maximum wavelength of emission
for CRPW13F was % 339 nm. The effect of different
concentrations of cAMP on the fluorescence intensity of
Trp85 is shown in Fig. 3B. In the case of Trp85, the addition
of 200 lM cAMP caused only a very small change in the
fluorescence intensity, increasing it by % 3.4%. A pronounced increase in the Trp85 fluorescence intensity was
Ó FEBS 2003
Conformational changes induced by cAMP and DNA binding to CRP (Eur. J. Biochem. 270) 1417
Fig. 2. Fluorescence emission spectra of
CRPW85A in the absence (—) and presence of
cAMP at 50 lM (ỈỈỈỈ) and 1 mM cAMP (- - -).
Excitation was at 295 nm. All spectra were
recorded in buffer B, pH 7.8. The inset shows
fluorescence intensity change in Trp13 as a
function of cAMP concentration. F and F0 are
the fluorescence intensities of the protein in the
presence and absence of the ligand, respectively. The range of cAMP concentrations used
was from 50 lM to 1 mM. The line was drawn
only to indicate the trend of the data.
Fig. 3. Fluorescence emission spectra of
CRPW13F in the absence (—) and presence of
cAMP at 50 lM (ỈỈỈỈ) and 1 mM cAMP (- - -).
Excitation was at 295 nm. All spectra were
recorded in buffer B, pH 7.8. The inset in the
plot shows fluorescence intensity change in
Trp85 as a function of cAMP concentration.
F and F0 are the fluorescence intensities of the
protein in the presence and absence of the
ligand, respectively. The range of cAMP concentrations used was from 50 lM to 1 mM.
The line was drawn only to indicate the trend
of the data.
detected only at high concentrations of cAMP (> 2 mM)
(data not shown).
Typical fluorescence spectra of CRPW13F, unmodified
and modified with 1,5-I-AEDANS, are shown in Fig. 4.
When excited at 295 nm, tryptophan residues in the
unlabeled protein had a fluorescence emission maximum
near 339 nm. In the presence of 1,5-I-AEDANS, tryptophan fluorescence intensity was significantly reduced compared with an approximately equal concentration of an
unmodified protein. The maximum wavelength of tryptophan emission in the labeled mutant W13F was shifted to
% 327 nm. The addition of cAMP and DNA increased
energy transfer from Trp85 residue to the AEDANS
moiety.
The quantum yields of tryptophan fluorescence at
25 °C in buffer A were determined to be 0.09 for mutant
CRPW13F alone and 0.094 for mutant CRPW13F in the
presence of 200 lM cAMP. The quantum yield of the
donor increased upon protein–DNA complex formation.
The change in the observed value of the quantum yield
was % 20%. A similar result was obtained for CRP–
(cAMP)4.
Time-resolved fluorescence data
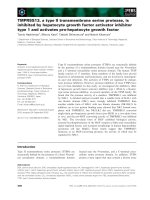
FRET measurements. Lifetime measurements on the
mutant CRPW13F labeled with 1,5-I-AEDANS indicated
a decreased lifetime of the tryptophan fluorescence, as
expected when energy transfer occurs. Figure 5 shows the
time-dependent donor decays for the proteins bearing
donor alone and those with donor and acceptor. In the
case of mutant CRPW85A, no energy transfer was
observed. Lifetime measurements were repeated several
times for each species. The fluorescence decays were
Ó FEBS 2003
1418 A. Polit et al. (Eur. J. Biochem. 270)
Fig. 4. Fluorescence emission spectra of
unmodified and modified CRPW13F. The
excitation wavelength was 295 nm and
emission was scanned from 310 to 570 nm.
Measurements were performed at 25 °C in
buffer A, pH 8.0. (— Ỉ Ỉ —) Unmodified
CRPW13F; (—) modified CRPW13F; (- - -)
modified CRPW13F in the presence of 200 lM
cAMP; (ỈỈỈỈ) modified CRPW13F bound to
DNA in the presence of cAMP.
analyzed as a multiexponential decay, and for each case the
double exponential decay was characterized by lower values
of reduced v2. In some cases the triple exponential decays
were recorded; however, the pre-exponential factor a3 for
these fits was close to zero, and therefore this component of
the decay is not included in the calculated average values of
fluorescence lifetimes ỈsDỉ and ỈsD. The values for average
lifetimes of Trp85 in the absence and presence of acceptor
and efficiency of energy transfer are presented in Table 1.
The transfer efficiency varied between apoprotein and after
binding cAMP at micromolar or millimolar concentrations.
In the absence of a specific ligand, CRPW13F showed an
efficiency of transfer of 24.2 ± 8.1%. The addition of
cAMP had a significant effect on energy transfer. The value
for CRPW13F with two cAMP molecules bound to anticAMP-binding
sites
was
considerably
higher
(72.3 ± 2.5%) than for apoprotein. The result determined
for the mutant W13F in the presence of 2 mM cAMP was
similar to the above value, averaging 74.3 ± 2.4%. Energy
transfer in CRPW13F bound to the specific fragments of
DNA was also measured and displayed similar values of
efficiency for each complex examined (% 62%).
The energy-transfer efficiency values were used to calculate the average distance between the donor and the
acceptor. To approximate the distance between the
Trp85–Cys178 pair, we assumed that the Forster distance
ă
for the tryptophanIAEDANS pair was 22 A [26,27]. The
estimated distances are shown in Table 1. There was a
significant difference between the calculated distance in
apo-CRPW13F and CRPW13F complexed with cAMP
and DNA.
the anisotropy decays of Trp13 and Trp85 could be
described by one exponent with single rotational correlation
time. Addition of the second exponent did not significantly
alter the goodness of fit. The v2 value obtained with the
single-exponential and double-exponential analysis indicates that the two-component analysis is not significantly
better than the one-component analysis. Also the distribution of the residuals did not improve on the addition of the
second component (Fig. 6B,C). However, the data obtained
for the single exponential analysis suggest the presence of an
additional segmental mobility. This is evident from apparent time-zero anisotropy r(0), which is lower than the
fundamental anisotropy r0 of tryptophan at this excitation
wavelength [28]. For both tryptophan residues, the initial
anisotropy was in the range 0.22–0.23 (Table 2). It indicates
that anisotropy decay contains a fast component which
cannot be resolved with our device.
The anisotropy decay parameters for various CRP
species are reported in Table 2. The mean ± SD value
of rotational correlation times determined from the study
of fluorescence anisotropy decays of Trp85 in the absence
of specific ligand was 20.5 ± 2.4 ns. The value for Trp13
was considerably lower, averaging 15.3 ± 1.8 ns. The
addition of 100 lM cAMP probably did not affect the
rotational correlation time of CRPW13F. The uncertainty of this value was too large to ascertain any
changes in the CRP dynamic on cAMP binding. Trp13
exhibited different behavior. The rotational correlation
time determined from the study of fluorescence anisotropy decays of Trp13 in the presence of cAMP
decreased to 10.45 ± 3.0 ns.
Time-domain anisotropy data. The fluorescence anisotropy decays of Trp13 and Trp85 were measured to
determine the changes in the rotational diffusion of CRP
after cAMP binding. The anisotropy decay of Trp13 in the
CRP complexed with two cAMP molecules is shown in
Fig. 6A. Analysis of the anisotropy decays was carried out
according to Eqn (8) with an increasing number of
exponents, until the fit no longer improved. In all cases,
Discussion
cAMP binding to CRP has been studied using a variety of
methods, which have shown that the ligand binding
mediates changes in the protein conformation. It is believed
that these changes allow the protein molecule to switch from
the low-affinity and nonspecific DNA-binding state to the
state characterized by high affinity and sequence specificity
Ó FEBS 2003
Conformational changes induced by cAMP and DNA binding to CRP (Eur. J. Biochem. 270) 1419
Fig. 5. Trp85 fluorescence intensity decays for mutant CRPW13F without and with 1,5-I-AEDANS covalently attached to Cys178. The dark grey
dotted curve shows the intensity decay of the donor alone (D), and the grey dotted curve shows the intensity decay of the donor in the presence of
the acceptor (DA). The black solid lines and weighted residuals (lower panels) are for the best triple exponential fits. Experiments were performed in
buffer A at 20 °C.
for the DNA promoter [2]. As the X-ray crystal structure of
apo-CRP has not yet been resolved, it is believed that the
binding of cAMP, which leads to a switch to active protein
conformation, involves subunit realignment and hinge
reorientation between the protein domains [2,29]. For a
long time, it has been a paradigm that CRP undergoes a
cAMP concentration-dependent transition between three
conformations: apo-CRP, CRP–(cAMP)1 and CRP–
(cAMP)2, and each conformer possesses a unique structure
and activity [2]. The reinterpretation of this paradigm was
proposed by Passner & Steitz [6] on the basis of the crystal
structure of the CRP–cAMP complex, and it has recently
been supported by NMR [7] and isothermal titration
calorimetry [8] studies in solution. NMR experiments have
shown that CRP possesses two anti-cAMP-binding sites in
each monomer, and the next two syn-cAMP sites are
formed by an allosteric conformational change in the
protein on biding of two anti-AMP at the N-terminal
Ó FEBS 2003
1420 A. Polit et al. (Eur. J. Biochem. 270)
Table 1. Summary of energy transfer measurements. In the CRPW13F–(cAMP)2 complex, the concentration of cAMP was 200 lM, whereas in the
case of CRPW13F–(cAMP)4 the concentration of cAMP was 2 mM. The molar ratio CRP to DNA in the protein–DNA complex was 1 : 1.
Species
ỈsDỉ (ns)
ỈsD (ns)
CRPW13F
CRPW13F–(cAMP)2
CRPW13F–(cAMP)4
CRPW13F–ICAP
CRPW13F–lac
CRPW13F–gal
5.83
5.59
5.99
5.55
5.85
5.85
4.42
1.55
1.54
2.10
2.23
2.17
24.2
72.3
74.3
62.2
61.9
62.9
˚
ỈRỉ (A)
Ỉ (%)
±
±
±
±
±
±
0.50
0.31
0.42
0.25
0.16
0.12
domain [7]. The isothermal titration calorimetry measurements demonstrated that, at low cAMP concentration,
there are two identical interactive high-affinity sites for
cAMP and at least one low-affinity cAMP-binding site at
high concentration of the ligand [8].
The idea of the four cAMP-binding sites in CRP, for its
anti conformation (at low concentration of the ligand) and
the next two binding it in syn conformation (at high cAMP
concentration) has been used to describe the results of fast
kinetic studies [15] and investigations with dynamic light
scattering and time-resolved fluorescence anisotropy measurements [30]. In these studies, we have shown that the
binding of cAMP in anti conformation in the N-terminal
domain of CRP leads to the conformational changes in the
helix–turn–helix motif of the C-terminal domain, responsible for the interaction with DNA, as well as to the changes
in the global hydrodynamic structure of CRP. The saturation of the low-affinity sites with cAMP in syn conformation
of cAMP results in the changes in the microenvironment of
the Trp85 residue, localized in the N-terminal domain of the
protein, without further substantial changes in the global
hydrodynamic structure [30].
The results presented in this report provide further
evidence for conformational changes induced by cAMP
binding to the anti-cAMP-binding sites of CRP, which in
turn trigger specific pathways of signal transmission from
the cyclic nucleotide-binding domain to the DNA-binding
domain of the protein. We have used single tryptophancontaining mutants of CRP. The mutations were localized
in the N-terminal domain at position 85 or 13 in order to
follow conformational changes in their microenvironment
on binding of cAMP, both in anti- and syn- conformation.
We have also used AEDANS for fluorescent labeling of
Cys178, located at the turn of the helix–turn–helix motif, in
order to detect FRET between Trp85 and the label. We
have shown that binding of cAMP at a concentration of
200 lM to anti-cAMP-binding sites results in % 13%
decrease in the Trp13 fluorescence intensity along with the
blue shift in its maximum of emission by 2.5 nm. Probable
candidates for quenching residues in CRP are Thr10,
Asn109 and His17, which are located within a distance up to
˚
5 A, as has been determined from the X-ray crystal
structure of the CRP–cAMP complex (PDB code 1G6N)
[29]. The observed changes in the microenvironment of
Trp13 on filling of the high-affinity sites are also supported
by the time-resolved anisotropy measurements. Binding of
the ligand to anti-cAMP-binding sites results in a decrease in
rotational correlation time by % 5 ns, from the value of
15.3 ns, detected for apo-CRP, to the value of 10.4 ns for
CRP–(cAMP)2 complex. The decrease in rotational time
±
±
±
±
±
±
0.28
0.11
0.10
0.06
0.06
0.25
±
±
±
±
±
±
8.1
2.5
2.4
2.0
1.5
4.3
26.6
18.7
18.4
20.2
20.3
20.1
±
±
±
±
±
±
3.9
0.8
0.8
0.6
0.5
1.2
indicates an increase in the mobility of helix A of the
protein. As Trp13 is located in the vicinity of the activation
region AR2 of the protein [1], which is responsible for the
activation of the second class of E. coli promoters such as
gal P1, one can speculate that this conformational change
may play an important role in a signal transmission in the
protein molecule, which in turn may allow CRP to adopt a
conformation appropriate for the interaction with the
aNTD domain of RNA polymerase in the transcription
complex. On the other hand, Trp13 of CRP directly
interacts with another gene regulatory protein, CytR [31],
and the observed conformational changes in Trp13 microenvironments on cAMP binding to anti-cAMP sites may
play a significant role in the CRP–CytR–DNA complex.
In contrast with Trp13 of CRP, binding of cAMP to anticAMP-binding sites does not lead to a significant change in
fluorescence intensity of Trp85, and only a % 3.4% increase
in the intensity has been observed at 200 lM cAMP.
However, cAMP binding to the syn-cAMP-binding sites at
concentration of the ligand of 1 mM causes a % 6% increase
in its fluorescence intensity, which indicates that this residue
is sensitive to cAMP binding to low-affinity sites. The
rotational correlation time of Trp85 in apo-CRP of 20.5 ns
indicates that this residue is immobilized within the
N-terminal domain of the protein and exhibits motion
characteristic of the whole protein (within experimental
error), while the respective value for the AEDANS-labeled
apo-CRP has been estimated at 23.3 ns [30]. Binding of
cAMP to anti-cAMP-binding sites increases the rotational
correlation time to 22 ns for the CRP–(cAMP)2 complex,
which is much lower than the correlation time of 30 ns
determined for this complex using CRP labeled at Cys178
with the AEDANS fluorescent probe [30]. These discrepancies can probably be explained by the fact that the
average fluorescence lifetime of Trp85, % 5.6 ns in the case
of the CRP–(cAMP)2 complex, is too short to allow
observations of the longer rotational correlation times.
The allosteric activation of CRP involves conformational
changes in the N-terminal domain of the protein and leads
to changes in the CRP molecule, enabling it to recognize the
specific DNA sequence [1,2]. As the crystal structure of apoCRP has not yet been established, it was suggested that
cAMP binding may cause reorientation of the coiled-coil C
helices, consequently altering the relative position of the
protein dimer subunits [29]. These authors also suggested
that, in the absence of cAMP in apo-CRP, some b strands
of the N-terminal domain of the protein may collapse into
the cAMP-binding pocket, causing reorientation of the
smaller domain in relation to the larger one, and bringing
these domains closer together. This suggestion has been
Ó FEBS 2003
Conformational changes induced by cAMP and DNA binding to CRP (Eur. J. Biochem. 270) 1421
Fig. 6. Time-domain fluorescence anisotropy decay of Trp13 in the presence of 100 lM cAMP. The solid line corresponds to the best single
exponential fit of the data (dotted curve) according to Eqn (8). The grey cross-haired curve represents the lamp profile. The plots of the residuals for
the best single exponential fit (B) and the double exponential fit (C) are also shown. Measurements were performed at 20 °C in buffer B, pH 8.0,
with a CRPW85A concentration of 1.1 lM. Excitation was at 297 nm.
Table 2. Parameters of Trp13 and Trp85 anisotropy decays in the
presence and absence of cAMP.
Species
h (ns)
CRPW13F
CRPW85A
CRPW13F–(cAMP)2
CRPW85A–(cAMP)2
20.5
15.3
22.1
10.45
v2
r(0)
±
±
±
±
2.4
1.8
6.9
3.0
0.23
0.21
0.23
0.23
±
±
±
±
0.02
0.02
0.03
0.03
1.222
1.055
1.036
1.146
supported recently by NMR studies [7]; these authors argue
that binding in solution of two cAMP molecules to highaffinity anti-cAMP-binding sites at the N-terminal domain
causes the C-terminal domain to shift further to the
N-terminal domain of CRP. To confirm this suggestion,
we used FRET to detect the distance between the C-terminal
and N-terminal domains of CRP on binding of cAMP in anti
as well as syn conformation to the protein. For this purpose,
we used time-resolved fluorescence lifetime measurements
Ó FEBS 2003
1422 A. Polit et al. (Eur. J. Biochem. 270)
using single tryptophan-containing mutants of CRP. Fluorescence energy transfer could be detected between Trp85,
localized close to the cAMP-binding pocket of the
N-terminal domain, and Cys178, fluorescently labeled by
AEDANS, localized in the helix–turn–helix motif of the
C-terminal domain of the protein. The lifetimes obtained for
the fluorescence donor, Trp85, indicate that binding of
cAMP to anti-cAMP-binding sites leads to a dramatic
increase in FRET efficiency. This observation clearly shows a
decrease in the average distance between the two domains of
CRP on cAMP binding. If one assumes the Forster distance,
ă
R0, for the pair donoracceptor such as tryptophan
AEDANS to be 22 A [26,27], the distance between Trp85
and Cys178-AEDANS in the apo-CRP can be calculated to
˚
˚
˚
be 26.6 A. This distance decreases by about 8 A to 18.7 A on
binding of cAMP to the anti-cAMP-binding sites of the
protein. The distance between the sulfur atom of Cys178 and
the C9–C10 bond of the indole ring of Trp85, derived from
the crystal structure of CRP–(cAMP)2 (PDB code 1G6N) is
˚
˚
18.9 A and 21.9 A for the subunit present in the ÔclosedÕ and
ÔopenÕ conformation, respectively [29]. The structural asymmetry of the CRP–(cAMP)2 complex resulting from conformational differences between subunits has been
questioned [32], and from molecular dynamics simulation,
it has been predicted that, in solution, both subunits of CRP
adopt a ÔclosedÕ conformation. If this is so, the distance (equal
˚
to 18.7 A), determined in this work by FRET, is in good
˚
agreement with the value of 18.9 A predicted for the ÔclosedÕ
conformation. This supports experimentally the dynamic
simulation studies [32] and indicates that, in solution, both of
the protein subunits exist in ÔclosedÕ conformation in the
CRP–(cAMP)2 complex.
Because a variety of spectroscopic effects, at least in
theory, could influence energy transfer efficiency, one can
argue that the good agreement determined for the distance
between Cys178 and Trp85 residues in CRP–(cAMP)2 may
also result from the assumed value of Forster distance R0.
ă
However, as binding of cAMP at a concentration of 200 lM
to CRP leads only to a % 4.3% increase in the fluorescence
quantum yields from the value of 0.09 for apo-CRP to the
value of 0.094 for the CRP–(cAMP)2 complex, and no
substantial changes in the shape of the emission spectra of
the donor have been observed, this justifies the lack of the
alteration of the Forster distance between apo and holo
ă
forms of the protein. As the AEDANS label attached to the
Cys178 enjoys local freedom of movement, in both apoCRP and the CRP–(cAMP)2 complex [30], the distance
obtained from the crystal structure between the sulfur atom
of Cys178 and the indole ring of Trp85 seems to be realistic.
We have also tried to measure fluorescence energy transfer
between Trp13 and Cys178-AEDANS; however, we have
not detected any energy transfer in either the apo- or holoform. This could be because of the distance between the two
˚
residues, which is about 45 A, as can be calculated from the
crystal structure of CRP–(cAMP)2 [29].
Binding of cAMP in syn conformation to the lowaffinity binding sites in the CRP–(cAMP)4 complex leads
to only a small increase in the efficiency of energy
˚
transfer, which, with an assumed R0 value of 22 A,
corresponds to the small decrease in average distance
between the N-terminal and C-terminal domains of CRP,
˚
estimated at 18.4 A. However, the fluorescence quantum
yield of the Trp85 donor increases by % 20% at a
concentration of cAMP of 2 mM from the value
characteristic of apo-CRP, which in turn may be
responsible for this very small change. We have also
measured the distance between the two domains of CRP
in the complexes with DNA containing various sequences, such as lac and gal promoters and with the symmetric
sequence ICAP. For each CRP–DNA complex, the
increase in the distance between the two CRP domains
˚
has been observed with the average distance of 20.2 A.
This value is in good agreement with the value of
˚
20.7 A, calculated from the crystal structure of the CRP–
DNA complex [33].
The present results show that the binding of anti-cAMP
in the CRP–(cAMP)2 complex results in the movement of
˚
the C-terminal domain of CRP by % 8 A towards the
N-terminal domain, which in consequence leads to
rearrangement of DNA-binding domains and cAMPbinding domains of the protein. This finding clarifies the
suggestion derived from the NMR measurements [7] that
the C-terminus is closer to the N-terminal domain in apoCRP than in cAMP-bound CRP. Binding of cAMP to
anti-cAMP-binding sites leads to an increase in the
structural dynamic motion around Trp13, which is close
to the activation region AR2, responsible for the interaction of CRP with the a subunit of RNA polymerase. The
changes in the CRP dynamics on cAMP binding have
recently been observed by the hydrogen exchange method
[34]. In that paper, it was shown that binding of the
ligand to the protein causes the C-terminal domain of
CRP to become more flexible, in contrast with the Nterminal domain which is shifted to a less dynamic
conformation. Our results extend this observation and
suggest that the binding of cAMP to anti-cAMP-binding
sites of CRP leads to the increase in the structural
dynamic motion of at least Trp13, which is located in the
N-terminal domain of the protein.
Acknowledgements
We are grateful to Dr S. Garges for supplying us with the plasmid for
production of CRP. This work was supported by grant no.
6 P04A 031 16 from the State Committee for Scientific Research.
References
1. Busby, S. & Ebright, R. (1999) Transcription activation by Catabolite Activator Protein (CAP). J. Mol. Biol. 293, 199–213.
2. Harman, J.G. (2001) Allosteric regulation of the cAMP receptor
protein. Biochim. Biophys. Acta 2, 1–17.
3. de Crombrugghe, B., Busby, S. & Buc, H. (1984) Cyclic AMP
receptor protein: role in transcription activation. Science 224,
831–838.
4. Weber, I.T. & Steitz, T.A. (1987) Structure of a complex of cata˚
bolite gene activator protein and cyclic AMP refined at 2.5 A
resolution. J. Mol. Biol. 198, 311–326.
5. Parkinson, G., Wilson, C., Gunasekera, A., Ebright, Y.W.,
Ebright, R.E. & Berman, H. (1996) Structure of the CAP–DNA
˚
complex at 2.5 A resolution: a complete picture of the protein–
DNA interface. J. Mol. Biol. 260, 395–408.
6. Passner, J.M. & Steitz, T.A. (1997) The structure of a CAP–DNA
complex having two cAMP molecules bound to each monomer.
Proc. Natl. Acad. Sci. USA 94, 2843–2847.
Ó FEBS 2003
Conformational changes induced by cAMP and DNA binding to CRP (Eur. J. Biochem. 270) 1423
7. Won, Y.-S., Lee, T.-W., Park, S.-H. & Lee, B.-J. (2002) Stoichiometry and effect of the cyclic nucleotide binding to cyclic
AMP receptor protein. J. Biol. Chem. 277, 11450–11455.
8. Lin, S.-H. & Lee, J.C. (2002) Communications between the highaffinity cyclic nucleotide binding sites in E. coli cyclic AMP
receptor protein: effect of single site mutations. Biochemistry 41,
11857–11867.
9. Heyduk, T. & Lee, J.S. (1989) Escherichia coli cAMP receptor
protein: evidence for three protein conformational states with
different promoter binding affinities. Biochemistry 28, 6914–6924.
10. Taniguchi, T., O’Neill, M. & de Crombrugghe, B. (1979) Interaction site of Escherichia coli cyclic AMP receptor protein on
DNA of galactose operon promoters. Proc. Natl. Acad. Sci. USA
76, 5090–5094.
11. Mukhopadhyay, J., Sur, R. & Parrack, P. (1999) Functional roles
of the two cyclic AMP-dependent forms of cyclic AMP receptor
protein from Escherichia coli. FEBS Lett. 453, 215–218.
12. McKay, D.B. & Steitz, T.A. (1981) Structure of catabolite gene
˚
activator protein at 2.9 A resolution suggests binding to lefthanded B-DNA. Nature (London) 290, 744–749.
13. Sixl, F., King, R.W., Bracken, M. & Feeney, J. (1990) 19F-n.m.r.
studies of ligand binding to 5-fluorotryptophan- and 3-fluorotyrosine-containing cyclic AMP receptor protein from Escherichia
coli. J. Biochem. 266, 545–552.
14. Wasylewski, M., Małecki, J. & Wasylewski, Z. (1995) Fluorescence study of Escherichia coli cyclic AMP receptor protein.
J. Protein Chem. 14, 299–308.
15. Małecki, J., Polit, A. & Wasylewski, Z. (2000) Kinetic studies of
cAMP-induced allosteric changes in cyclic AMP receptor protein
from Escherichia coli. J. Biol. Chem. 275, 8480–8486.
16. Merck Inc. (1976) The Merck Index. 9th edn. Merck Inc.,
Rahway, NJ, USA.
17. Takahashi, M., Blazy, B. & Baudras, A. (1980) An equilibrium
study of the cooperative binding of adenosine cyclic 3¢,5¢-monophosphate and guanosine cyclic 3¢,5¢-monophosphate to the
adenosine cyclic 3¢,5¢-monophosphate receptor protein from
Escherichia coli. Biochemistry 19, 5124–5130.
18. Hudson, E.N. & Weber, G. (1973) Synthesis and characterization
of two fluorescent sulfhydryl reagents. Biochemistry 12, 4154–
4161.
19. Gill, S.C. & von Hippel, P.H. (1989) Calculation of protein coefficients from amino acids sequence data. Anal. Biochem. 182, 319–
326.
20. Wu, F.Y.-H., Nath, K. & Wu, C.-W. (1974) Conformational
transitions of cyclic adenosine monophosphate receptor protein of
Escherichia coli. A fluorescence probe study. Biochemistry 13,
2567–2572.
21. Gardner, J.A. & Matthews, K.S. (1991) Energy transfer in lactose
repressor protein modified with N-[[(iodoactyl) amino]ethyl]-5naphtylamine-1-sulfonate. Biochemistry 30, 2707–2712.
22. Wu, P. & Brand, L. (1994) Resonance energy transfer: methods
and applications. Anal. Biochem. 218, 1–13.
23. Lakowicz, J.R. (1999) Principles of Fluorescence Spectroscopy.
Kluwer Academic Publisher, Dordrecht, the Netherlands.
24. Eilen, E. & Krakow, J.S. (1977) Cyclic AMP-mediated intersubunit disulfide crosslinking of the cyclic AMP receptor protein
of Escherichia coli. J. Mol. Biol. 114, 47–60.
25. Ebright, R.H., Le Grice, S.F., Miller, J.P. & Krakow, J.S. (1985)
Analogs of cyclic AMP that elicit the biochemically defined conformational change in catabolite activator protein (CAP) but do
not stimulate binding to DNA. J. Mol. Biol. 182, 91–107.
26. Fairclough, R.H. & Cantor, C.R. (1978) The use of singlet-singlet
energy transfer to study macromolecular assemblies. Methods
Enzymol. 48, 347–379.
27. Selvin, P.R. (1995) Fluorescence resonance energy transfer.
Methods Enzymol. 248, 300–334.
28. Lakowicz, J.R., Maliwal, B.P., Cherek, H. & Balter, A. (1983)
Rotational freedom of tryptophan residues in proteins and peptides. Biochemistry 22, 1741–1752.
29. Passner, J.M., Schultz, S.C. & Steitz, T.A. (2000) Modelling
the cAMP-induced allosteric transition using the crystal
˚
structure of CAP-cAMP at 2.1 A resolution. J. Mol. Biol. 304,
847–859.
30. Błaszczyk, U., Polit, A., Guz, A. & Wasylewski, Z. (2002)
Interaction of cAMP receptor protein from Escherichia coli with
cAMP and DNA studied by dynamic light scattering and timeresolved fluorescence anisotropy methods. J. Protein Chem. 20,
601–610.
31. Søgaard-Andersen, L., Mironov, A.S., Pedersen, H., Sukhodelets,
V.V. & Valentin-Hansen, P. (1991) Single amino acid substitutions
in the cAMP receptor protein specifically abolish regulation by
the CytR repressor in Escherichia coli. Proc. Natl. Acad. Sci. USA
88, 4921–4925.
32. Garcia, A.E. & Harman, J.G. (1996) Simulations of CRP:
(cAMP)2 in noncrystalline environments show a subunits transition from the open to closed conformation. Protein Sci. 5, 62–71.
33. Schultz, S.C., Shields, G.C. & Steitz, T.A. (1991) Crystal structure
of a CAP–DNA complex: the DNA is bent by 90 degrees. Science
253, 1001–1007.
34. Dong, A., Małecki, J.M., Lee, L., Carpenter, J.F. & Lee, J.C.
(2002) Ligand-induced conformational and structural dynamics
changes in Escherichia coli cyclic AMP receptor protein. Biochemistry 41, 6660–6667.