Tài liệu Báo cáo Y học: Biphasic reductive unfolding of ribonuclease A is temperature dependent pdf
Bạn đang xem bản rút gọn của tài liệu. Xem và tải ngay bản đầy đủ của tài liệu tại đây (402.53 KB, 9 trang )
Biphasic reductive unfolding of ribonuclease A is temperature
dependent
Yong-Bin Yan
1,2
, Ri-Qing Zhang
1,2
and Hai-Meng Zhou
3
1
NMR Laboratory, Department of Biological Sciences and Biotechnology, Tsinghua University, Beijing, China;
2
State Key
Laboratory of Biomembrane and Membrane Biotechnology, Department of Biological Sciences and Biotechnology, Tsinghua
University, Beijing, China;
3
Protein Science Laboratory of the Ministry of Education, Department of Biological Sciences and
Biotechnology, Tsinghua University, Beijing, China
The kinetics of the reversible thermal unfolding, irreversible
thermal unfolding, and reductive unfolding processes of
bovine pancreatic ribonuclease A (RNase A) were investi-
gated in NaCl/P
i
solutions. Image parameters including
Shannon entropy, Hamming distance, mutual information
and correlation coefficient were used in the analysis of the
CD and 1D NMR spectra. The irreversible thermal
unfolding transition of RNase A was not a cooperative
process, pretransitional structure changes occur before the
main thermal denaturation. Different dithiothreitol (dithio-
threitol
red
) concentration dependencies were observed
between 303 and 313 K during denaturation induced by a
small amount of reductive reagent. The protein selectively
follows a major unfolding kinetics pathway with the selec-
tivity can be altered by temperature and reductive reagent
concentration. Two possible explanations of the selectivity
mechanism were discussed.
Keywords: image analysis; proton nuclear magnetic reson-
ance; reductive unfolding; thermal unfolding; unfolding
kinetics.
Dynamic analysis of the unfolding and refolding pathways
and identification of the specific conformational changes
which form the individual intermediates involved in the
rate-limited pathway(s) can distinguish one pathway from
another and play fundamental importance for protein
folding [1,2]. It is usually of considerable interest to estimate
the conformational changes of both the whole protein
tertiary structure and of specific sites observed by spectro-
scopic techniques in different redox systems and solvent
conditions. Protein unfolding is highly pertinent to protein
folding [3] and is more controllable for more comprehensive
study by slowing the unfolding process carried out at
physiological pH and temperature [4]. Such studies in turn
provide new insights into the functional properties and
mechanisms of proteins, which will lead to a more detailed
and more complete description of biological functions [5].
Bovine pancreatic ribonuclease A (RNase A; EC
3.1.27.5) contains 124 residues with four native disulfide
bonds (Cys26–Cys84, Cys40–Cys95, Cys58–Cys110, and
Cys65–Cys72). RNase A has played a crucial role as a
model system in studies of protein structure, folding,
stability, and chemistry [6]. It folds and unfolds through
multiple pathways, with the rate-limiting steps in the well-
populated pathways involving the formation of distinct
transition intermediates [1–3,7,8]. The complexity of the
multiple pathways means that different mechanisms may
occur with different types of redox systems and different
solvent conditions [9,10]. Thus a comprehensive investiga-
tion under different conditions using different methods is
essential to elucidate the protein folding and unfolding
processes.
Much effort has been devoted in recent years to
understanding the mechanism and the main factors that
control protein folding, and to developing approaches that
allow researchers to investigate the multifarious aspects of
protein folding and unfolding. While the determination of
the protein structural transitions that occur in the pathways
is at the heart of studies on unfolding and refolding
processes [10], dynamic analysis of the different processes is
necessary to evaluate the different pathways. These studies
will also clarify the key factor(s) controlling the processes
and clarify the unfolding and refolding mechanism associ-
ated with the redox properties and solvent conditions.
Therefore, we have used
1
H NMR spectra to investigate the
unfolding dynamics of RNase A during denaturation by
different concentrations of reductive reagent dithiothreitol
(dithiothreitol
red
) at different temperatures. Similar studies
were carried out by Rothwarf and Scheraga [10] in which
the temperature dependence of RNase A regeneration was
studied with dithiothreitol
ox
/dithiothreitol
red
and GSSG/
GSH systems. Their results suggested that the regeneration
process with the two types of redox reagents proceeded
through different pathways with significantly different
temperature dependencies. Here we present a temperature
Correspondence to Y B. Yan, Department of Biological Sciences
and Biotechnology, Tsinghua University, Beijing 100084, China.
E-mail: or H M. Zhou, Department of
Biological Sciences and Biotechnology, Tsinghua University,
Beijing 100084, China. E-mail:
Abbreviations: C, Correlation coefficient; des-[40–95], RNase A
lacking the 40–95 disulfide bond; des-[65–72], RNase A lacking the
65–72 disulfide bond; DSS, 2,2-dimethyl-2-sila-pentanesulfonate;
FID, free induction decay; GSH, reduced glutathione; GSSG,
oxidized glutathione; H, Shannon entropy; HD, Hamming distance;
MI, Shannon mutual information; RNase A, Bovine pancreatic
ribonuclease A.
(Received 23 June 2002, revised 3 September 2002,
accepted 11 September 2002)
Eur. J. Biochem. 269, 5314–5322 (2002) Ó FEBS 2002 doi:10.1046/j.1432-1033.2002.03251.x
dependence study based on the same reductive reagent
(dithiothreitol
red
) but different reagent concentrations. In
addition to discussing the temperature effect, the thermal
denaturation transition of RNase A and the effect of the
reductive reagent concentration, which have not been
previously associated with protein folding and unfolding,
will also be discussed. A new approach of image analysis,
which is established by us recently [4,11], was used to
analyze the unfolding dynamics and also was introduced
into the analysis of the thermal transition study by CD and
1
HNMR.
MATERIALS AND METHODS
Sample preparation
Highly purified lyophilized ribonuclease A (type XII-A, lot
110K7665) from bovine pancreas (RNase A) was pur-
chased from Sigma Chemical Co. (St. Louis, MO, USA)
and used without further purification. Dithiothreitol
red
was
also a product of Sigma Chemical Co. All other reagents
were of the highest grade commercially available. Samples
of the native RNase A were dissolved in 0.5 mL 100 m
M
NaCl/P
i
or triple-distilled water, pH 8.0. The protein
concentration was 14 mgÆmL
)1
(for NMR measurements)
or 0.3 mgÆmL
)1
(for CD measurements). The NMR
samples contained 10% D
2
O to provide a signal for the
lock and the final pH was 7.6 which was measured with no
corrections for isotope effects.
NMR Spectroscopy
All
1
H NMR experiments were carried out on a Bruker
AM 500 superconductor spectrometer (Bruker, Fa
¨
llanden,
Switzerland) at Tsinghua University. The carrier frequency
wasfixedatthecenteroftheH
2
O/HOD resonance
frequency. The chemical shifts of the spectra were referenced
to the most upfield resonance which in turn had been
calibrated against 2,2-dimethyl-2-sila-pentanesulfonate
(DSS). The 90° pulse width was 6.5 ls, the sweep width
was 8333 Hz and each FID had 400 scans or 240 scans with
16 K data points. Two dummy scans were performed for
each FID with a recycle delay of 1.8 s or 1 s. Solvent
suppression was carried out by presaturation at all times
except during acquisition. For a given sample, the unfold-
ing experiments were carried out over a contiguous block
of time (about 10–72 h) without removing the sample from
the spectrometer. The Fourier transform of the FID signal
was obtained without additional modification. The phase
correction parameters were the same as for the first
spectrum.
The irreversible thermal transition measurements was
carried out by increasing the temperature in one degree steps
from 303 to 333 K. Approximately 5 min was allowed for
thermal equilibration at each measured temperature. The
spectra were collected at 30 min intervals (including thermal
equilibration), with 400 scans per spectrum to get a better
signal to noise ratio.
The experimental temperature for the reductive unfolding
was maintained at 303, 308 and 313 K. The protein stability
was examined by maintaining the sample without dithio-
threitol
red
at 313 K for 48 h and no difference was found
between the original and end spectra (data not shown).
RNase A was unfolded with a dithiothreitol
red
concentra-
tion of 10–100 m
M
(10–100-fold molar excess of the protein,
see below). Spectra were collected every 20 min or 8 min
after dithiothreitol
red
was added. Zero corresponds to the
dithiothreitol
red
injection time into the cold NMR tube. To
allow for temperature equilibrium and operational delay,
the first spectra were obtained at 10 min. RNase A was also
reduced with a 100-fold molar excess of dithiothreitol
red
in
NaCl/P
i
at 313 K for comparison of the reductive denatur-
ation endpoint (a complete unfolding was obtained in 4 h
with 100-fold molar excess of dithiothreitol
red
)[1].No
aggregation was observed along the experiments.
The data analysis was carried out by spectral image
analysis method established recently [4,11]. The spectrum
parameters (Shannon entropy, H; Mutual Shannon Infor-
mation, MI and Correlation coefficient, C) that describe the
nature of each image (spectrum) and the correlation
between different images were calculated using
MATLAB
software (
MATLAB
5.2, The MathWorks, Inc., Natick,
MA, USA) by programs developed in-house. The spectral
window for the reductive unfolding analysis was 6.3–
10.0 p.p.m. The thermal denaturation curves were repre-
sented directly by these parameters, while the Hamming
distance was calculated instead of the mutual information.
The reductive unfolding kinetics was analyzed by a linear
expansion least-squares algorithm and graphically using a
least mean squares fit procedure. The rate constant errors
were defined as the standard deviation.
Thermal denaturation monitored by CD
spectropolarimetry
CD measurements were performed on a Jasco J-715
spectropolarimeter equipped with a thermoelectrically con-
trolled cell holder. CD spectra of RNase A in NaCl/P
i
and
in triple-distilled water were measured in the far-UV range
(195–245 nm) in 2 mm pathlength quartz cells. For the
thermal denaturation, the measurements were typically
made at two degree intervals in the temperature range from
293 to 353 K, at a heating rate of 1 KÆmin
)1
. Spectra were
scanned twice at a rate of 100 nmÆmin
)1
, a resolution of
0.5 nm, and a bandwidth of 1 nm.
The thermal denaturation curves were obtained by
measuring the ellipticity at 222 nm and analyzed with a
nonlinear least-squares algorithm. The image parameters
(H, HD, C) were also calculated for the image analysis of the
CD spectra. The calculating routines were the same as those
for the NMR spectra. Curve fits was obtained by the
standard method using the Marqurdt-Levenberg routine
[12] as provided in the
ORIGIN
6.0 software (Microcal Inc.,
Northampton, MA, USA).
RESULTS
The thermal stability of proteins, especially enzymes, has
long been a practical concern, because this is usually the
factor that most limits their usefulness. Moreover, tempera-
ture and the relevant free energy change DG, usually
influence the behavior of protein folding and unfolding.
Both the protein folding and unfolding processes are
accelerated by increased temperature. Protein conformation
ensembles are undoubtedly affected by temperature, but can
temperature affect the folding and unfolding mechanism of
Ó FEBS 2002 Temperature dependence of protein unfolding kinetics (Eur. J. Biochem. 269) 5315
proteins due to the different conformation ensembles at
different temperatures. This research investigates the rela-
tionship between the unfolding mechanism and the con-
formational change at different temperatures.
Thermal denaturation measured by far-UV CD
The changes in the secondary structure of RNase A as a
function of temperature were followed by CD measure-
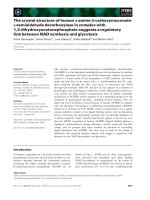
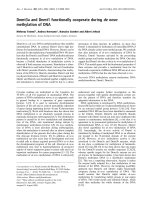
ments. Figure 1A shows the reversible thermal transition
curves of RNase A in triple-distilled water and in NaCl/P
i
measured by far-UV CD spectra at 222 nm. To compare
the results from NMR spectra, the spectral image param-
eters, Shannon entropy (H), correlation coefficient (C)anda
new parameter, Hamming distance (HD), were introduced
into the CD spectra analysis (mutual information was not
presented for large errors). Figure 1B,D show the thermal
transition curves described by the Shannon entropy and the
correlation coefficient. HD is defined as
HD ¼
1
N
X
abs h
ki
À h
kj
ÀÁ
ð1Þ
where h
k
means the ellipticity at k nm, N means the number
of data points used in the calculation, i and j are the CD
spectra at temperatures i and j. Here, we used i ¼ 1to
calculate the relative ellipticity change referenced to the first
CD spectra. The relative ellipticity change rate can be
calculated by j ¼ i + 1 (data not shown). It can be seen in
Fig. 1C that the Hamming distance exactly reflects the
ellipticity change but with minimal errors relative to the
traditional method. All these parameters present a well-
defined two-state process for RNase A thermal denatura-
tion, which is consistent with the Ômultiprobe principleÕ [13].
The thermodynamic properties obtained from the curves in
Fig. 1 and given in Table 1 are quite consist with previous
studies [14]. The data clearly indicates that RNase A in
NaCl/P
i
andinH
2
O have a similar transition properties but
those in NaCl/P
i
are more stable. A small amount (5–10%)
of irreversible denaturation was observed reproducibly in
both solutions.
Irreversible thermal denaturation measured by NMR
The extent of irreversible denaturation of proteins has been
determined previously to depend on the protein concentra-
tion and the period of time that the protein solution is
incubated at the higher temperatures during the heating and
cooling process [15]. Therefore, the denaturation and
renaturation times were usually chosen which minimize
the thermal equilibration at each temperature. However, a
temperature appearing in the predenaturation part of a
thermodynamic curve does not mean stabilization for
relatively long-term investigations at this temperature. Thus,
a thermal denaturation study of a high concentration
protein used in reductive unfolding studies will be useful to
determine the initial conformational ensembles of the
investigation. Here we present a study of irreversible
unfolding using image analysis of the NMR spectra to
Fig. 1. Thermal denaturation profiles of
RNase A in H
2
O(s) and in NaCl/P
i
(h)
measured by far-UV CD spectra presented by
(A) ellipticity at 222 nm; (B) Shannon entropy;
(C) Hamming distance; (D) correlation
coefficient.
Table 1. Thermodynamic properties of RNase A. The errors were
calculated as the standard deviations of the curve fits.
T
m
(K)
DH
0
(T
m
)
(kJÆmol
)1
)
DS
0
(T
m
)
(eu)
CD in H
2
O
h
222
337.9 ± 0.7 419 ± 33 1.24 ± 0.09
HD 337.7 ± 0.2 364 ± 11 1.08 ± 0.03
H 338.6 ± 0.9 389 ± 48 1.15 ± 0.15
C 342.2 ± 0.4 421 ± 18 1.23 ± 0.05
CD in NaCl/P
i
h
222
340.1 ± 0.6 426 ± 37 1.25 ± 0.1
HD 340.6 ± 0.2 388 ± 12 1.14 ± 0.03
H 341.0 ± 0.9 535 ± 76 1.5 ± 0.2
C 345.6 ± 0.8 466 ± 17 1.35 ± 0.05
NMR in NaCl/P
i
CH3(Val63) 318.84 ± 0.09
HD 321
H (upfield) 321.5
MI 320
C 320
5316 Y B. Yan et al. (Eur. J. Biochem. 269) Ó FEBS 2002
investigate the relationship between the protein initial
conformational ensembles and the reductive unfolding
mechanism for different temperatures.
The dynamics of the thermal transition can be analyzed
by observing specific resonance’s split phenomena, chemical
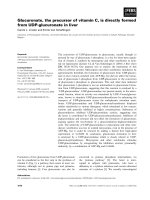
shift changes and the integral areas. The resonance at
0.4 p.p.m. was resolved as CH
3
of Val63. Its thermody-
namic curve is shown in Fig. 2 as a typical two-state process.
If the protein shows a cooperative two-state transition
during the thermal unfolding process, the thermodynamic
curves obtained by different parameters should give similar
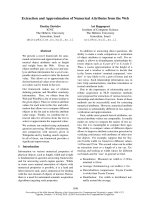
results. The image parameters (H, MI, C, HD)calculatedto
characterize the
1
H NMR spectra of the thermal unfolding
process of RNase A are presented in Fig. 3. As described
previously [4, 11], Shannon entropy values reflect the
ÔentropyÕ of the spectra, which is the sum probability of
the peak intensity in a certain region. In other words, the
H-values reflect the dispersion properties of the resonance in
selected regions. Mutual Shannon information reflects the
correlation of the Shannon entropy between the corres-
ponding data of two spectra. The MI value increases as the
degree of correlation increases. MI reflects how many
unchangeable parts occur in the spectra. The correlation
coefficient reflects the correlation between two spectra using
their covariance. A larger value of C indicates more
correlation. In Fig. 3, the significant increase of the values
above 323 K in the downfield region was due to the protein
aggregation and bad resolution. Three of these parameters
have similar curves between the downfield and upfield
region if the aggregation parts are ignored. The HD values
have nearly equal curves, while the Shannon entropy values
have rather different curves between the downfield and
upfield regions which may be due to the H-values of the
downfield region is more affected by the change of
microenvironment. No clear explanation can be given
now for the differences obtained from H. One explanation
may be that H cannot exactly reflect the main changes
during thermal denaturation. A second explanation may be
that there are some significant conformational differences
that were only be observed by H. However, there were some
conformational differences between 303 and 313 K, and the
thermal transition curves characterized by C and HD were
flat between 310 and 316 K, which suggests a relative
thermal stabilization. The transition between 310 and 323 K
characterized by MI, C,andHD shows a similar two state
transition to Fig. 3. The T
m
values obtained from the MI, C
and HD curves are presented in Table 1. Though the
thermal transition is irreversible when the protein is heated
to 323 K, it is nearly reversible (% 95%) in the temperature
range of 301–319 K (data not shown).
Reductive denaturation
The reductive denaturation of 1 m
M
RNase A induced by
10–100 m
M
dithiothreitol
red
at 303, 308 and 313 K was
investigated by image analysis of the 1D NMR spectra as
Fig. 2. Integral area of CH3(Val63) during irreversible thermal dena-
turation of RNase A in 0.5 mL 100 m
M
NaCl/P
i
buffer.
Fig. 3. Time course of Shannon entropy (A),
mutual information (B), correlation coefficient
(C), and Hamming distance (D) values of
1
H
NMR spectra during irreversible thermal
denaturation of RNase A. (s) Upfield region
and (h) downfield region.
Ó FEBS 2002 Temperature dependence of protein unfolding kinetics (Eur. J. Biochem. 269) 5317
performed in a previous paper [4]. As relatively low
dithiothreitol
red
concentrations (only 10–100-fold molar
excess of the protein) and relatively high temperatures were
used, no intermediates peaks were observed from the 1D
NMR spectra or 2D NOESY NMR spectra (data not
shown). The image parameters (Shannon entropy, mutual
information, and correlation coefficient) were calculated to
characterize the unfolding process of RNase A induced by
dithiothreitol
red
. The Hamming distance is not presented
because the curve is similar to those of the other parameters.
All the results were fit best by a model of two consecutive
first-order reactions, with rate constants listed in Table 2. A
comparison of the rate constants from MI for different
dithiothreitol
red
concentrations and different temperatures
is presented in Figs 4 and 5 (Similar curves can be obtained
from other parameters).
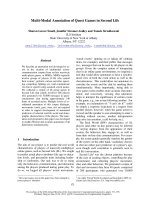
As can be seen in Fig. 4A,B, the rate constants increased
while increasing temperature, as described in a previous
paper [4]. The rate constants of the fast process (k
f
) have
similar increases with temperature at the two dithiothrei-
tol
red
concentrations. It should be noted that the rate
constants of the slow process (k
s
) increased dramatically
when the temperature was increased from 303 to 313 K for
a dithiothreitol
red
concentration of 30 m
M
, while no such
large increase occurred for a dithiothreitol
red
concentration
of 50 m
M
. Figure 5A,B present the relationships between
the rate constants and the dithiothreitol
red
concentration at
different temperatures. The dithiothreitol
red
concentration
affected the fast and slow process unfolding rate constants
in a complex way. The k
f
values increased similarly when the
dithiothreitol
red
concentration was increased from 30 m
M
to
50 m
M
at different temperatures. As the dithiothreitol
red
concentration was increased from 30 m
M
to 50 m
M
,thek
s
values increased at 303 K, but decreased dramatically at 308
and 313 K.
DISCUSSION
It has been proposed that the regeneration of RNase A
follows different pathways in the GSSG/GSH and dithio-
threitol
ox
/dithiothreitol
red
systems [9]. Li et al. also found
that the reductive unfolding of RNase A took a parallel
biphasic pathway for unfolding induced by dithiothreitol
red
[3]. Recent studies demonstrated that the oxidative folding
of RNase A has a multiple pathway mechanism [7,8,16–18].
Although the oxidative regeneration and the reductive
cleavage of the disulfide bond were suggested to be
kinetically the same [3], des-[65–72] RNase A is thought
to be the most highly populated intermediate in the
unfolding pathways [19]. However, the unfolding and
Table 2. Rate constants for changes in Shannon entropy, mutual information and correlation coefficient observed in the reductive denaturation of 1 m
M
RNase A in NaCl/P
i
, at 313 K,308 K and 303 K.
Temperature
(K)
[dithiothreitol
red
]
(m
M
)
k
H
(10
4
min
)1
)
a
k
MI
(10
4
min
)1
)
a
k
C
(10
4
min
)1
)
a
k
Hf
k
Hs
k
MIf
k
MIs
k
Cf
k
Cs
313 50 618
b
4.4 731 8.3 436 7.8
313 30 370 6.8 435 18.2 429 12.2
313 20 335 5.6 279 11.1 211 8.9
313 10 134 1.4 143 4.8 106 4.8
308 100 140 1.5 145 4.0 146 3.8
308 50 149 1.6 183 3.7 118 5.1
308 30 57 0.9 61 5.9 57 4.3
303 100 55 3.0 62 6.9 70 3.0
303 50 56 1.4 52 3.4 40 3.4
303 30 13 0.14 15 0.4 10.8 0.12
a
Rate constants of Shannon entropy, mutual information and correlation coefficient, respectively.
b
The errors were of the order of 20–30%
determined by repeating experiments.
Fig. 4. Comparison of the fast and slow process rate constants, k
f
(A)
and k
s
(B), from mutual information as a function of temperature reduced
by 30 m
M
and 50 m
M
dithiothreitol
red
.
5318 Y B. Yan et al. (Eur. J. Biochem. 269) Ó FEBS 2002
folding processes, especially at relatively high temperatures
[20], of the protein are usually dominated by a major
pathway related to a major rate-determining intermediate in
similar redox systems. For a single pathway, the biphasic
process can be expressed as
N À!
k
1
I À!
k
2
U ð2Þ
where N, I, and U mean the native state, transition
intermediate, and unfolding state, respectively. The
observed image parameter rate constants, k
f
and k
s
,can
be expressed by a
1
k
1
[N][dithiothreitol
red
], a
2
k
2
[I][dithiothre-
itol
red
], where a
1
and a
2
are defined as the link constants
between the image parameter rates and the actual rates. If
the unfolding process of RNase A was dominated by a
major pathway, the observed rate constants should increase
as the dithiothreitol
red
concentration increased. Thus the
results shown in Fig. 5 cannot be explained by a single or
major pathway mechanism although similar redox systems
were used. The dithiothreitol
red
concentration and the
temperature have a relatively simple effect on the rate
constants of the fast process (Figs 4A and 5A), but have a
complex effect on the rate constants of the slow process
(Figs 4B and 5B). As there are multiple unfolding pathways
with multiple three disulfide intermediates [7,8,16–18], these
intermediates seem have different sensitivities to dithiothre-
itol
red
and thus may exhibit different kinetics from NMR
spectra. Therefore, a change in dithiothreitol
red
concentra-
tion will change the relative population of these intermedi-
ates, which will be reflected by the image analysis of the
NMR spectra. These results suggest that the external
solvent conditions affect the properties of the unfolding
rate-limiting intermediates. Thus different unfolding inter-
mediates may dominate under different solvent conditions.
A possible mechanism for the results in Figs 4 and 5 is
shown in Fig. 6. The protein presents a selective behavior of
unfolding process under different conditions. The selectivity
of the major unfolding pathway may be altered by the
temperature and the dithiothreitol
red
concentration, though
the mechanism for this selectivity is not clear now. The
effects of pH and phosphate concentration were also
studied, and it was found that ions only affect the rate of
protein unfolding but have no effect on the pathways
(data not shown). N
313
and N
303
mean the different
conformational ensembles at 313 and 303 K (Fig. 6). The
free energy change for folding at any temperature DG(T),
can be obtained using the modified Gibbs-Helmholtz
equation [21],
DGðTÞ¼DH
m
ð1 À T=T
m
Þ
þ DC
p
½ðT À T
m
ÞÀT lnðT=T
m
Þ ð3Þ
Here DC
p
¼ 1.15 (0.08 kcalÆK
)1
Æmol
)1
as recently obtained
by Pace et al. [22]. Using the parameters listed in Table 1,
the DG(T) change between 313 and 303 K was calculated to
be 6.6 ± 0.4 kJÆmol
)1
(1.6 ± 0.1 kcalÆmol
)1
). Though
there is no other evidence that the conformation of
RNase A at 313 K is stabilized by a thermal transition
state, the different features of the NMR spectra at 303 and
320 K suggest different molecular chemical environments.
Such microenvironmental changes, like the effects induced
by ions [13,20,22–24], may result in changes of the protein
behavior. It has been proposed that the nonzero surface
exposure of Cys40 and Cys65 causes the 40–95 and 65–72
disulfides in RNase A to be the first to break [3]. Thus one
possible explanation of the mechanism in Fig. 6 might be
that the conformational ensembles at 313 K, a relatively
high energy state, may result in little difference between the
cystine (or the amino-acid residues around cystine) surface
exposures. This may also explain the complexity of the rate
constant changes between 15 and 25 °C observed by Li
Fig. 6. Possible reductive unfolding pathways of RNase A at 303 and
313 K in NaCl/P
i
,pH8.0.N
313
and N
303
represent the different con-
formational assemblies at 303 and 313 K. I
1
and I
2
represent two dis-
tinct unfolding rate-determining intermediates, while U represents the
unfolded state of RNase A.
Fig. 5. Comparison of the fast and slow process rate constants, k
f
(A)
and k
s
(B), from mutual information as a function of dithiothreitol
red
concentration reduced under three temperatures.
Ó FEBS 2002 Temperature dependence of protein unfolding kinetics (Eur. J. Biochem. 269) 5319
et al. [3]. The major parts of intermediates I
1
and I
2
are
likely to be the three-disulfide-intact species, though they are
not characterized here. Thus the selectivity of the breakage
of the first disulfide may be altered by the different cystine
surface exposures induced by temperature and dithiothre-
itol
red
concentration.
Another possible explanation of the selectivity mechan-
ism dependence on temperature and reductive reagent
concentration in Fig. 6 may be obtained from the studies of
the folding intermediate properties. The solution structure
and the thermodynamics of the analogs of the major and
minor rate-determining three-disulfide folding intermediates
have been characterized in recent years [25–27]. The
thermodynamic parameters for these analogs are summar-
ized in Table 3. All the T
m
values of these analogs are lower
than 313 K (% 40 °C) at pH 4.6. The major intermediate,
des-[65–72] RNase A, was more stable than the minor
intermediate, [C40A, C95A] RNase A. The thermal
unfolding of des-[65–72] RNase A began at about 303 K
and ended at about 318 K [25], while thermal unfolding of
[C40A, C95A] RNase A began at about 298 K and ended
at about 313 K at pH 4.6. Considering the pH effect on T
m
,
the T
m
values are expected to well above 313 K at neutral
pH [28]. The dramatic increase of k
s
from 303 to 313 K
(Fig. 4B) may result from such intermediate thermody-
namic properties. The close-to-unfolding state at 313 K of
the three-disulfide intermediates may drive the slow process
to the unfolded state. The selectivity mechanism may
therefore arise from the different thermodynamic properties
between the two intermediates. At 313 K, des-[40–95]
RNase A was closer to the midpoint of the thermal
unfolding transition than des-[65–72] RNase A. Such a
difference accompanied by the increased concentration of
the reductive reagent may lead the (major) unfolding
process along different pathways. The thermodynamic
properties may also resulted in the disulfide reshuffling at
such a relatively high temperature of 313 K, though few
populated intermediates were observed during the unfolding
process (see Results).
Recently Sogbein et al. [29] reported that pH has a
pronounced influence on the kinetic mechanism of myo-
globin unfolding. Their results show that myoglobin unfolds
through a short-lived intermediates only at acidic pH, with
no intermediates observed for basic conditions. Our results
suggest that the protein kinetic unfolding mechanism might
depend on external solvent conditions such as temperature.
Sogbein et al. hypothesized that the observed pH depend-
ence of the protein unfolding mechanism could be related to
the pH dependence of heme solubility [29]. From the
temperature and reductant concentration dependence of the
protein unfolding mechanism presented in this paper, we
can further hypothesize that the observed difference in the
protein unfolding behavior could be related to different
initial conformational ensembles for different external
solvent conditions. Furthermore, the protein unfolding
behavior could be related to different conformational
stabilities which could be demonstrated by different free
energy change for different external conditions. It should be
noted that such the free energy change is not distributed
equally among every amino-acid residue of a well-folded
protein. Thermal denaturation studies can help elucidate the
structural stabilities of proteins. Traditionally such studies
used a simple two-state mechanism of thermally induced
transitions in small, compact globular proteins, which are
thought to act as single stage systems. Many groups have
identified the multiple steps involved in thermal unfolding
pathways [30,31]. A theoretical model was presented
recently to study the stepwise thermal unfolding of globular
proteins using the stabilizing or destabilizing characteristics
of amino-acid residues in protein crystals [32]. All these
results show that in RNase A, the a helix of the shell
residues around 16–22 unfolds in the temperature range
303–318 K, while the b sheet segment 106–118 is relatively
stable thermally. Our experiments also confirmed that
structural changes occur in RNase A before the main
thermal denaturation transition (Fig. 2). The pretransition
structural changes occurring in a temperature range of
Table 3. Thermodynamic properties of the analogs of the rate-determining three-disulfide folding intermediates.
pH T
m
(°C) DH
0
(T
m
) (kcalÆmol
)1
) DS
0
(T
m
) (eu)
C[65–72]S RNase A
a
6.4 44
[C65S, C72S] RNase A
b
4.6 38.5 ± 0.2 83.7 ± 2 269 ± 8
des-[65–72] RNase A
c
4.6 38.4 ± 0.4 80.3 ± 8 258 ± 24
C[40–95]S RNase A
a
6.4 42
[C40A, C95A] RNase A
d
4.6 33.7 ± 0.2 72.9 ± 3.7 238 ± 12
[C40S, C95S] RNase A
d
4.6 33.6 ± 0.2 71.5 ± 1.8 231 ± 6
a
Data from Laity et al. [28].
b
Data from Shimotakahara et al. [26].
c
Data from Talluri et al. [25].
d
Data from Laity et al. [27].
Fig. 7. Effect of external solvent conditions on the kinetic mechanism of
protein unfolding. N
T(a)
and N
T(b)
represent the initial conformational
assemblies under different solvent conditions. I
1
and I
2
represent two
distinct unfolding intermediates or different energy states of one
intermediate. U
T(a)
and U
T(b)
represent the different unfolding assem-
bles under different solvent conditions. #1 and #2 represent the fast
and slow transition states.
5320 Y B. Yan et al. (Eur. J. Biochem. 269) Ó FEBS 2002
303–318 K may result in significant structural changes of
RNase A between 303 and 313 K though the tertiary
structure is still maintained as was confirmed by CD
measurements. The influence of different initial conforma-
tional ensembles on the selectivity of the protein unfolding
kinetics is shown in Fig. 7. The different pathways show
how the external solvent conditions such as temperature
affects the kinetic mechanism of protein unfolding. If the
external effect is significant, such as the pH effect on
myoglobin unfolding, the protein selectively follows a
different unfolding kinetics pathway. If the external effect
is very small, the protein follows a simpler pathway (where
I
1
and I
2
are the same rate-limiting intermediates).
In conclusion, the irreversible thermal unfolding trans-
ition of RNase A is not a cooperative process, pretransi-
tional structure changes occur before the main thermal
denaturation. The different initial conformational ensem-
bles at 303 and 313 K may lead to the different dependen-
cies on the reductive reagent concentration of the biphasic
pathway reductive denaturation. The protein selects a
preferred one from several major pathways with the
selectivity altered by temperature and reductive reagent
concentration. The two possible explanations of the selec-
tivity mechanism described here need to be clarified by more
detailed investigations.
ACKNOWLEDGEMENTS
This investigation was supported by the National Key Basic Research
Special Funds, P. R. China, No. G1999075607, the National Key
Science and Technology Item, P. R. China, no. 96-900-09-03, the 985
Funds of Tsinghua University, P. R. China and THSJZ of Tsinghua
University, P. R. China. The authors also thank Dr Bo Jiang, Dr Sen
Li, Mrs Xue-Chun Luo, Mrs Xiao-Lan Ding at Tsinghua University,
P. R. China, and Dr Guang-Zhong Tu at the Institute of Microchem-
istry, P. R. China for expert technical assistance.
REFERENCES
1. Rothwarf, D.M. & Scheraga, H.A. (1993) Regeneration of bovine
pancreatic ribonuclease A. 1. Steady-state distributon. Biochem-
istry 32, 2671–2679.
2. Rothwarf, D.M. & Scheraga, H.A. (1993) Regeneration of bovine
pancreatic ribonuclease A. 2. Kinetics of regeneration. Biochem-
istry 32, 2680–2689.
3. Li, Y.J., Rothwarf, D.M. & Scheraga, H.A. (1995) Mechanism of
reductive protein unfolding. Nat. Struct. Biol. 2, 489–494.
4. Yan, Y B., Jiang, B., Zhang, R Q. & Zhou, H M. (2001)
Two-phase unfolding pathway of ribonuclease A during dena-
turation induced by dithiothreitol. Protein Sci. 10, 321–328.
5. Alexandrescu, A.T., Rathgeb-Szbo, K., Rumpel, K., Jahnke, W.,
Schulthess,T.&Kammerer,R.(1998)
15
N backbone dynamics of
the S-peptide from ribonuclease A in its free and S-protein bound
forms: Toward a site-specific analysis of entropy changes upon
folding. Protein Sci. 7, 389–402.
6. Raines, R.T. (1998) Ribonuclease A. Chem. Rev. 98, 1045–1065.
7. Rothwarf, D.M., Li, Y J. & Scheraga, H.A. (1998) Regeneration
of bovine pancreatic ribonuclease A: identification of two native
like three-disulfide intermediates involved in separate pathway.
Biochemistry 37, 3760–3766.
8. Rothwarf, D.M., Li, Y J. & Scheraga, H.A. (1998) Regener-
ation of bovine pancreatic ribonuclease A: detailed kinetic
analysis of two independent folding pathways. Biochemistry 37,
3767–3776.
9. Rothwarf, D.M. & Scheraga, H.A. (1993) Regeneration of bovine
pancreatic ribonuclease A. 3. Dependence on the nature of the
redox reagent. Biochemistry 32, 2690–2697.
10. Rothwarf, D.M. & Scheraga, H.A. (1993) Regeneration of bovine
pancreatic ribonuclease A. 4. Temperature dependence of the
regeneration rate. Biochemistry 32, 2698–2703.
11. Yan,Y B.,Luo,X C.,Zhou,H M.&Zhang,R Q.(2002)Two-
state kinetics characterized by image analysis of nuclear magnetic
resonance spectra. Chinese Sci. Bull. 47, 389–393.
12. Jackson, S.E. & Fersht, A.R. (1991) Folding of chymotrypsin
inhibitor 2. 1. Evidence for a two-state transition. Biochemistry 30,
10428–10435.
13. Poklar, N., Petrovc
ˇ
ic
ˇ
, N., Oblak, M. & Vesnaver, G. (1999)
Thermodynamic stability of ribonuclease A in alkylurea solutions
and preferential solvation changes accompanying its thermal
denaturation: a calorimetric and spectroscopic study. Protein Sci.
8, 832–840.
14. Reinsta
¨
dler, D., Fabian, H., Backmann, J. & Naumann, D. (1996)
Refolding of thermally and urea-denatured ribonuclease A mon-
itored by time-resolved FTIR spectroscopy. Biochemistry 35,
15822–15830.
15. Pace, C.N., Shirley, B.A. & Thomson, J.A. (1989) Measuring the
conformational stability of a protein. In Protein Structure,
a Practical Approach (Creighton, T.E., ed.), pp. 311–330. IRL
Press, New York.
16. Iwaoka, M., Juminaga, D. & Scheraga, H.A. (1998) Regeneration
of three-disulfide mutants of bovine pancreatic ribonuclease A
missing the 65–72 disulfide bond: characterization of a minor
folding pathway of ribonuclease A and kinetic roles of Cys65 and
Cys72. Biochemistry 37, 4490–4501.
17. Xu, X.B. & Scheraga, H.A. (1998) Kinetic folding pathway of a
3-disulfide mutant of bovine pancreatic ribonuclease A missing the
(40–95)-disulfide bond. Biochemistry 37, 7561–7571.
18. Welker, E., Narayan, M., Volles, M.J. & Scheraga, H.A. (1999)
Two new structured intermediates in the oxidative folding of
RNase A. FEBS Lett. 460, 477–479.
19. Yamamoto, K., Mizutani, Y. & Kitagawa, T. (2000) Nanosecond
temperature jump and time-resolved Raman study of thermal
unfolding of ribonuclease A. Biophys. J. 79, 485–489.
20. Pace, C.N., Hebert, E.J., Shaw, K.L., Schell, D., Both, V.,
Krajcikova, D., Sevcik, J., Wilson, K.S., Dauter, Z., Hartley,
R.W. & Grimsley, G.R. (1998) Conformational stability and
thermodynamics of folding of ribonucleases Sa, Sa2, Sa3. J. Mol.
Biol. 279, 271–286.
21. Pace, C.N., Grimsley, G.R., Thomas, S.T. & Makhatadze, G.I.
(1999) Heat capacity change for ribonuclease A folding. Protein
Sci. 8, 1500–1504.
22. Collins, K.D. (1997) Charge density-dependent strength of
hydration and biological structure. Biophys. J. 72, 65–76.
23. Kaushik, J.K. & Bhat, R. (1999) A mechanistic analysis of the
increase in the thermal stability of proteins in aqueous carboxylic
acid salt solutions. Protein Sci. 8, 222–233.
24. Low, L.K., Shin, H C., Narayan, M., Wedemeyer, W.J. &
Scheraga, H.A. (2000) Acceleration of oxidative folding of bovine
pancreatic ribonuclease A by anion-induced stabilization and
formation of structured native-like intermediates. FEBS Lett. 472,
67–72.
25. Talluri, S., Rothwarf, D.M. & Scheraga, H.A. (1994) Structural
characterization of a three-disulfide intermediate of robonuclease
A involved in both folding and unfolding pathways. Biochemistry
33, 10437–10449.
26. Shimotakahara, S., Rios, C.B., Laity, J.H., Zimmerman, D.E.,
Scheraga,H.A.&Montelione,G.T.(1997)NMRstructural
analysis of an analog of an intermediate formed in the rate-
determining step of one pathway in the oxidative folding of bovine
pancreatic ribonuclease A: automated analysis of
1
H,
13
C, and
15
N
Ó FEBS 2002 Temperature dependence of protein unfolding kinetics (Eur. J. Biochem. 269) 5321
resonance assignments for wild-type and [C65S,C72S] mutant
forms. Biochemistry 36, 6951–6929.
27. Laity, J.H., Lester, C.C., Shimotakahara, S., Zimmerman, D.E.,
Montelione, G.T. & Scheraga, H.A. (1997) Structural characteri-
zation of an analog of the major rate-determining disulfide folding
intermediate of bovine pancreatic ribonuclease A. Biochemistry
36, 12683–12699.
28. Laity, J.H., Shimotakahara, S. & Scheraga, H.A. (1993)
Expression of wild-type and mutant bovine pancreatic ribonuc-
lease A in Escherichia coli. Proc. Natl Acad. Sci. USA 90, 615–619.
29. Sogbein, O.O., Simmons, D.A. & Konermann, L. (2000) Effects of
pH on the kinetic reaction mechanism of myoglobin unfolding
studied by time-resolved electrospray ionization mass spectrome-
try. J. Am. Soc. Mass Spec. 11, 312–319.
30. Matheson, R.R. & Scheraga, H.A. (1979) Steps in the pathway of
the thermal unfolding of ribonuclease A. A nonspecific photo-
chemical surface-labeling study. Biochemistry 18, 2437–2445.
31. Stelea, S.D., Pancoska, P., Benight, A.S. & Keiderling, T.A. (2001)
Thermal unfolding of ribonuclease A in phosphate at neutral pH:
Deviations from the two-state model. Protein Sci. 10, 970–978.
32. Muthusamy, R., M.M Gromiha. & P.K Ponnuswamy. (2000) On
the thermal unfolding character of globular proteins. J. Protein
Chem. 19, 1–8.
5322 Y B. Yan et al. (Eur. J. Biochem. 269) Ó FEBS 2002