Tài liệu Báo cáo khoa học: Infrared spectroscopy as a tool for discrimination between sensitive and multiresistant K562 cells doc
Bạn đang xem bản rút gọn của tài liệu. Xem và tải ngay bản đầy đủ của tài liệu tại đây (192.45 KB, 6 trang )
Infrared spectroscopy as a tool for discrimination between sensitive
and multiresistant K562 cells
Anthoula Gaigneaux, Jean-Marie Ruysschaert and Erik Goormaghtigh
Laboratory of Structure and Function of Biological Membranes, Free University of Brussels, Belgium
Fourier transform infrar ed spectroscopy was p erformed on
human leukemic daunorubicin-sensitive K 562 cells and their
multiresistant counterpart derived by selection. Statistical
analysis, including variable reduction and linear discrimi-
nant analysis was performed on sensitive and multiresistant
cells spectra in order to establish a diagnostic tool for
multiresistant pattern. For each of t he two methods of data
reduction tested [genetic algorith m or principal component
analysis (PCA)] discrimination between the two cell lines was
found to be possible. The best results, obtained with
PCA-reduction, showed an accuracy of 93% on a distinct
test set of spectra. These results d emonstrate the efficiency of
Fourier transform infrar ed spectroscopy for c lassification.
Further analysis o f t he spectral differences indicated that
discrimination between r esistant and sensitive cells was
based o n variations in all cellular contents. Lipid and nucleic
acid decreased, relatively, while the protein content
increased.
Keywords: multiresistance; infrared spectroscopy; multivar-
iate statistics; K562; leukemia.
In recent years, infrared spectros copy has b een a powerful
tool for biodiagnostics [1]. A major advantage of infrared
spectroscopy over more classical t echniques of investigation
is that neither s taining of t he samples nor chemical reagent
additions are necessary. Just a few minutes and a few lLof
a cell suspension are sufficient to obtain a spectrum
representative of all cell constituents.
This technique is based on absorption of infrared light by
the vibrational transitions in covalent bond s. Intensities
provide quantitative information, while frequencies give
qualitative information about the nature of these bonds,
their structure, and their molecular environment.
In complex systems such as ce lls, the main absorptions
arise from N–H, C ¼O, C–H and P¼O bonds from the
proteins, lipids, and nucleic acids present in the cells. An
infrared spectrum of cells is the sum of all these contribu -
tions. A classical group frequency approach c an be used to
interpret c hanges in one of t he cell component, as p reviously
done on leukemic cell lines [2]. Another w ay to analyse
infrared spectra is to use the s pectral signature to correlate
spectral patterns with biological properties. Rigas [3] p roved
that IR spectroscopy was a ble to detect features of human
normal or malignant cultured colonocytes. Multivariate
statistics known a s Ôpattern r ecognition techniques Õ have
been used to classify spectra in intr insic g roups when they
are unsupervised (clus ter analysis, o r principal componen t
analysis). Naumann et al. [4] successfully used cluster
analysis to characterize hundreds of bacterial cell lines. T he
same approach was also used to clearly distinguish between
normal and chronic lymphocytic leukemia cells [5]. Super-
vised multivariate methods, such a s linear discriminant
analysis (LDA) or partial least squares regression are
powerful tools t o build rules o f discrimination t hat are used
later t o i dentify n ew samples. This method was successfully
applied t o s kin tumours [6] and to l ymph c ells and tissues [7].
The multiresistant phenotype is an s ignificant problem in
cancer chemoth erapy. It i s c haracterized by cell resistance to
multiple and s tructurally unrelated drugs [8]. I t m ay be
expressed by cells selected for resistanc e to a single agent.
Many of these m ultiresistant cells differ f rom their sensitive
counterpart by overexpression of a membranous protein of
170 k Da, named P-glycoprotein (P-gp) [9]. Although the
sole presence of P -gp has proven in s ome cell lines to con fer
multidrug resistance phenotype [10], previous studies have
shown that molecular c hanges in lipid an d nucle ic acid
fractions of the cells accompany P -gp overexpression
[11,12].
In this study, w e worked with sensitive (K562/DNS) and
multiresistant (K 562/DNR) human chronic myelogenous
leukemia K562 cells. First, we examined whether infrared
spectroscopy, a ssociated w ith d ata reduction techniques a nd
multivariate statistics, is a ble t o identify multidrug resistant
phenotype in t hese cells with a high accuracy. S econd, we
tried to learn more about biological origin of the spectral
differences that exist b etween the K562-multiresistant cell
line and its sensitive counterpart.
MATERIALS AND METHODS
Cell culture
K562 is a human chronic myelogenous leukemia cell line. In
this study, two different K 562 lines were used. The first cell
line ( cell line A) has been described p reviously [13]. A second
Correspondence to G. Erik, Laboratory of Structure and Function of
Biological Membranes, Free University of Brussels, CP 206/2,
Boulevard du Triomphe, B-1050 Brussels, Belgium.
Fax: + 32 2 650 5382, Tel.: + 32 2 650 5386,
E-mail:
Abbreviations: P-gp, P-glycoprotein; K562/DNS, sensitive K562 cells;
K562/DNR, daunorubicin resistant K562 cells; PCA, principal com-
ponent analysis; LD A, linea r discriminant analysis; MDR, multidrug
resistant.
(Received 4 January 2002, acc epted 21 J anuary 2002)
Eur. J. Biochem. 269, 1968–1973 (2002) Ó FEBS 2002 doi:10.1046/j.1432-1033.2002.02841.x
cell line ( cell line B ) was obtained from A. Delforge (Bordet
Hospital, Bruxelles). F rom each cell line (K562/DNS), a
multiresistant subline (K562/DNR) was derived by s election
on daunorubicin. All cell lines were kept in exponential
growth in RPMI 1640 medium, s upplemented w ith 10%
fetal bovine serum,
L
-glutamine (2%), and 1% antibiotic/
antimycotic solution, at 37 °C, in an humidified atmosphere
of 5% CO
2
. All growing media and supplement w ere
purchased at Life Technologies (Paisley, Scotland). To
maintain resistance phenotype, K562/DNR was selected in
a m edium c ontaining 1 l
M
daunorubicin or doxorubicin for
1 w eek every 2 months. A ll infrared measurements were
carried out at least one week after the interruption of culture
with selection agent. The cell lines were maintained at the
same density of cells and then harvested in the same phase of
culture growth (exponential) for IR measurement.
For h arvesting, cells were centrifuged 3 min at 300 g and
the pellet washed twice in a solution 0 .9% N aCl t o r emove
all growing medium.
FTIR spectroscopy
An aliquot of cell p ellet was deposited on a g ermanium
crystal ( 2–5 · 10
5
cells per smear). The sample was
rapidly e vaporated in N
2
flux to obtain a homogenous film
of entire cells. IR m easurements were recorded be tween
4000 a nd 8 00 cm
)1
by a Bruker E quinox spectrophotometer
(Bruker, Karlsruhe, Germany) containing a liquid
N
2
-refrigerated Mercury Cadmium Telluride detector. Each
spectrum w as obtained by averaging of 256 scans at a
resolution of 4 cm
)1
. T he spectra were baseline c orrected
and nor malized f or equal area b etween 1711 and 1485 cm
)1
.
Spectra were encoded every 1 cm
)1
.
Data analysis
All spectra were treated with i n-house s oftware w orking in a
MATLAB
environment (
MATLAB
6, Mathworks Inc., Natick,
USA). Spectra were separated in a training set constituted of
48 samples o f the cell line A and a test set c omposed of 30
spectra of cell line A and cell line B. The trainin g set was the
only one used for model calculations (PCA, genetic
algorithm and LDA).
Data reduction by principal component analysis (PCA).
IR spectra are samples defined by 3000 variables. To
reduce this number, PCA was performed. PCA is a method
of variable reductio n that builds linear combinations
between variables (wavenumbers) varying together. The
first linear combination is called the first principal c ompo-
nent, a nd contains almost 98% of the variance. The second
principal c omponent is a linear combination of wavenum-
bers, which explains t he maximum of residual variance and
is perpendicular to the first one. The following principal
components obey the sam e rules. This method allows the
reduction of a spectrum to 1 0 v ariables (th e first 10 principal
components) that explain almost 100% of v ariance.
Selection of wavenumbers with genetic algorithm.The
genetic a lgorithm is a supervised method that uses muta-
tion/selection principles to solve problems [14]. Many
parameters can be adjusted for increasing the efficiency of
the algorithm. The data were analysed with a window of five
wavenumbers, assuming that adjacent wavenumbers are
highly corr elated. A population o f 3 2 solutions was built at
each generation, and e valuated. The algorithm stopped a t
generation 100 or when 50% of convergence was reached
between all the solutions. The mutation rate was 0.005, with
double c rossing-over, and data were divided in nin e subsets
to cross-validate the models.
As the solutions proposed by this method are not
deterministic, running the algorithm several times allows a
more precise solution to be obtained. Only the wavenum-
bers selected in more than 80% of all m odels built wer e kept
in the final model.
Linear discriminant analysis (LDA).Thisstatistical
multivariate method is supervised. It searches for the
variables containing the greatest interclass variance and
the smallest intraclass variance, and constructs a linear
combination of the variables to discriminate between the
classes. The rule i s constructed with training set of samples,
and further tested with the test set. We performed LDA in
standard method, i.e. including all the variables in the
model.
RESULTS
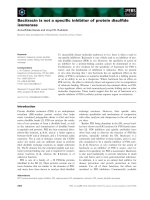
Spectral information contained in a cell IR spectrum
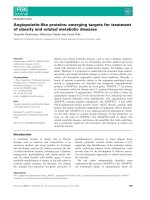
Figure 1 (line A) shows a representative spectrum of K 562/
DNS cells, whic h can be divided in three regions. The
absorption between 300 0 and 2800 cm
)1
is dominated by
the stretching vibration of CH
2
and CH
3
groups mainly
contained in fatty acids of the cell. The band at 2963 cm
)1
can be a ssigned to the asymmetric stretching of CH
3
,and
the band at 2 873 cm
)1
to its symmetric mode. T he bands at
2926 and 2853 cm
)1
can be a ssigned to an asymmetric and
symmetric stretching mode of CH
2
, r espectively [1]. The
peak shoulder present at 1740 cm
)1
canbeassignedtothe
ester C¼O s tretching of phospholipids [15,16], not present
in DNA and proteins. Between 1700 and 1300 cm
)1
,
contributions are primarily due to proteins, with some
Fig. 1. K5 62 cell s pectrum and spectral areas se lected by ge netic a lgo-
rithm. A smear of about 2 · 10
5
cells was dried on an area o f 2 cm
2
on
the germanium surface as explained in Materials and methods.
Wavenumbers selected by g enetic algorithm a re in shaded.
Ó FEBS 2002 K562 cell classification by FT1R (Eur. J. Biochem. 269) 1969
absorptions from lipids. The stretching o f protein amide
C¼O b onds arises at 1650 cm
)1
(amide I). The deformation
of protein amide N–H bond appears at 1 540 cm
)1
(amide
II) [15]. The 1450 and 1400 cm
)1
bands arise from the side
chain o f p roteins [ 15], but the C –H bend ing vibration of
fatty acids at 1467 and 1450 cm
)1
[3] and the carboxylate
vibration o f fatty acids at 1400 cm
)1
[17] are s uperimposed.
Absorptions between 1300 and 900 cm
)1
arise mainly
from phosphate associated with nucleic acids, i.e. DNA
and RNA. The a bsorption bands a t 1245 a nd 1087 cm
)1
are c haracteristic o f asymmetric and symmetric pho spho-
diester vibration of nucleic acids [15]. In glycogen-poor cells
such as lymphocytes, B enedetti et al. assigned the shoulders
present at 1117 and 1020 cm
)1
to RNA and DNA,
respectively [1 8].
Classification by LDA
LDA was applied t o discriminate t he two c ell lines. T he
large number of variables ( 3000) of an infrared spectrum
is a p roblem for t his a pproach that needs more observations
than variables. W e attempted to reduce this number b y two
distinct methods: genetic algorithm (supervised method),
and PCA (unsupervised method).
Classification by LDA on spectra restricted by genetic
algorithm
Genetic algorithm was performed on the training set
composed of K562/DNR (22 spectra) and K562/DNS
(26 s pectra) cells. Each spectrum was obtained for another
cell culture. The 48 spectra were accumulated over a
period of eight months. The region between 2800 and
1800 cm
)1
, which does not contain any chemical infor-
mation excepted from atmospheric CO
2
, was discarded.
After 16 runs of th e algorithm, w e selected wavenumbers
present i n more t han 80% of the 185 models built. They
were distributed in 10 regions of the spectra (Fig. 1),
including several areas in lipid and in nucleic acid regions,
and one area associated with proteins (amide II). T raining
set spectra were used for mo del building in L DA. The
model was tested with the 30 test s pectra (not inc luded in
the training set) on which the global accuracy was 73%
(Table 1). About the half of the resistant spectra were
classified i n the sensitive class.
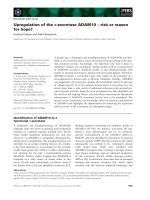
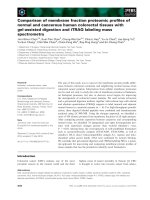
Classification by LDA on spectra reduced by PCA
PCA was performe d on t he training set. At this stage, only
two or three principal c omponents were sufficient to obtain
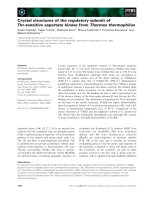
a partial separation between the two cell lines; Fig. 2 shows
the s pectra reduced with PCA proje cted on vector 2 and
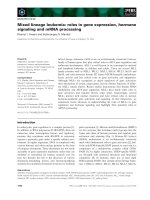
vector 4. Each one of these two vectors (Fig. 3) h as
features at characteristic wavenumbers of nucleic acids,
lipids, and protein. I t is i nteresting to note that, in the
second vector, a negative influence of 1625 cm
)1
(attribut-
ed to a b eta sheet secondary structure of proteins) is
associated with a positive value of 1 667 cm
)1
(a helix
secondary structure). This may reflect a m odification i n t he
global secondary structure c omposition in the c ells.
Reduced training set spectra was used for model building
in LDA. The results obtained show 100% of co rrect
classification f or the t raining set. F or the test sets ( Table 2),
the global accuracy was 93%.
Table 1 . Results of LDA f or spectra of t he test s e t w he n spectra were
reduced b y genetic algorithm. Overall a ccuracy on the training set w as
100% and overall accuracy on the t est set is 73%. Actual assi gnments
in columns, LDA p redicted assignments i n rows.
K562/DNS K562/DNR Accuracy
K562/DNS 7 0 100%
A line
K562/DNS 6 0 100%
B line
K562/DNR 6 5 45%
A line
K562/DNR 2 4 67%
B line
Fig. 2. Two -dimensional plot of PCA-reduced s pectra of K5 62 cells.
Resistant K562 cells (39 spectra, black stars), sensitive K562 cells
(39 sp ectra, circles) o f the training (full) and test s et (empty). The
percentage of variance represe nted by ea ch co mpo nent is ind icated on
the axes.
Fig. 3. Princ ipal components w hich allow a partial separation between
resistant and sensitive K562 cells. (A) Second ve ctor. (B) Fo urth vector.
All components are on the same scale.
1970 A. Gaigneaux et al. (Eur. J. Biochem. 269) Ó FEBS 2002
Assignment of the spectral discrimination to the
resistant phenotype
As suggested by a r eviewer, it remains a possibility that the
difference observed between sensitive and resistant K562
cells is the result of a natural divergence and i s not related to
the multiresistant phen otype. In o rder to test this hypoth-
esis, we obtained another K562 cell line (Ôcell line BÕ,as
described in Materials and methods) with sensitive and
resistant sublines. Spectra of these new cell lines were
included in the test spectra set. Tables 1 and 2 show that
spectra of the B cell line were correctly classified by the
discriminant vector constructed on the A cell line in the
same proportion as spectr a of the A cell line. This result
indicates that t he discriminant vector constructed by LDA
reflects the multiresistant phenotype in K562 cells instead of
a natural variation occurring between cell lines.
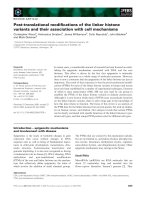
Biochemical origins of the difference between K562/DNS
and K562/DNR spectra
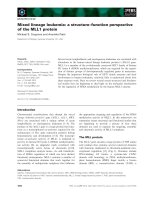
Figure 4 reports the m ean spectra of K562/DNS (curve a),
K562/DNR (curve b), a nd the spectrum obtained b y
difference between these two cells lines (sensitive cells
spectrum minus its r esistant counterpart; curve c). Regions
where the spectra of the two cell lines are significantly
different were determined by Student t-test (shaded areas).
In the CH region (3000–2800 cm
)1
), spectra display
significant differences, indicating that the resistant cells have
a p rotein/lipid ratio higher t han s en sitive cells (Table 3). The
decrease of intensities at 1740 cm
)1
(C¼O bonds of lipids) is
also consistent with a decrease of lipid content in multire-
sistant cells. In addition , t he ratio of CH
3
/CH
2
,calculatedas
the ratio of absorbance at 2871 cm
)1
over the a bsorbance a t
2853 c m
)1
, is also significantly higher in K562/DNR cells
than in K562/DNS cells (Table 3). T hese res ults s uggest that
a lipid/protein ratio m odification occurs in the resistant
phenotype. Because proteins contain, on the average, an
equal amount of methyl and methylene groups, a protein
change alone would have modified the CH
3
stretching as
well as the CH
2
stretching to the s ame extent.
As indicated by the Student’s t-test, the difference
between K 562/DNR a nd K 562/DNS cells is not significant
in the amide protein. This is not surprising as spectra were
normalized for equal content of proteins. But a qualitative
change of the proteins, for example i n t heir global secondary
structure, would have led to a modification in the shape of
amide I peak (1 700–1600 cm
)1
).
The K 562/DNR cells exhibit a significant decrease of
absorption in the 1300–900 cm
)1
region, characteristic of
the protein/nucleic acid ratio. The DNA/RNA ratio,
calculated as the r atio of the intensity at 1020 cm
)1
(representative of DNA) by the intensity a t 1121 cm
)1
(representative o f RNA), is not significantly different
between K562/DNS and K562/DNR cells.
The discriminant vector constr ucted by L DA with the
spectra reduced by PCA is shown o n t he Fig. 4 (curve d).
This vector is quite similar to the difference spectra.
DISCUSSION
Many studies have provided evidence that infrared spec-
troscopy is a useful a nd powerful tool to screen cell and
tissue evolution occurring during c ancer progression. The
aim of this study was to show that among similar cancerous
cell lines, a subtle change such as expression o f MDR
phenotype can be identified by infrared spectrosc opy.
Fig. 4 . Compariso n of spectra and s pec tral features responsible for cell
type determination. (A) Mean spectrum of sensitive K562 cells. (B)
Mean spectrum of resistant K562 cells. (C) Difference spectrum (sen-
sitive/resistant) magnified by five. (D) Significant differences are
shaded (a ¼ 1% ). Discriminant vector built by LDA.
Table 2. R esults of LDA for spectra of the tes t se t w hen s pectra were
reduced by PCA. Overall a ccuracy o n t he training set was 10 0% and
overall accuracy on t h e test set i s 93%. Actual assignmen ts in columns,
LDA predicted assignments in rows.
K562/DNS K562/DNR Accuracy
K562/DNS 7 0 100%
A line
K562/DNS 4 2 67%
B line
K562/DNR 0 11 100%
A line
K562/DNR 0 6 100%
B line
Table 3. R esults of Student t-tests for equality of m ean between resistant
(22 spectra) a nd sensitive (26 spectra) K562 cells. Spectra were nor-
malized for e qual s urface b etween 1711 and 1585 cm
)1
. Lipid/P rotein:
area between 3000 a nd 2800 cm
)1
/area of Amide I. CH
3
/CH
2
: 2871/
2853 cm
)1
absorbance ratio. N ucleic acids/protein: 1085/1653 cm
)1
absorbance r atio. DNA/RNA: 1020/1121 c m
)1
absorbance ratio.
K562/DNR
(mean ± SD)
K562/DNS
(mean ± SD) P-value
Lipid/protein 10.42 ± 0.71 11.48 ± 0.69 3.2 · 10
)6
CH3/CH2 0.842 ± 0.11 0.732 ± 0.071 2.8 · 10
)5
Nucleic acids/protein 0.25 ± 0.025 0.28 ± 0.02 2.8 · 10
)5
DNA/RNA 0.29 ± 0.063 0.278 ± 0.062 0.46
Ó FEBS 2002 K562 cell classification by FT1R (Eur. J. Biochem. 269) 1971
To reduce t he number of variables, we used t wo different
methods, genetic algorithm and PCA. In our case, PCA
seemed to be the best method. Moreover, PCA is a
nonsupervised m ethod and avoids d iscarding t he greatest
part of the original data information.
In the second part of our work, we focused on the
biochemical information available i n infrared s pectra, and
we found that infrared spectra of resistant K562 cells are
significantly modified relative t o their sensitive counterpart
at all molecular levels.
The protein/nucleic acid ratio is significantly higher in
resistant cells. As discussed b efore, this can be caused
either by a real decrease in n ucleic acid content o r by a n
increase of the compaction state of DNA possibly related
to the cell cycle stage. Concerning the latter h ypothesis,
Boydston-White et al. reported that among nucleic acid
absorption bonds, RNA contribution can be prominent
when cells are i n G1 an d G2 ph ases, because h ighly
compacted DNA is opaque to infrared light [19]. In fact,
less condensed chromatin in K562 MDR cells in G1
phase (com pared to their sensitive c ounterpart in G1 cell
phase) has been previously reported [20], suggesting that
our experimental results can not be explained b y c hrom-
atin condensation. In favour of the former hypothesis,
flow cytometry studies on K562 MDR cell lines have
shown a relative de crease in DNA co ntent at con stant cell
phase distribution o f cells [12]. Our results a re therefore
consistent with a r eal decrease i n nucleic acid content i n
resistant K562 cells.
At the lipid level, we observed in r esistant cells a d ecrease
of the absorptions assigned to fatty a cids and phospholipids
relative to their protein content. This qua ntitative change
was accompanied by qualitative modification, as the
methyl/methylene CH
3
/CH
2
ratio w as fou nd to increase
significantly in these cells. A nuclear magnetic resonance
study of these cells had s hown previously that multiresistant
cells had a higher fatty acid methyl/methylene ratio when
cultured in the absence of drug [11]. This feature was
partially reversed after about 50 passages w ithout selection.
As our c ells were se lected eve ry t wo mo nths in a medium
containing doxorubicin, we did not observed such a
reversion. The precise origin of the methyl/methylene ratio
increase remains to be determined; it may arise only from a
decrease of lipid content i n resistant cells, but can also be
associated with a modification of the membrane composi-
tion. The m ain modification r eported i n m ultiresistant cells
is the p resence o f P -gp in the cell membrane [21]. This
protein was found to have an evident c onnection with its
membrane environment [22]. So far, it not clear whether the
presence of P-gp modifies the membrane composition and
ultrastructure as reported by Arsenault et al. on CHO cells
[23], or if the s election process independently induces bo th
P-gp overexpression and membrane modifications [11]
(reviewedin[24]).
A particularity of the ATR approach is that the cells are
sampled with the evan escent fi eld, the i ntensity of which
decays exponentially as a function of the distance from t he
reflecting interface. In turn, spectral d ifferences may a rise
from either a difference in the chemical composition or from
a different distribution of the chemicals along an axis
perpendicular to the reflecting interface. This feature
precludes definitive conclusions on the overall chemical
composition of the different cell lines.
In this study, w e conclude th at infrared spectroscopy is a
useful tool to identify K562 multiresistant cell lines. W e also
demonstrated that infrared spectroscopy is a powerful tool
for investigating the global biochemical modifications
related to the multiresistant phenotype.
ACKNOWLEDGEMENTS
Anthoula Gaigneaux is recip ient of a Televie Grant from the Fonds
National de l a Recherche Scientifique (Belgium). We thank A. Delforge
and C. D orval for giving us the second K562 ce ll line.
REFERENCES
1. Jackson, M., S owa, M.G. & Mantsch, H.H. ( 1997) Infrared
spectroscopy: a new frontier in med icine. Biophys. C hem 68,
109–125.
2. Le Gal, J.M., Morjani, H. & Manfait, M. (1993) Ultrastructural
appraisal of the multidrug r esistance in K562 and L R73 cell lines
from Fourier transform infrared spectroscopy. Cancer Res. 53,
3681–3686.
3. Rigas, B. & Wong, P.T. ( 1992) Human c olon adenocarcinoma cell
lines display in frared sp ectrosco pic fe atures o f m alignant c olon
tissues. Cancer Res. 52, 84–88.
4. Na um ann, D., Helm, D. & Labischinski, H. (1991) Micro-
biological characterization s by FT-IR spec troscopy. Nature 351 ,
81–82.
5. Schultz, C.P., Liu, K., J ohnston, J.B. & Mantsch, H.H. (1996)
Study of chr onic lymphocytic l euke mia cells b y FT-IR spectro-
scopy and cluster a nalysis. Leuk. Res. 20, 649– 655.
6. McIntosh, L.M., Jackson, M., Mantsch, H.H., Stranc, M.F.,
Pilavdzic, D. & C rowson, A.N. (1999) I nfrared spectra of basal
cell carcinomas are distinct from non-tumor-bearing s kin c om-
ponents. J. Invest. Dermatol. 112, 951–956.
7. Haaland, D.M., Howland, D.T.J. & Thom as, E.V. ( 1997) Multi-
variate classification of the infrar ed spectra o f cell and tissue
samples . Appl. Spectrosc.51, 340– 345.
8. Pastan, I . & Gottesman, M. (1987) Multiple-drug resistance in
human cancer. N.Engl.J.Med.316, 1388–1393.
9. Kartner,N.,Evernden-Porelle,D.,Bradley,G.&Ling,V.(1985)
Detection of P-glycoprotein in multidrug-resistant cell lines by
monoclonal antibodies. Nature 316, 820–823.
10. Ueda, K., Cardarelli, C., Gottesman, M.M. & Pastan, I. (1987)
Expression of a f ull-length cD NA fo r the hu man M DR1 ge ne
confers r esistan ce to colchicine, doxorubicin, and vinblastine.
Proc. Natl Acad. Sci. USA 84 , 3004–3008.
11. LeMoyec,L.,Tatoud,R.,Degeorges,A.,Calabresse,C.,Bauza,
G., Eugene, M. & C alvo, F. ( 1996) Proton nuclear m agnetic
resonance spectroscopy reveals cellular lipids involved in
resistance to adriamycin and t axol by t he K5 62 leukemia c ell line.
Cancer Res. 56, 3461–3467.
12. Palissot, V., Liautaud-Roger, F., Carpentier, Y. & Dufer, J. (1996)
Analysis of DNA c ontent in multidrug-resistant cells by image and
flow cytometry. Cell Prolif. 29, 5 49–559.
13. Praet, M., Stryckmans, P. & Ruysschaert, J.M. (1996) Cellular
uptake, cytotoxicity, and transport kin etics of anthrac yclines in
human sensi tive and multidrug-resistant K562 cells. Biochem.
Pharmacol. 51, 1341–1348.
14. Forrest, S. ( 1993) Genetic a lgorithms: principles of natural s el ec-
tion applied to c om putat ion. Science 261, 872–878.
15. Diem, M., Boydston-White, S. & Chiriboga, L. (1999) infrared
spectroscopy of cells and tissues: shinin g light on a n ovel subject.
Appl. Spectrosc. 53, 148A –16 1A .
16. Wong, P .T., Wong, R .K., Caputo, T .A., Godwin, T .A. & Ri gas, B .
(1991) Infrared spectroscopy of exfoliated human cervical c ells:
evidence of extensive structural changes during carcinogenesis.
Proc. Natl Acad. Sci. USA 88 , 10988–10992.
1972 A. Gaigneaux et al. (Eur. J. Biochem. 269) Ó FEBS 2002
17. J ackson, M., Choo, L.P., Watson, P.H., Halliday, W.C. &
Mantsch, H.H. (1995) Beware of connective tissue proteins:
assignment and implications of collagen absorptions in infrared
spectra of h uman tissues. Biochim. Biophys. Acta 1270,1–6.
18. B enedetti, E ., Bramanti, E ., Papineschi, F . & Rossi, I . ( 1996)
Determination of the relative amount of nucleic aion of t he
relative amount of nucleic acids in leukemic and normal
lymphocytes by means of FT-IR microspectroscopy. Appl. Spec-
trosc. 51, 792–797.
19. B oydston-White , S., Gopen, T., Houser, S., Bargonetti, J . &
Diem, M. ( 1 999) In frared sp ec troscop y of human tissue. V .
Infrared spectroscopic s tudies of my eloid leukemia ( ML-1 ) cells at
different phases of t he cell c ycle. Biospectroscopy 5, 2 19–227.
20. D ufer, J., Millot-Broglio, C., Oum’Hamed, Z., Liautaud-Roger,
F., Joly, P., Desplaces, A. & Jardillier, J.C. (1995) Nuclear DNA
content a nd chromatin texture in multidrug-resistant human l eu-
kemic c ell lines. I nt. J. Cancer 60, 108 –114.
21. Nielsen, D. & Skovsgaard, T . (1992) P-glycoprotein as multidrug
transporter: a critical review of current multidrug resistant cell
lines. Biochim. Biophys. Acta 1139, 169–183.
22. W adkins, R .M. & Ro ep e, P.D. (1997) Biophysical a spects of
P-glycoprotein-mediated m ultidrug resistance. Int. Rev. Cytol.
171, 121–165.
23. Arsenault, A.L., Ling, V. & Kartner, N. (1988) Altered plasma
membrane ultrastructure in multidrug-resistant cells. Bioc him.
Biophys. Ac ta 938, 315–321.
24. Ferte, J. (2000) Analysis of the t angled relationships between
P-glycoprotein-mediated multidrug re sistance and the lipid phase
of the cell membrane. Eu r J. Biochem. 267, 2 77–294.
Ó FEBS 2002 K562 cell classification by FT1R (Eur. J. Biochem. 269) 1973